Sample Category Title
Forex Technical Analysis: EUR/USD, USD/JPY, GBP/USD
EUR/USD
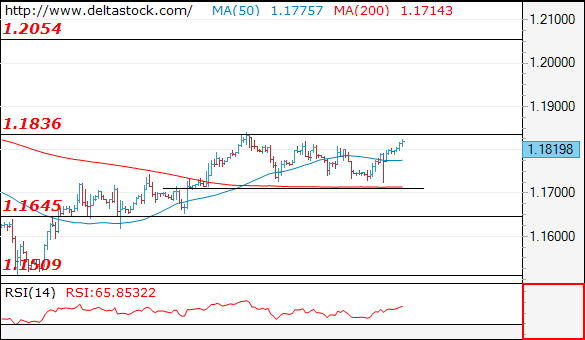
Current level - 1.1819
The corrective pattern below 1.1830 is over with yesterday's low at 1.1725 and the bias is positive, for a break through 1.1836, towards 1.2050 zone. The market could remain on hold till ECB rate announcement today and unwind a bullish move afterwards.
| Resistance | Support | ||
| intraday | intraweek | intraday | intraweek |
| 1.1830 | 1.1830 | 1.1710 | 1.1480 |
| 1.1900 | 1.2060 | 1.1650 | 1.1300 |
 USD/JPY
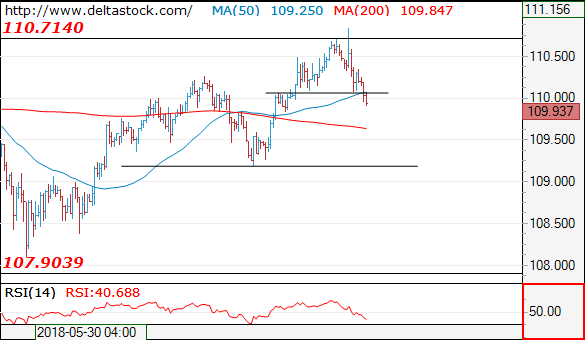
Current level - 109.93
The short-lived spike to 110.80 was the final leg of the upmove since 108.10 low and my outlook is bearish, for a slide towards 109.20, en route to 107.90.
| Resistance | Support | ||
| intraday | intraweek | intraday | intraweek |
| 110.70 | 111.40 | 109.20 | 107.80 |
| 111.40 | 114.40 | 107.80 | 106.70 |
GBP/USD
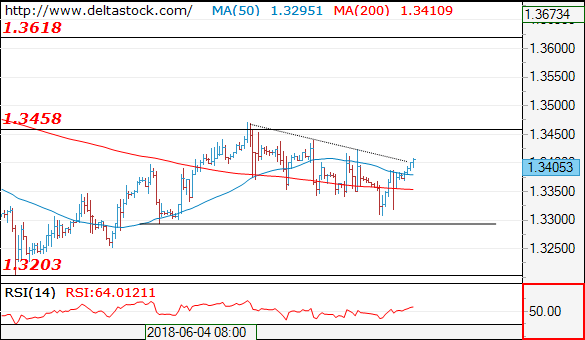
Current level - 1.3405
Yesterday's dip to 1.3306 should be enough to complete the consolidation pattern below 1.3460 and my outlook is already bullish, for a break through the mentioned hurdle, towards 1.3620 area.
| Resistance | Support | ||
| intraday | intraweek | intraday | intraweek |
| 1.3460 | 1.3618 | 1.3290 | 1.3210 |
| 1.3620 | 1.3990 | 1.3290 | 1.3040 |
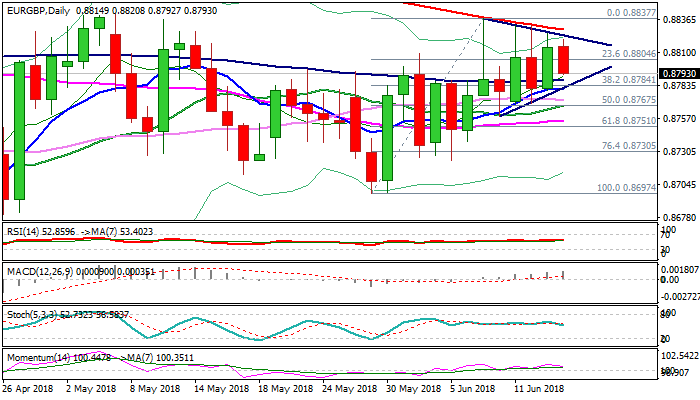
EURGBP Outlook – Triangle Support Line Comes Under Pressure As Cross Falls On Upbeat UK Data
The cross fell below 0.88 handle and cracked daily cloud top (0.8794) after upbeat UK retail sales boosted pound, sidelining attempts for another attack at 200SMA.
Falling 200SMA (currently at 0.8828) repeatedly capped upside attempts in the past week, with strong rejections which left daily candles with long upper shadows, confirming the strength of barrier.
Daily studies remain in bullish setup and favor fresh upside, however, narrowing range in past few sessions formed a triangle, which could be seen as initial signal of stall of larger uptrend.
Indicators on daily chart (RSI / momentum) are turning lower and support scenario, but stronger reversal signal would be generated on close below pivotal supports, provided by: daily cloud top (0.8794: 100SMA (0.8788) and triangle support line / Fibo 38.2% of 0.8620/0.8840 (0.8784).
Bullish signal could be expected on break above triangle resistance line (0.8823), but eventual break and close above 200SMA is needed neutralize downside risk and signal bullish continuation.
Res: 0.8823, 0.8828, 0.8837, 0.8885
Sup: 0.8784, 0.8772, 0.8768, 0.8755
NZDUSD Stands In Bollinger Band With Weak Momentum, Consolidating In Near Term
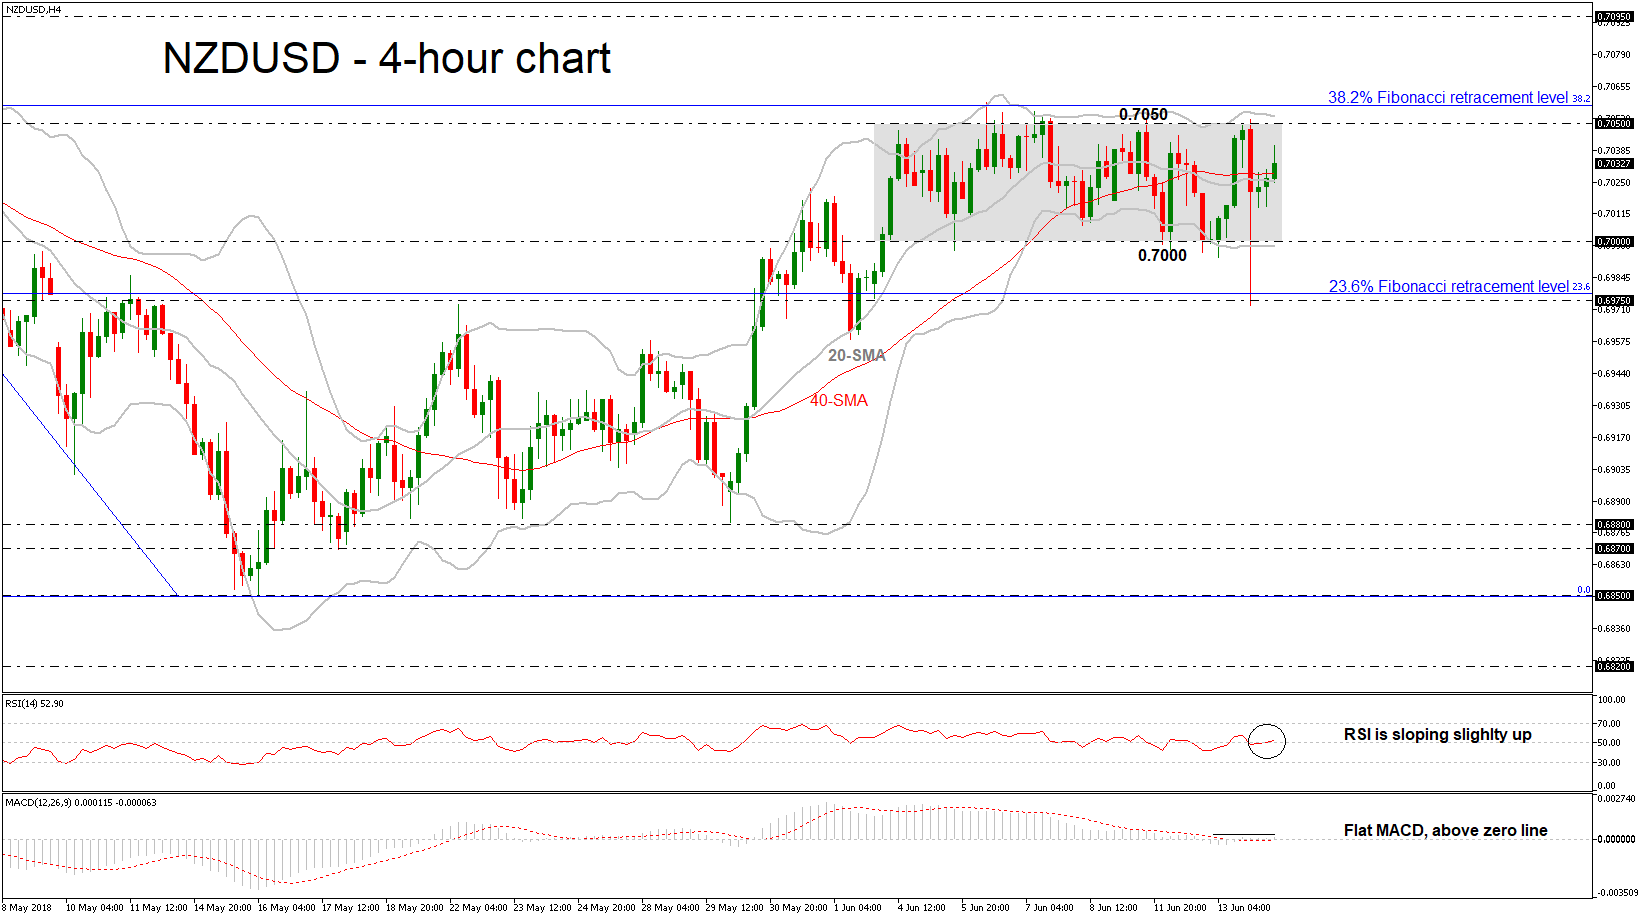
NZDUSD has been trading within a consolidation area over the last ten days with upper boundary the 0.7050 resistance level, which holds near with the upper boundary of the Bollinger Band, and lower boundary the 0.7000 handle, which coincides with the lower Bollinger Band. Moreover, the technical indicators are sending neutral signals, suggesting that the sideways move will continue.
In the 4-hour chart, the RSI indicator is holding near the threshold of 50 and is moving slightly higher with weak momentum, while the MACD oscillator is flattening around the zero line, supporting the neutral picture as well.
If the market manages to pick up speed above the 0.7050 barrier and passes the 38.2% Fibonacci retracement level of the downleg from 0.7395 to 0.6850, around 0.7060, then the 0.7095 hurdle could offer nearby resistance. A leg above this significant resistance could be found at the 50.0% Fibonacci of 0.7120.
However, should prices decline, immediate support could be found at the 0.7000 handle, near the previous lows. A drop below the aforementioned obstacle could open the door for the 23.6% Fibonacci which stands near the 0.6975 support level.
CAD/CHF 4H Chart: Decline Continues
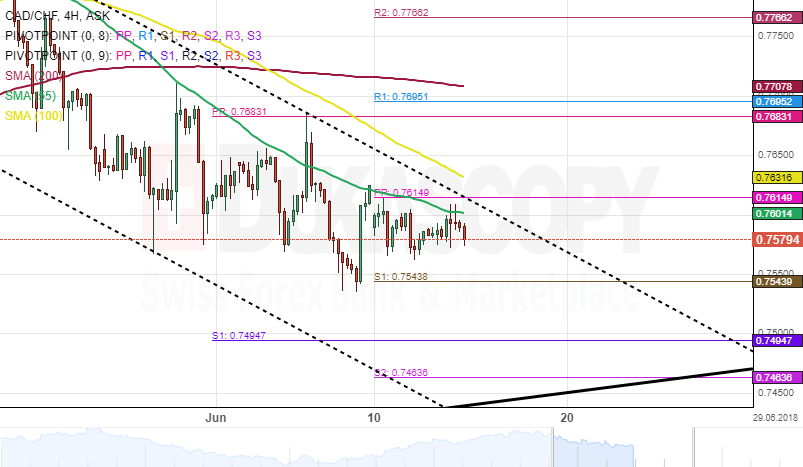
The Canadian Dollar movement against the Swiss Franc has been guided by one month descending channel. The currency pair reversed south after hitting the upper boundary of a dominant channel.
This movement could be considered a corrective move down toward the lower boundary of the dominant pattern. Moreover, the 55-hour simple moving average has been directing the pair lover.
Everything being equal, the CAD/CHF currency exchange rate is likely to continue to depreciate until it reaches the southern border of the aforementioned dominant descending channel.
CAD/JPY 4H Chart: Maintains Channel
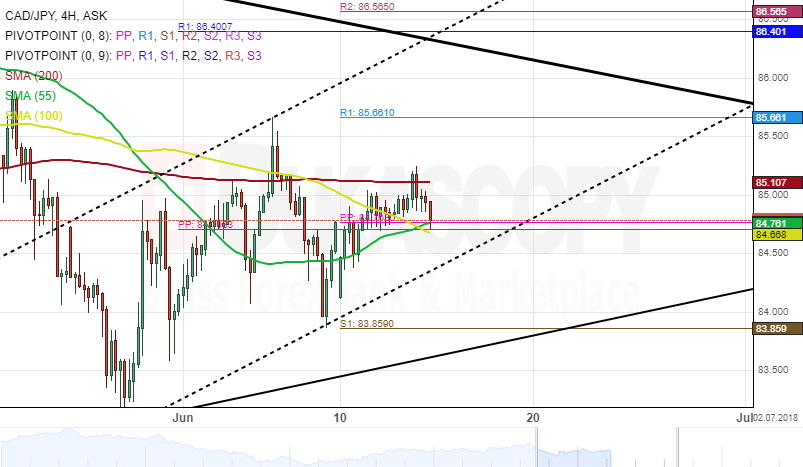
The price movement of the CAD/JPY currency pair has been constrained by two ascending channels. The most recent pattern which was formed on May 30 and is currently guiding the rate higher.
After retesting the lower boundary of a junior pattern where the weekly pivot point at 83.85 is located, the exchange rate continues its journey north. This junior ascending pattern has been holding for the second week running.
Given that the currency exchange rate has breached a strong resistance level located near the 84.92 area, the pair is likely to continue gaining strength until it reaches the upper boundary of a dominant channel.
EURUSD Analysis: Accelerates From 1.1740
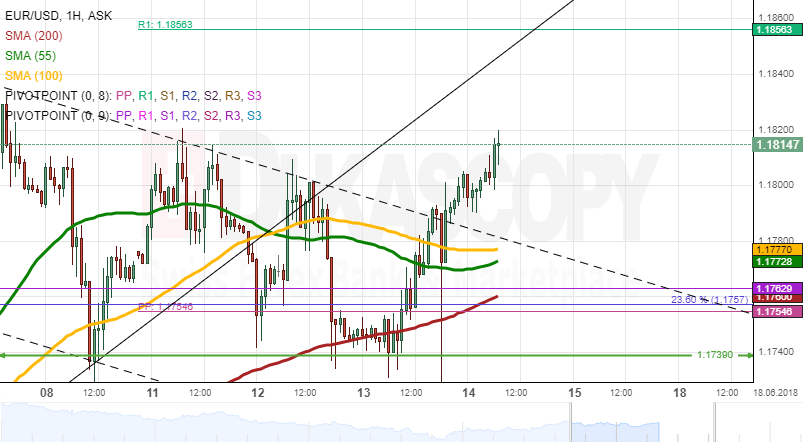
Wednesday's trading session was beneficial for bulls, as the Euro managed to gain 65 pips against its American counterpart during the second part of the day. This surge started when the pair failed to move below the 55-period (4H) and 200-hour SMAs at 1.1740. This level has likewise been a strong resistance/support level since May 21.
Along the way, the rate breached the upper boundary of a one-week descending triangle. This should result in further advance that is expected to occur if the 200-period (4H) SMA at 1.1813 is breached. The daily high in this scenario should be the weekly R1 at 1.1856.
In the meantime, the pair should be supported by the 55-, 100– and 200-hour SMAs and the monthly and weekly PPs in the 1.1755/1.1780 range.
GBPUSD Analysis: Overcomes Resistance
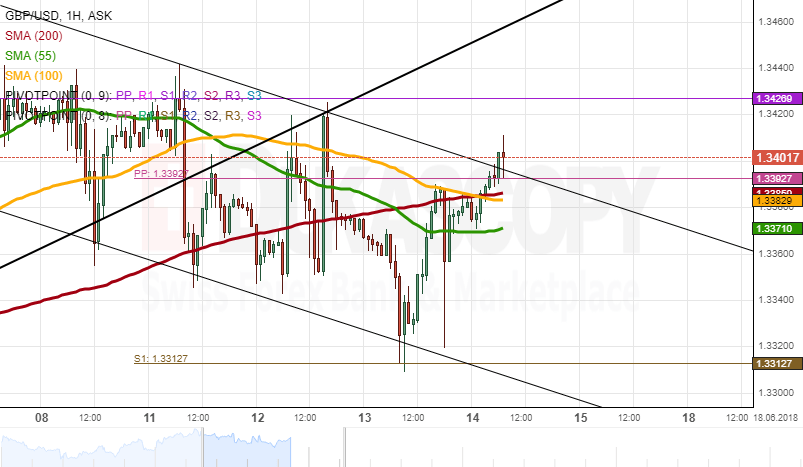
GBP/USD was trading between the 200-hour SMA and the weekly S1 on Wednesday. Bulls gained the dominant hand during the second half of the session; however, gains were limited by the strong resistance of the 55-period (4H), 100– and 200-hour SMAs.
This barrier was breached early today, thus pointing to a soon breakout of the five-day descending channel and a continuous surge. The positioning of technical indicators demonstrate that there is still some upside potential that could be realised today. The nearest level of resistance is the monthly PP at 1.3427, while the Sterling might likewise target the breached channel line at 1.3475.
In case this was a false breakout, the rate is likely to fall back down to the weekly S1.
USDJPY Analysis: Faces Strong Support Barrier
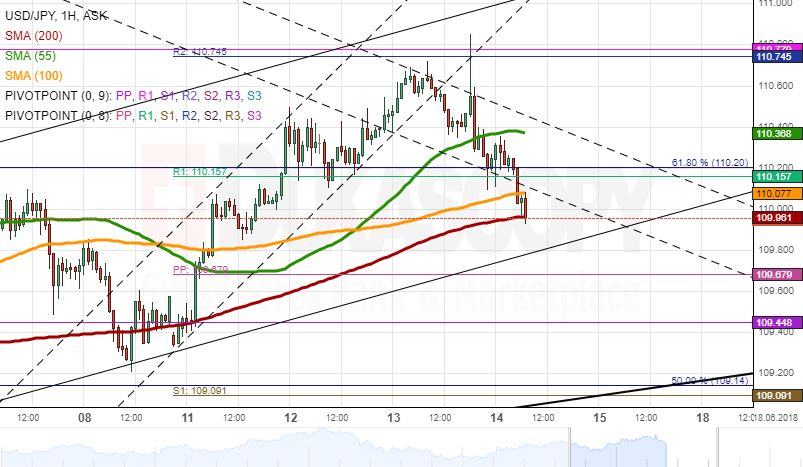
A test of the weekly R1 and the monthly R1 at 110.75 mid-Wednesday, the USD/JPY began a new wave down. This bearish momentum has sent the pair as low as the 100– and 200-hour SMAs this morning.
It is likely that the pair still edges lower during the following hours prior to reversing somewhere near the 109.70 area. The 200– and 100-period (4H) SMAs and a channel line are also located nearby. It seems that yesterday's fall was only a slight correction against the general up-trend.
Thus, it is expected that the prevailing three-week ascending channel continues to be respected. The daily high today should be the aforementioned 110,75 territory, while a decline should not exceed the monthly PP at 109.45.
Gold Analysis: Likely To Trade In Range Again
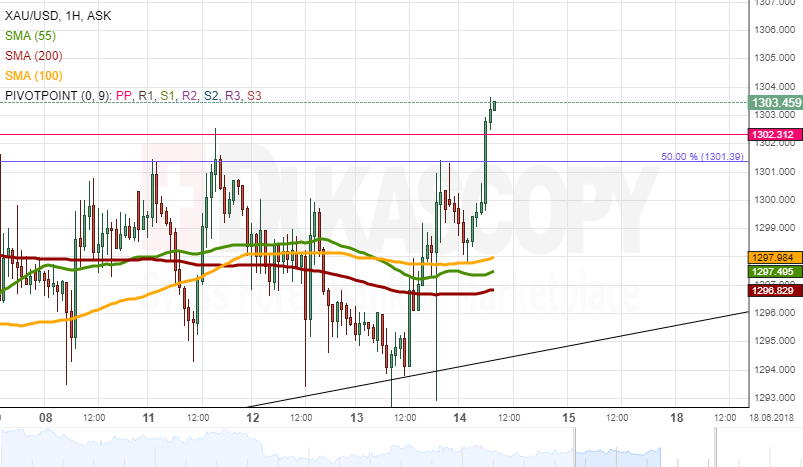
XAU/USD has not left its narrow trading range for the sixth consecutive session. After reversing from the 1,295.00 mark yesterday, Gold gained momentum and dashed through the 55-, 100– and 200-hour SMAs. The pair tested the 50.00% Fibonacci retracement near 1,300.00 once again but failed to move above it.
In general, it is unlikely that the given commodity gains some additional bullish momentum in this session, as the 200-period (4H) and 200-day SMAs and the monthly PP are restricting a move above the 1,302.00/1,307.00 area.
Thus, the pair should either fluctuate in a narrow range between this resistance and the aforementioned hourly SMAs or approach the senior channel and the 61.80% Fibo near 1,290.00.
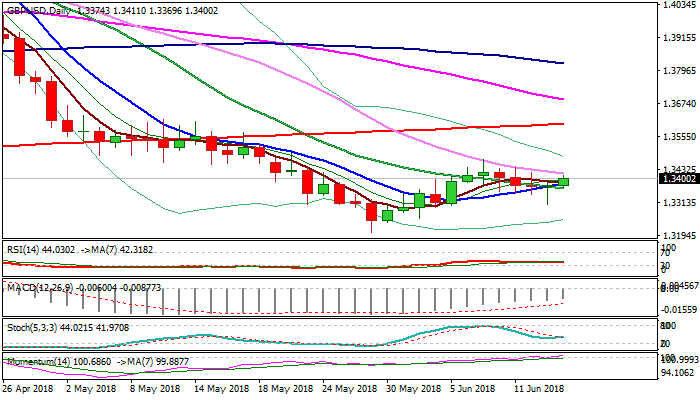
GBPUSD Outlook: Regains Traction After Strong Downside Rejection, Upbeat Retail Sales To Spark Further Recovery
Cable regained traction and rose above 1.34 handle on Thursday, signaling further recovery after pullback from 1.3472 faced strong rejection at 1.3307 on Wednesday as near-term bears off 1.3472 showed strong indecision on double-long-legged Dojis on Tue/Wed. Momentum remains strong and underpins recovery which moved above 20SMA (currently at 1.3365) after downside attempts repeatedly failed to close below it. Overall setup on daily chart is bullish and supportive for further recovery. UK retail sales could be a trigger if May's figure beats forecast at 0.5%. Extension through 30SMA (1.3420) would expose Monday's high (1.3441) and could challenge key barrier at 1.3472 (07 June high) in bullish scenario. Conversely, return below 20SMA would be initial negative signal which requires daily close below to risk further weakness.
Res: 1.3420, 1.3441, 1.3472, 1.3500
Sup: 1.3366, 1.3342, 1.3307, 1.3267