Sample Category Title
Markets Take A Breath Ahead Of The FOMC Rate Decision This Evening
The global markets are holding steady as traders position for the FOMC today and the ECB tomorrow. In an interview with FOX News US President Trump suggested that there will be additional tariffs imposed on China on Friday focussed on Chinese agricultural products. Chinese stock markets are down as a result but most other markets are steady today ahead of the FOMC Rate Decision to be announced later. During the same interview the President said that “War Games” would be suspended whilst negotiations are ongoing with North Korea in a show of good faith. He also made the comment that the Iran deal was worse than NAFTA, highlighting the dire situation for the trade agreement in North America.
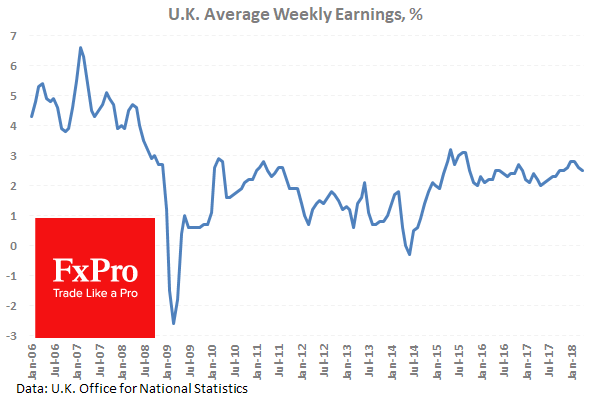
UK Average Earnings excluding Bonus (3Mo/Yr) (Apr) were 2.8% against an expected 2.9% from 2.9% previously. Average Earnings including Bonus (3Mo/Yr) (Apr) were 2.5% against an expected 2.6% from 2.6% previously. Wage growth is holding steady in the same range for three years, with this month’s number weaker than the expected readings. ILO Unemployment Rate (3M) (Apr) came in as expected at 4.2% compared with 4.2% previously. Claimant Count Change (May) was -7.7K against an expected 11.3K from a previous reading of 31.2K which was revised down to 28.2K. Claimant Count Rate (Jun) came in the same as the previous number at 2.5%. The unemployment rate is at multi decade low around 4.2%. The Claimant count had its drop confirmed after exceeding expectations and surprising to the upside last month. GBPUSD hit a high of 1.34183 when the data came out but ended up selling off to 1.33502 before the US session began.
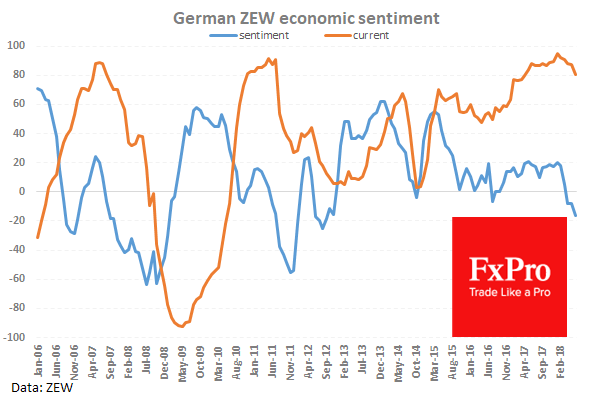
German ZEW Survey – Current Situation (Jun) fell to 80.6 against an expected 85.0 from a prior 87.4. ZEW Survey – Economic Sentiment (Jun) came in at -16.1 below the expected -14.0 from -8.2 previously. These data softened as the economic data in Germany and the wider Eurozone disappoints. The deteriorating trade environment is also a head wind for business outlook. In April the sentiment dropped below zero and continues to decline.
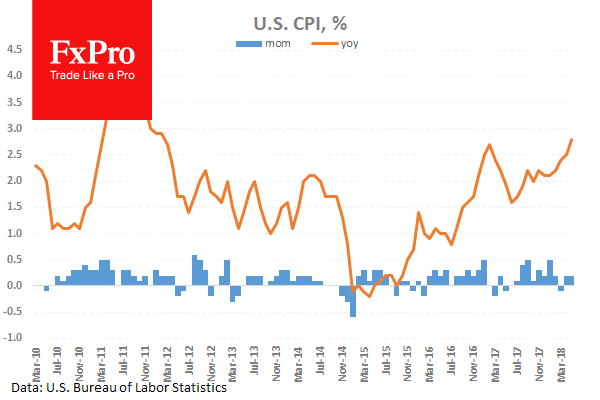
At 12:30 GMT, US Consumer Price Index (YoY) (May) data was released coming in at 2.8% against an expected reading of 2.7% against 2.5% previously. Consumer Price Index Ex Food & Energy (YoY) (May) data came in at 2.2% against an expected reading of 2.2% from 2.1% previously. Consumer Price Index Ex Food & Energy (MoM) (May) data was released at 0.2% with an expected reading of 0.2% against 0.1% previously. Consumer Price Index (MoM) (May) data came in at 0.2% with an expected reading of 0.2% against 0.2% previously. These data points show that the data came in largely in line with expectations with slight increases from the previous readings.
EURUSD is up 0.04% overnight, trading around 1.17498.
USDJPY is up 0.18% in the early session, trading at around 110.563
GBPUSD is down -0.04% this morning trading around 1.33668
Gold is flat in early morning trading at around $1,295.70
WTI is down -0.11% this morning, trading around $65.99
US FOMC Expected To Raise Rates Again By 0.25% Today
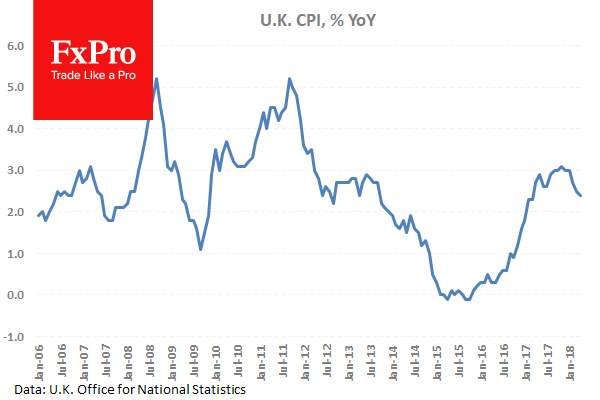
At 08:30 GMT, UK Consumer Price Index (YoY) (May) is expected out at 2.5% against 2.4% previously. Producer Price Index – Input (YoY) (May) is expected at 7.6% from 5.3% previously. These data points are expected to show CPI holding steady, with a slight increase in the yearly number which is above the Bank of England’s 2% target since March of 2017 due to the change in the value of the pound after Brexit. The BOE will be watching this data closely ahead of their meeting next week and it is their belief that inflation is likely to move back to 2% in 2018. Producer Prices are expected to continue to increase from the low in February. GBP crosses can be moved by the data released at this time.
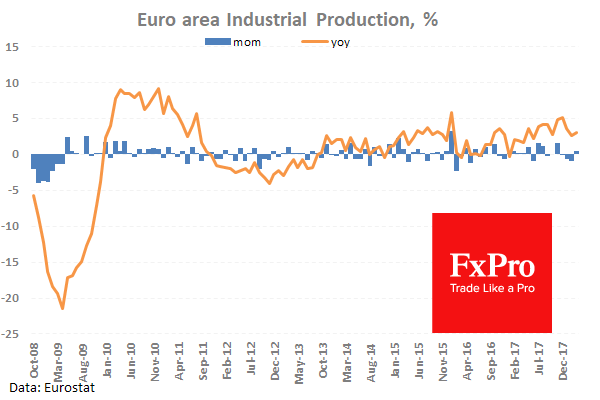
At 09:00 GMT, Eurozone Industrial Production (Apr) will be released with the consensus for -0.5% MoM and 2.8% YoY after 0.5% MoM and 3.0% YoY prior. This data is expected to decline today with the monthly figure slipping back under zero after rising last month. The fall in the data will feed into the sluggish economic data coming out of the Eurozone. The EUR can be moved by this data.
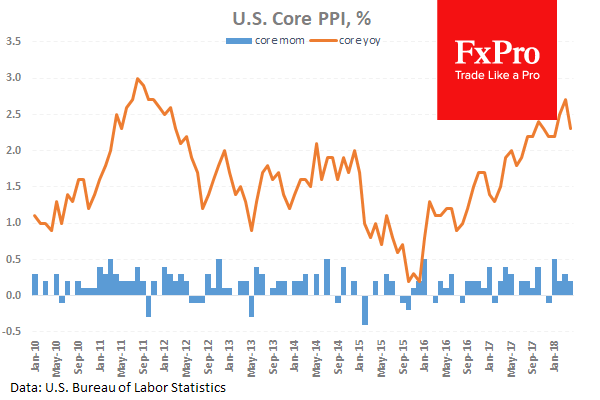
At 12:30 GMT, US Producer Price Index ex Food and Energy (YoY) (May) is expected to be 2.3% against a previous reading of 2.3%. The FED will be analysing this data for developing trends in consumer inflation. USD crosses can be affected by this data release.
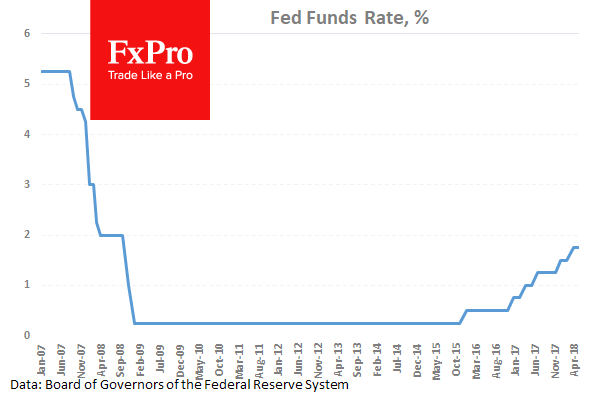
At 18:00 GMT US Fed’s Monetary Policy Statement and Interest Rate Decision which is expected to be raised to 2.00% from 1.75% after the rate was increased from 1.50% in March. This hike in rates has been more or less priced into markets and marks the second in a series of expected increases in 2018. The FOMC Economic Projections will be released at the same time. It can be argued that these projections will be of greater importance as traders look to quantify the pace of rate hikes ahead in the dot plot. The market is pricing in three hikes in 2018, with a slight bias for four that could strengthen the dollar position. At 18:30 GMT, the FOMC Press Conference will take place as Chairman Jerome Powell addresses the audience. USD crosses may experience volatility during this time with a tendency for a hawkish USD.
EUR/USD Analysis: Halted By Moving Averages
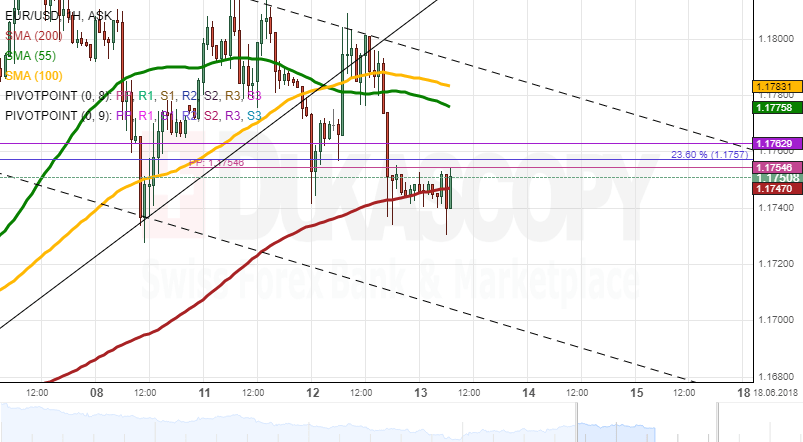
EUR/USD showed high volatility on Tuesday. It was dominated by bulls during the first part of the day, but nevertheless failed to overcome the psychological 1.18 mark. As a result, it retraced from the breached two-week channel up and allowed bears to dominate the remainder of the session until the 200-hour SMA was reached at 1.1740.
Technical indicators are tended south today; however, given that this 1.1740 area is likewise restricted by the 55-period (4H) SMA, the Euro might lack the necessary bearish momentum to dash through this support during the first part of the day. This could send the pair higher within the following hours.
By and large, the Fed policy statement at 1800GMT is likely to introduce volatility; thus, today's trading range should be wide, possibly 1.1700/1.1820.
GBP/USD Analysis: Returns To Tuesday’s Opening Level
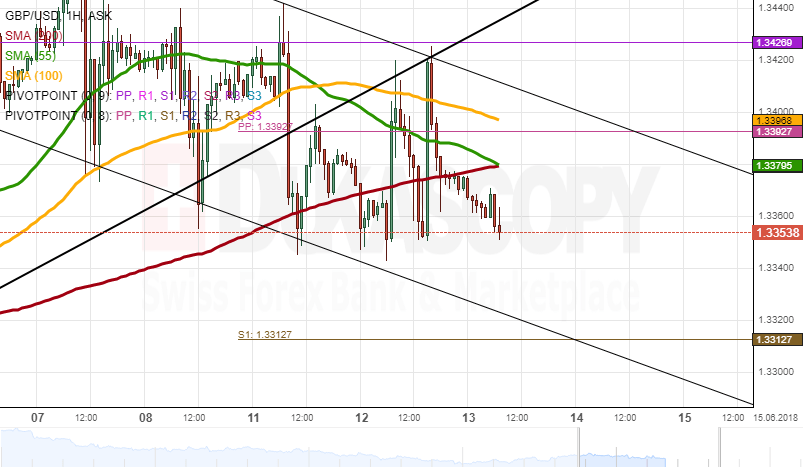
The Pound made two notable jumps against the US Dollar on Tuesday. Their effect, however, was not long, as a movement in the opposite direction followed immediately after. As a result, the Sterling had returned to its opening level by Tuesday evening.
Being located below all three SMAs points to further decline. This fall is likely to occur, especially if the 100-period (4H) SMA, tested at 1.3360 at the time of this analysis, surrenders. The most probable downside targets for today is the psychological 1.33 level or 1.3250.
Meanwhile, fundamentals today may activate bulls that could push the rate for the monthly PP. Given the strong resistance area circa 1.34, the Sterling could lack strength to edge higher past the monthly PP.
USD/JPY Analysis: Bullish Momentum Eases
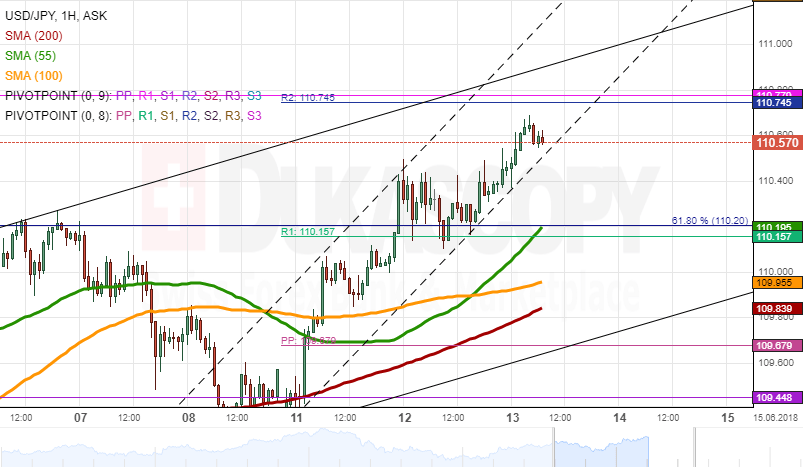
The US Dollar continues to strengthen against its Japanese counterpart for the third consecutive session. The pair managed to bounce off the weekly R1 and the 61.80% Fibonacci retracement and trade close to the weekly R2 and the monthly R1 on Wednesday morning.
Technical indicators remain bullish, suggesting that the 110.75 area should be breached in this session. The following levels of significance are either the upper channel line or the weekly R3 at 111.00 and 111.22, respectively.
Meanwhile, the pair's trading range in the four-day ascending channel has diminished. This shows that the strong bullish sentiment which has prevailed since the beginning of this week is starting to ease. This might be an early indication of a reversal. The Greenback should find strong support near the 110.00 territory.
Gold Analysis: Leaves Range
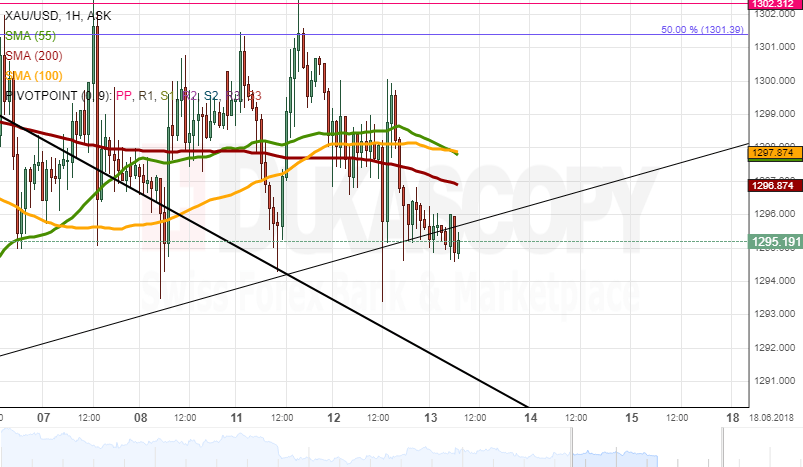
On Tuesday, the yellow metal finally managed to break out from its diminishing trading range between the monthly PP and the 55– and 100-period (4H) SMAs at 1.301.00 and 1.297.00, respectively. The pair breached the latter mid-session, thus returning to the bottom boundary of a one-month channel at 1,295.00.
The pair breaching several important support levels suggests that bears could continue dominating the pair in this session, as well. This is likewise shown by the positioning of technical indicators.
Today's low is likely to be the senior channel at 1.290.00. The 61.80% Fibonacci line is likewise located nearby. Conversely, the 55– and 100-hour SMAs should restrict a move above 1,300.00.
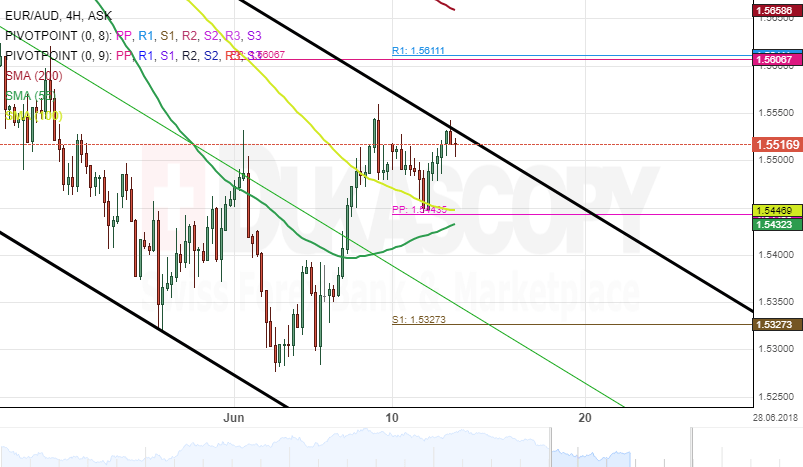
EUR/AUD 4H Chart: Sets For A Breakout
The common European currency has been confined by two months descending channel against the Australian Dollar. This pattern was formed on April 24 and has since guided the pair lower to a six-month low level.
The exchange rate has moved closer to the upper boundary of the descending channel and could be set for a breakout. Meanwhile, a support cluster formed by the weekly and the 100– hour simple moving average is providing support for the pair at 1.5447.
If and when the aforementioned breakout occurs, the EUR/AUD currency exchange rate could target the 200-hour SMA at 1.5661 during the following trading sessions.
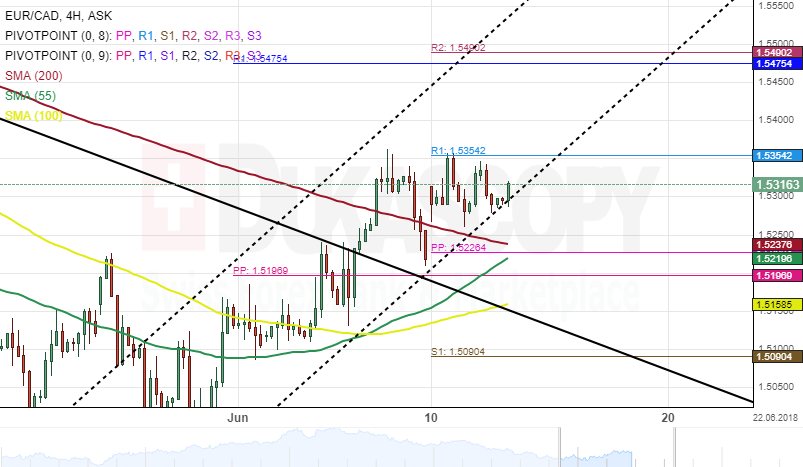
EUR/CAD 4H Chart: Bullish Sentiment Prevails
Following up on last week analysis for the EUR/CAD currency pair. Bulls took control of the market as expected and as a result, the exchange rate broke out through the upper boundary of a descending pattern.
Given that the price movement has been maintaining the junior ascending channel, and the pair already breached the 55-, 100-, 200– hour SMAs and the weekly and monthly PPs, the pair could target a two-month high at 1.5618 during the following trading sessions.
Technical indicators are in favour of bulls to grow stronger within the next trading days. However, the pair might make a corrective move south today.
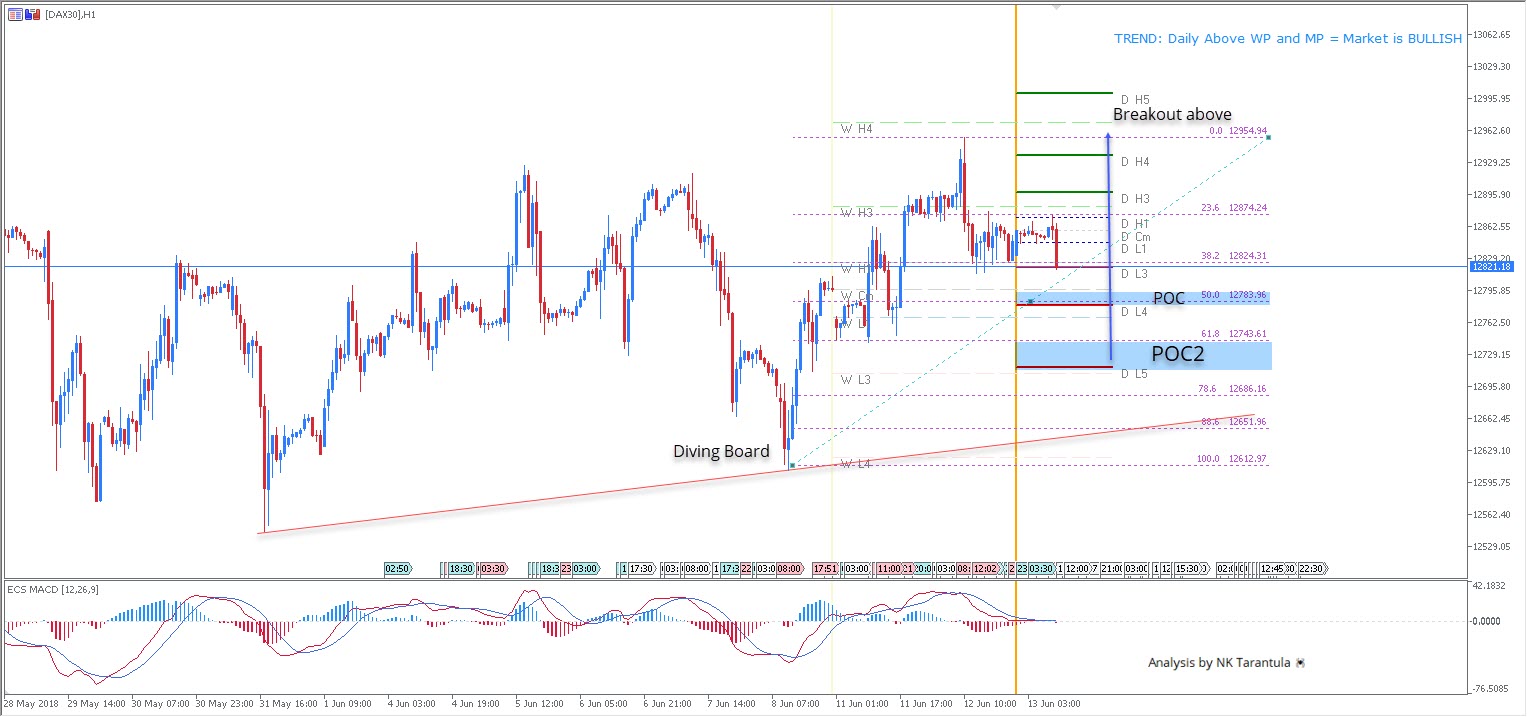
DAX30 Is Bullish After The Diving Board Pattern
The Flat base and plunge downward are the main characteristics of the diving board pattern. The DAX30 dropped then spiked heavily reaching 12954. At this point, the retracement is underway. There are two POC zones. 12770-83 is the first POC, while 12716-42 is the POC2. We might see the bounce if the price touches the zone. For bulls, ideally, the price should stay above the Diving Board pattern trendline 12651. Targets are 12900, 12954 and 13000 at the break of W H4- 12968.
W L3 - Weekly Camarilla Pivot (Weekly Interim Support)
W H3 - Weekly Camarilla Pivot (Weekly Interim Resistance)
W H4 - Weekly Camarilla Pivot (Strong Weekly Resistance)
D H4 - Daily Camarilla Pivot (Very Strong Daily Resistance)
D L3 – Daily Camarilla Pivot (Daily Support)
D L4 – Daily H4 Camarilla (Very Strong Daily Support)
POC - Point Of Confluence (The zone where we expect price to react aka entry zone)
XAUUSD Intraday Analysis
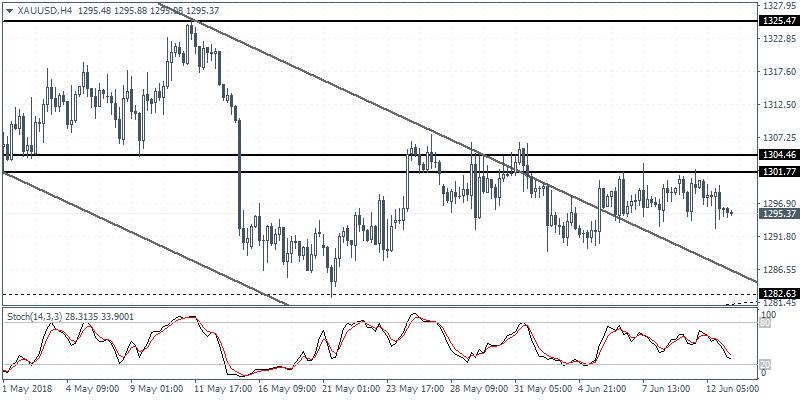
XAUUSD (1295.37): The consolidation in gold prices continues with price action failing to clear the resistance level of 1304 - 1301 region. This sideways range is expected to be breached heading into today's FOMC meeting. The downside support at 1282 remains a key level of interest while the resistance level at 1325 could be reached on a close above the resistance level.