

Sample Category Title
Eco Data 6/13/18
[php_everywhere instance="1"]
US: Consumer Price Inflation Strengthens in May
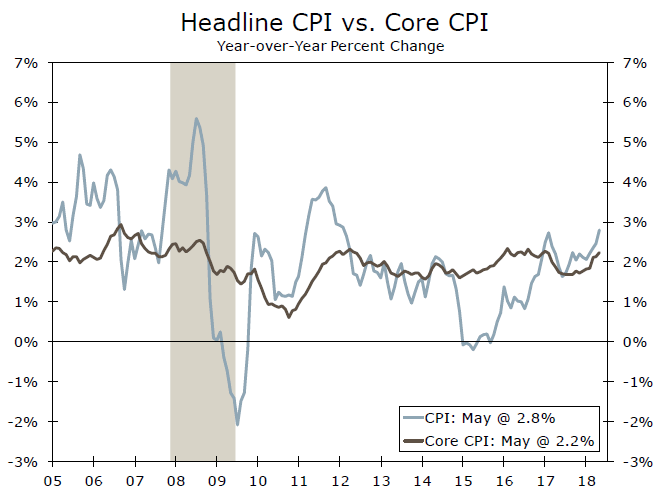
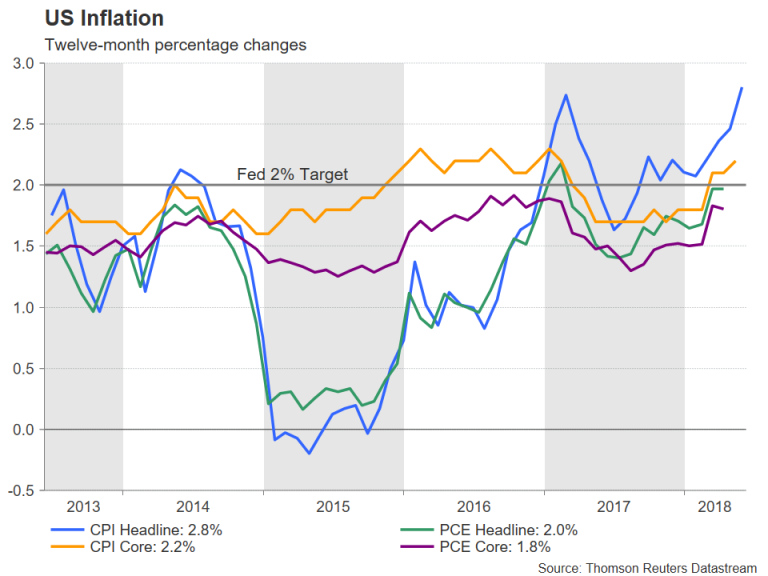
The CPI advanced 0.2 percent in May, helped by a rise in energy costs and core services. Over the past year, the CPI is up 2.8 percent and the core is running at 2.2 percent—roughly consistent with the Fed's target.
Energy and Core Services Drive Inflation Higher
Consumer price inflation continues to gradually pick up. Headline and core CPI rose a matching 0.2 percent in May and on a 12-month basis are both advancing at the fastest pace in at least a year.
As expected, a jump in gasoline prices lifted the index in May. Although prices at the pump typically rise this time of year, as the summer driving season kicks off, the recent run was particularly swift, leading to a 1.7 percent rise after seasonal adjustment. A pullback in energy services, however, kept the overall increase in energy costs more restrained at 0.9 percent. We expect the contribution from energy to be more muted in the coming months, as oil prices ease.
Food prices were unchanged in May, with a decline in the food at home category offset by a further advance in food away from home. Despite this month's softness, food should be more supportive of inflation later this year, as related commodity prices are modestly higher and labor costs are rising for restaurants and grocery stores.
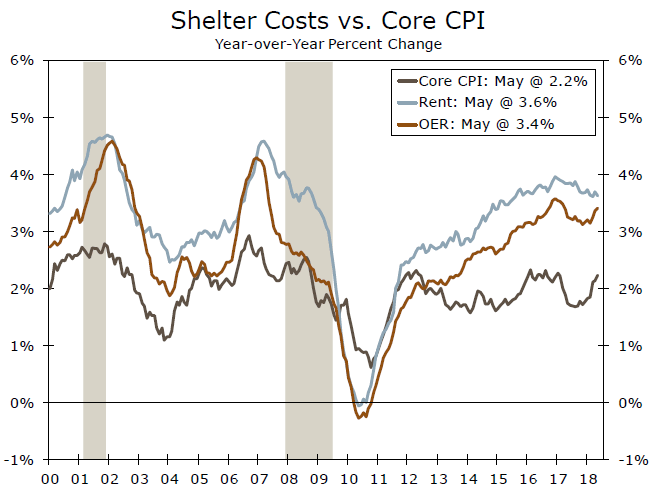
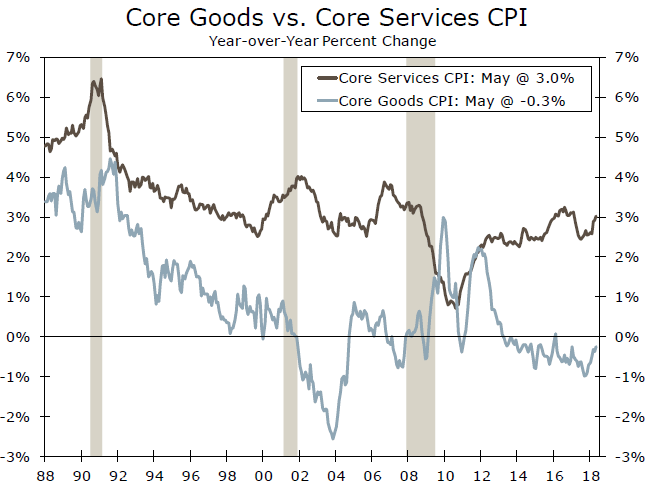
Higher core inflation continues to be driven by the service sector. Services ex-food and energy rose 0.3 percent in May amid another solid increase in shelter costs. While primary rent growth softened and is beginning to be weighed down by the onslaught of new apartment construction, lodging away from home bounced back (+2.9 percent) and owners' equivalent rent continues to advance amid tight for-sale inventories. In contrast, core goods prices edged down 0.1 percent for a third consecutive month; a drop in household furnishings and used autos more than offset a 1.4 percent jump in prescription drugs.
Upward Trend Sufficient for Further Fed Hikes
May's advance in CPI brings the year-ago rate up to 2.8 percent from 2.5 percent in April. While energy has been a significant driver of the pickup—contributing 0.9 percentage point to the 12-month change—the core index confirms the underlying trend in inflation is also moving higher. At 2.2 percent, core inflation is rising at the fastest pace since January 2017.
The latest ISM and NFIB surveys illustrate companies are increasingly contending with rising costs for materials and labor. While average hourly earnings growth has picked up only modestly, wage pressures are building in what has become an increasingly tight labor market. We do not believe we need to see earnings growth strengthen in order to see more inflation. Inflation tends to lead earnings, not the other way around, as businesses try to get ahead of rising input costs. Therefore, we expect to see core CPI continue to run a bit above 2 percent in the coming months. Core PCE, which is more closely watched by the Fed, should also move higher, reaching the FOMC's target of 2.0 percent as soon as the third quarter. That should pave the way for the Fed to raise rates not only at the end of tomorrow's meeting, but twice more in the second half of the year.
Dollar Firm as Rate Hike Imminent; But Will Fed also Raise Rate Path Forecast?
The US Federal Reserve is widely expected to deliver a 25 basis points increase to its benchmark interest rate on Wednesday. The announcement, due at 18:00 GMT on Wednesday, will come alongside the FOMC’s quarterly economic projections and will be followed with a press conference by Fed Chair Jerome Powell 30 minutes later. With a rate hike mostly priced in by the markets, the debate is whether the Fed will feel confident enough to signal two additional rate hikes this year, instead of the current forecast of one.
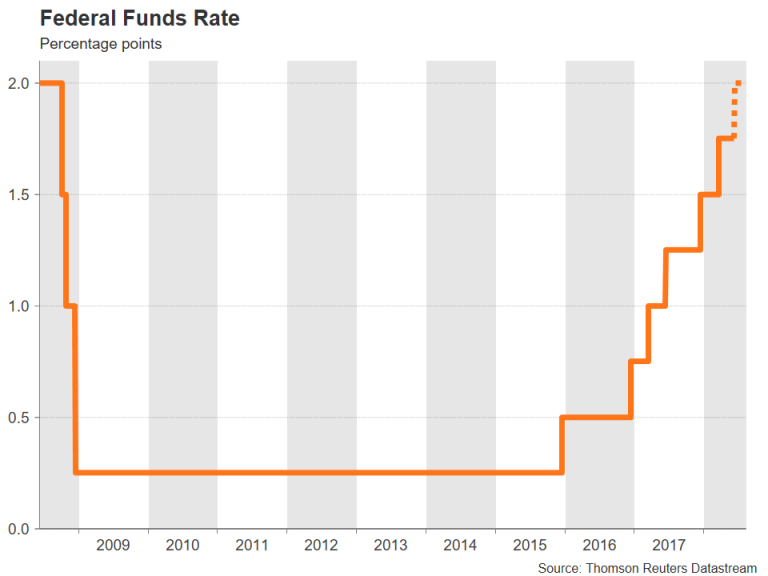
The Fed last raised rates in March, taking the federal funds rate to a target range of 1.50-1.75%. At the time, the Fed maintained its projection of a total of three rate increases in 2018. However, economic pointers for the United States since the March meeting have been going from strength to strength, suggesting a solid rebound in growth in the second quarter after a mild first quarter. And while wage pressures remain restrained, inflation has been creeping higher in recent months.
Inflation rose to a more than 6-year of 2.8% year-on-year in May, according to the consumer price index, some distance above the Fed’s objective of 2%. Even the Fed’s preferred indicator, the core personal consumption expenditures (PCE) price index has been moving closer to the central bank’s target, standing at 1.8% in April.
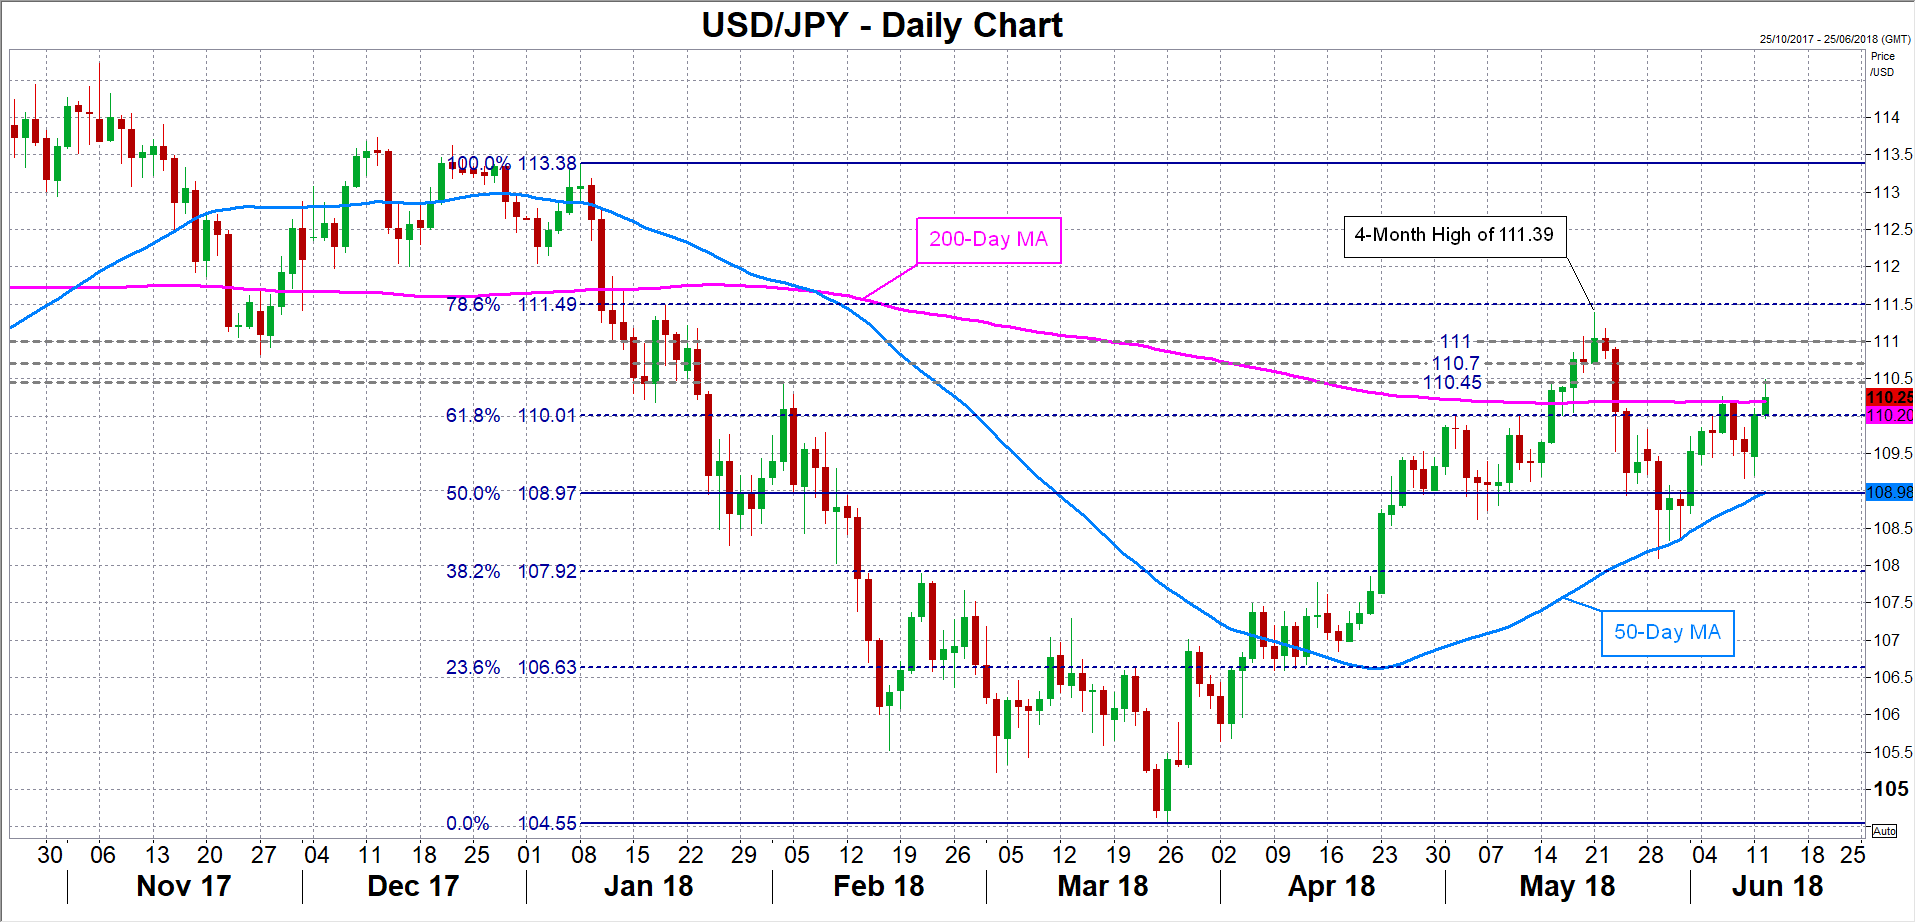
If the Fed’s latest dot plot chart is updated to a median projection of four rate rises in 2018 from three, traders could receive the catalyst needed to push the US dollar above the strong resistance area of 110 yen. A convincing break above 110 yen would open the way towards the May high of 111.39, though the pair would first need to overcome obstacles at 110.45, 110.70 and 111.00.
However, if the Fed maintains a cautious stance and once again resists plotting a steeper rate path before core PCE has reached 2%, the dollar will likely continue to consolidate within its recent range between 108.00-110.50, following the pullback from May’s 4-month peak of 111.39 yen. Disappointed traders could drag the dollar back towards the 109 handle where the 50-day moving average is converging. A breach of this support would bring the 108 level back into view, which is just above the 38.2% Fibonacci retracement of the January-March downleg.
With the markets split as to whether the majority members of the Federal Open Market Committee (FOMC) will upgrade their forecasts of the expected number of rate hikes this year from three to four, a decision either way is not anticipated to generate much surprise.
Perhaps a more important shift that should be watched on Wednesday is the statement language. Ever since the Fed started the process of gradually lifting rates in December 2015, policymakers have been keen to stress that “the federal funds rate is likely to remain, for some time, below levels that are expected to prevail in the longer run”. However, with the fed funds rate expected to move above 2% over the coming months and the US growth stretch extending further, that language may no longer be judged suitable. Any modification to the language could signify the biggest change to the Fed’s guidance since the current rate hike cycle began and signal an end to the era of accommodative policy in the world’s largest economy.
UK 100 Index Turns Neutral in Short Term after Bearish Correction
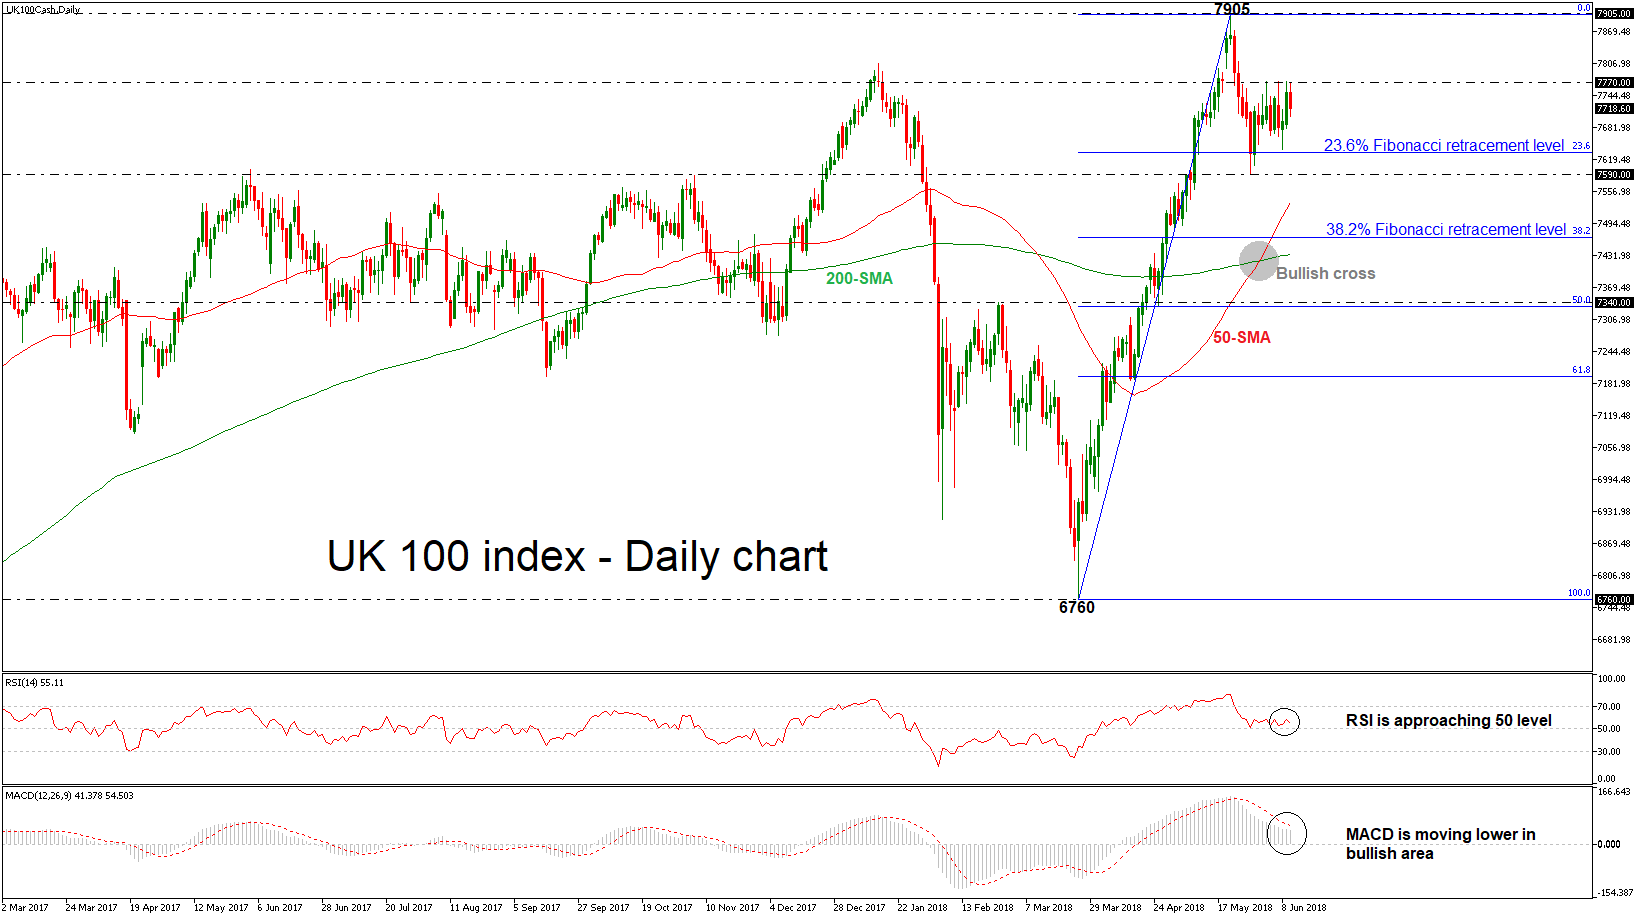
UK 100 index is looking more neutral as prices have struggled below the 7770 key resistance level and also touched a couple of times the 23.6% Fibonacci retracement level of 7633 of the upleg from 6760 to 7905, in the previous days. Hence, the upside momentum appears to be running out of steam as the short-term technical indicators are moving lower.
In the daily timeframe, the RSI indicator is pointing down near the threshold of 50, while the MACD oscillator is falling below its trigger line in the positive territory.
Should the pair manage to strengthen its positive momentum, the next resistance could come around the all-time high of 7905. Above this level, the next target could come in the 8000 psychological area, creating a new high.
However, if prices are unable to break the 7770 level in the next few sessions, the risk would shift back to the downside, with the 23.6% Fibonacci of 7633 once again coming into focus. A drop below this zone would signal a downtrend movement until the 7590 support. The next key support to watch lower down is the 38.2% Fibonacci of 7467.
Looking at the medium-term, the 50- and 200-simple moving averages posted a bullish crossover at the end of May, raising chances for further increases.
Sunset Market Commentary
Markets:
Core bond trading was rather uneventful today. Both the German Bund and the US Note future suffered minor losses during Asian trading hours as the US/North Korean Summit resulted in a commitment for a full denuclearization. There was no real follow-up action in European/US trading hours though. Investors ignored a disappointing German ZEW, with the forward looking expectations component at a 5-yr low. US Treasuries marginally started underperforming German Bunds following the May US CPI prints. The core and headline readings printed bang in line with forecasts, but accelerated further away from the Fed’s 2% inflation target adding to pressure for the Fed to step up its tightening cycle. NFIB small business sentiment increased earlier in the session to the highest level since 1983! The Atlanta Fed US Q2 GDP nowcast currently expected 4.6% Q/Qa GDP growth! Overall, market moves remained limited ahead of tomorrow’s Fed meeting and Thursday’s ECB meeting. US yields rise by 2.2 to 2.9 bps across the curve. The German yield curve bear flattens with yields 2.1 bps (2-yr) to 1.1 bp (30-yr) higher. 10-yr yield spread changes vs Germany narrow by 3 to 5 bps with Greece (flat) underperforming.
USD: EUR/USD extended an intraday comeback at the start of European trading after a brief dollar rebound early in Asia. There was extensive analysis on the potential consequences of the meeting between US President Trump and North Korean leader Kim Jong Un. Global markets kept a guarded positive bias, but there was no clear directional trend in the major FX cross rates. German ZEW investor confidence declined more than expected (due to Italy and uncertainty on trade). The impact on the euro was limited, but it helped to block any further intraday gains. EUR/USD settled in the high 1.17 area going into the US CPI report. US CPI inflation printed at 2.8% Y/Y for the headline measure and 2.2% for the core figure. The report confirms the trend of a gradual rise in US inflation, but the reaction was close to non-existent. EUR/USD is still going nowhere in a tight range close to 1.18. USD/JPY is holding north of 110, but also for this USD cross rate there is no strong enough trigger for further sustained gains. The countdown to the Fed continues.
GBP: There were plenty of headlines on UK economics and politics today, but they were also unable to provide a clear direction for trading. EUR/GBP continued hovering near the 0.88 pivot. The UK labour data were not too bad as job growth rose more than expected and jobless claims declined. However, wage growth remained modest (2.8% Y/Y ex bonuses vs 2.9% expected). The report was too close to expectations to inspire any directional reaction of sterling. The market focus afterwards turned to the Parliamentary vote on the amendments on the Brexit withdrawal bill. The debate starts at 4pm CET. Earlier today, pro-remain Minister Lee resigned as he intends to support the amendment to give more power to Parliament in the Brexit process (meaningful vote amendment). The impact on sterling remained limited with the outcome of the process highly uncertain. EUR/GBP trades currently marginally higher around 0.8820/25. Cable is little changed near 1.3370.
News Headlines:
Russia has abandoned the OPEC/non-OPEC supply cut deal from January 2017 by exceeding production limits in the first week of June. CEO of Russian energy firm Gazprom said it wants to keep the deal in place but quotas should be revised upwards. Expected is that Saudi Arabia will follow this behavior, pushing oil prices down. There is a desire to add some barrels to prevent prices from overheating and thereby satisfying the US.
The Czech central bank is to tighten mortgage rules to prevent banks running excessive risks in their property lending portfolios. Fuelled by a booming economy, record low unemployment and very low interest rates, real estate prices in the Czech Republic surged 16% last year (fastest-growing real estate market in the entire EU).
USD/JPY Mid-Day Outlook
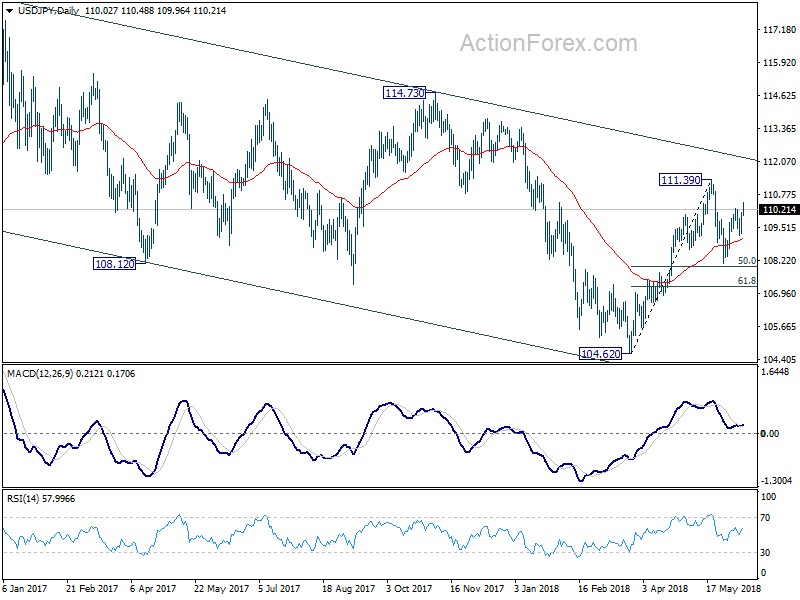
Daily Pivots: (S1) 109.52; (P) 109.82; (R1) 110.33; More...
Intraday bias in USD/JPY remains on the upside for the moment. Current rebound from 108.10 should target a test on 111.39 resistance first. Decisive break there will resume the whole rebound from 104.62. On the downside, break of 109.18 will extend the consolidation from 111.39 with another decline towards 108.10 support.
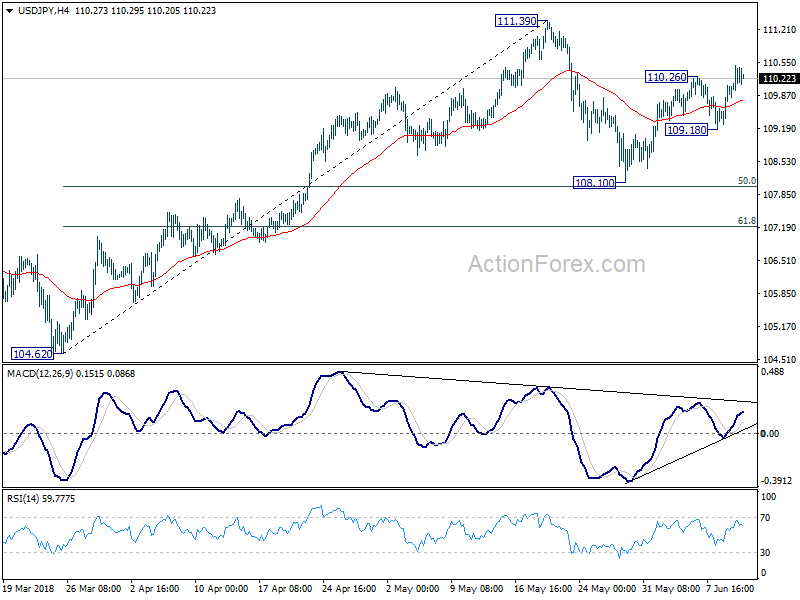
In the bigger picture, at this point, we're slightly favoring the case that corrective decline from 118.65 (2016 high) has completed with three waves down to 104.62. Above 111.39 will affirm this view and target 114.73 for confirmation. However, it should be noted that USD/JPY is bounded in medium term falling channel from 118.65 (2016 high). Sustained break of 61.8% retracement of 104.62 to 111.39 at 107.20 will likely resume the fall from 118.65 through 104.62 low.
USD/CHF Mid-Day Outlook
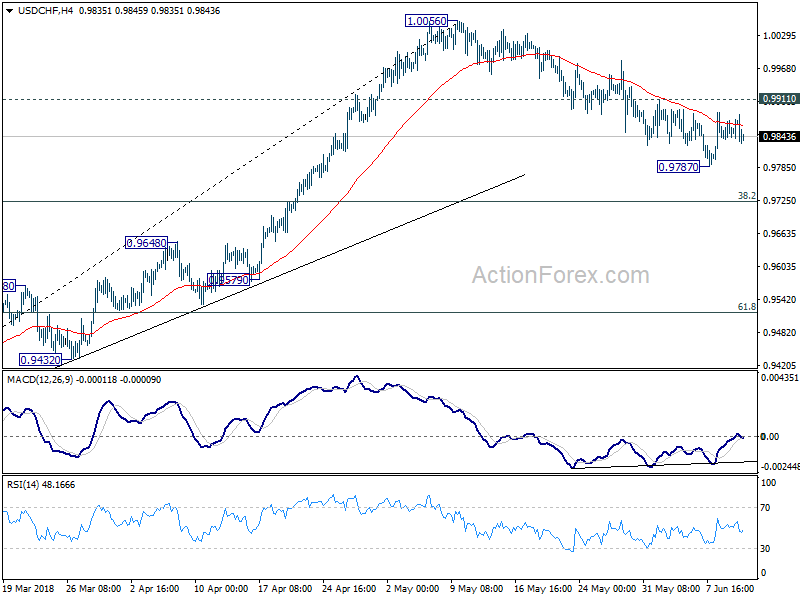
Daily Pivots: (S1) 0.9836; (P) 0.9855; (R1) 0.9872; More...
Intraday bias in USD/CHF remains neutral at this point. With 0.9911 minor resistance intact, correction from 1.0056 could extend lower. But in that case, we'd expect strong support from 0.9724 fibonacci level to contain downside and bring rebound. On the upside, break of 0.9911 will argue that the pull back from 1.0056 has completed. In such case, intraday bias will be turned back to the upside for retesting 1.0056.
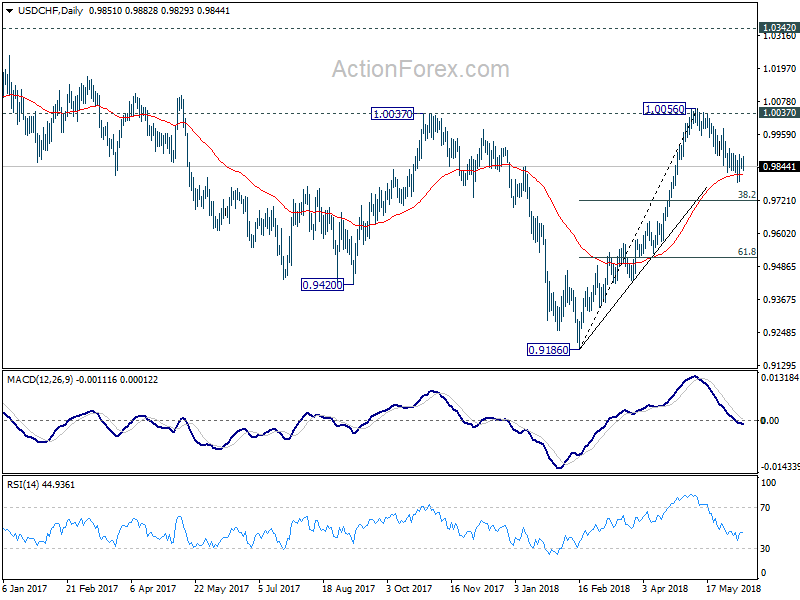
In the bigger picture, medium term decline from 1.0342 has completed with three waves down to 0.9186. Rise from there is currently viewed as a leg inside the long term range pattern. Hence, while further rally would be seen, we'd be cautious on strong resistance from 1.0342 to limit upside. For now, further rise is expected as long as 38.2% retracement of 0.9186 to 1.0056 at 0.9724 holds. However, sustained break of 0.9724 will dampen this bullish view and would at least bring deeper fall to 61.8% retracement at 0.9518.
GBP/USD Mid-Day Outlook
Daily Pivots: (S1) 1.3337; (P) 1.3389; (R1) 1.3435; More...
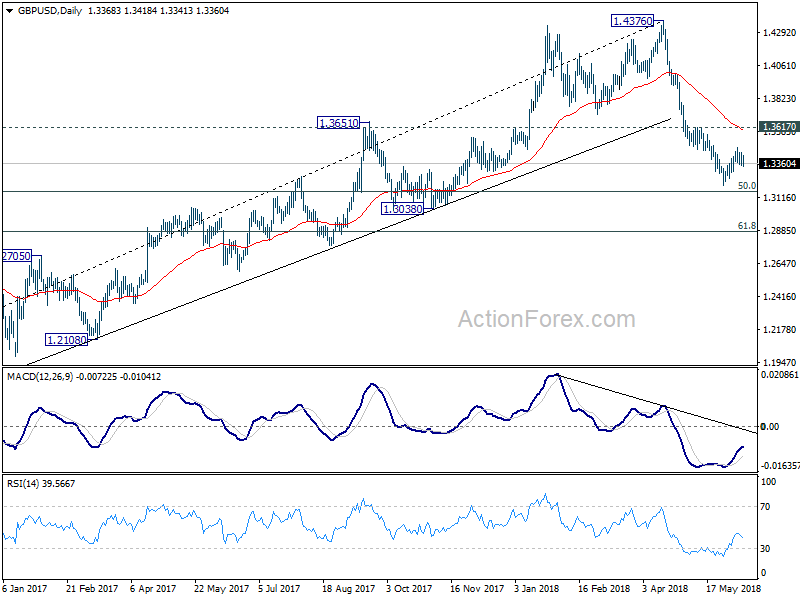
Intraday bias in GBP/USD remains neutral at this point. Break of 1.3341 minor support will confirm completion of the corrective rise from 1.3203. Intraday bias would be turn to the downside. And fall from 1.4376 should resume through 1.3203 to 50% retracement of 1.1946 to 1.4376 at 1.3161 first, and 61.8% retracement at 1.2875 next. In case of another rally, upside should be limited by 1.3617 resistance to bring reversal.
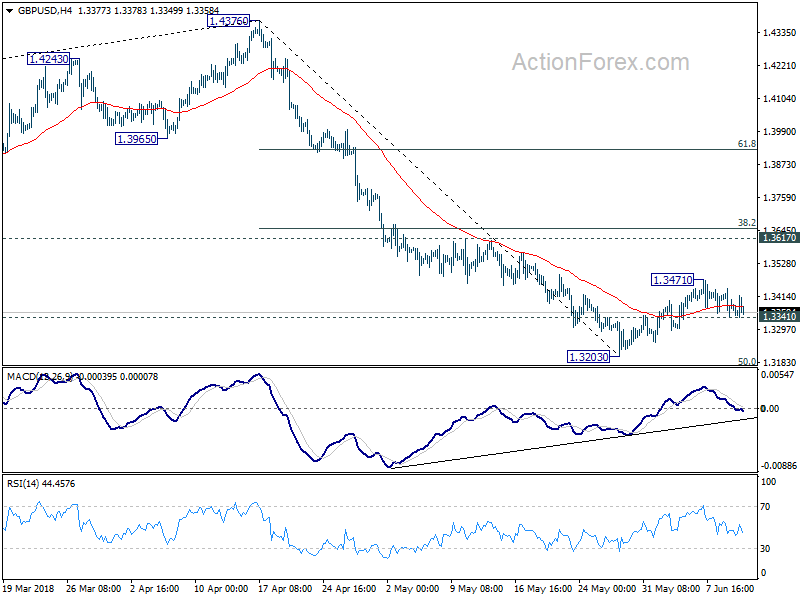
In the bigger picture, current development suggests that whole medium term rebound from 1.1936 (2016 low) has completed at 1.4376 already, with trend line broken firmly, on bearish divergence condition in daily MACD, after rejection from 55 month EMA (now at 1.4223). 61.8% retracement of 1.1936 (2016 low) to 1.4376 at 1.2874 is the next target. We'll pay attention to the reaction from there to asses the chance of long term down trend resumption. For now, outlook will stay bearish as long as 1.3617 resistance holds, even in case of strong rebound.
USDJPY: Remains On The Offensive
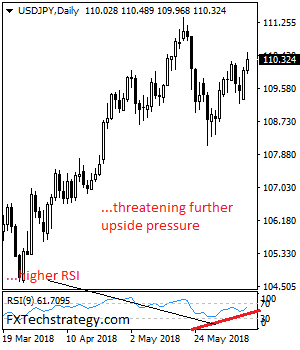
USDJPY: The pair looks to recover further higher as it continues to hold on to its upside pressure. On the downside, support lies at the 110.00 level where a break if seen will aim at the 109.50 level. A cut through here will turn focus to the 109.00 level and possibly lower towards the 108.50 level. On the upside, resistance resides at the 110.50 level. Further out, we envisage a possible move towards the 111.00 level. Further out, resistance resides at the 111.50 level with a turn above here aiming at the 112.00 level. On the whole, USDJPY faces further upside pressure short term.
No Surprises as US CPI Growth Picks up in May
Highlights:
- All items CPI rose 0.2% month-over-month in May with the year-over-year rate rising to 2.8%. Both were broadly in line with market expectations.
- Gasoline prices rose 1.7% on a month-over-month basis but were up a whopping 22% from a year ago.
- Core (ex-food & energy) prices rose 0.2% from April to push the year-over-year rate up to 2.2% in May from 2.1% the prior month.
Our Take:
As was widely expected, higher energy prices were the main factor pushing the headline year-over-year CPI growth rate up to 2.8% in May from 2.5% in April. The May reading nonetheless marks the fastest pace of annual headline price growth in more than 6 years. Underlying trends also firmed somewhat further. Excluding food & energy components, core price growth ticked up to 2.2% on a year-over-year basis from 2.1% in April. Recent monthly readings have been a little stronger than that. The 6-month rolling average of month-over-month core price changes is tracking closer to 2 1/2% at an annualized rate. Looking through energy volatility, there is still little reason for the Fed to get too worried at this point about inflation coming unhinged on the upside. At the same time, core price growth has continued to firm right around the Fed’s 2% inflation objective. The economic backdrop has clearly continued to improve from very strong levels, and interest rates are still historically low. In short, the data is fully consistent with the Fed continuing to hike rates at a gradual pace — with the next 25 basis point hike almost certainly to come at tomorrow’s FOMC policy announcement.