Sample Category Title
EUR/GBP Weekly Outlook
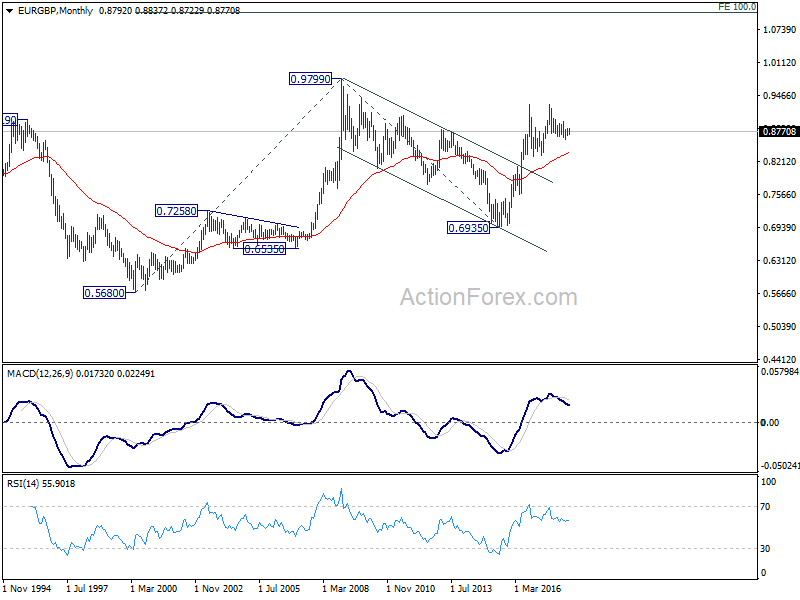
EUR/GBP attempted to break out from recent sideway trading last week, but failed below 0.8844 resistance. Initial bias remains neutral this week first. Nonetheless, another rise is expected as long as 0.8693 support holds. Break of 0.8844 will resume the rebound from 0.8620 for 0.8967 cluster resistance (50% retracement of 0.9305 to 0.8620 at 0.8963). However, break of 0.8693 will bring deeper fall back to retest 0.8620 low.
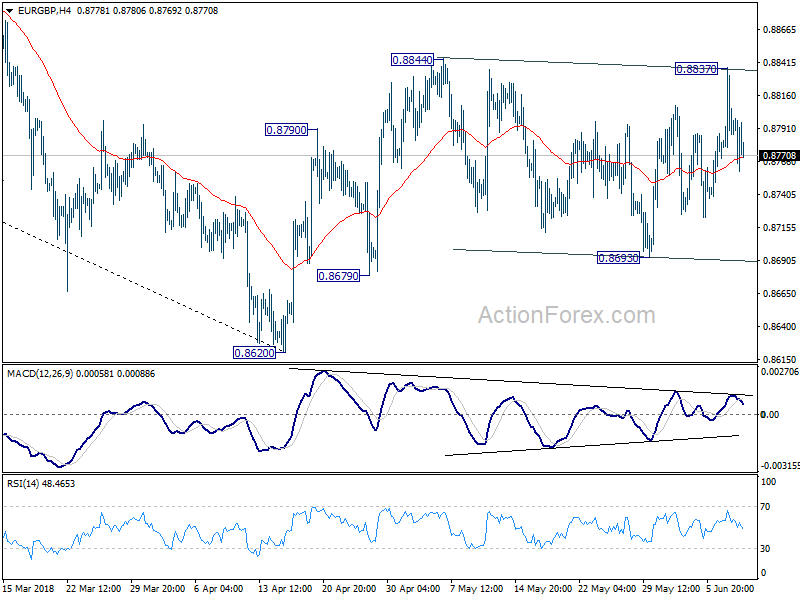
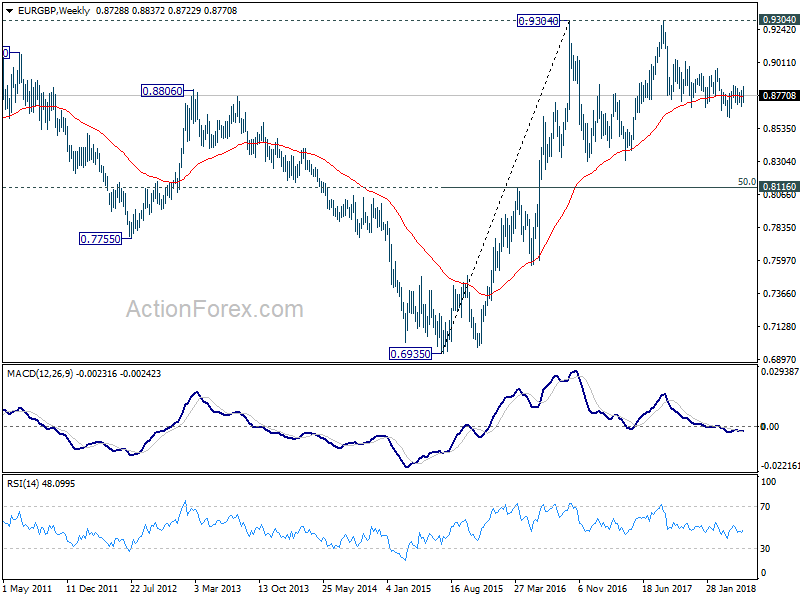
In the bigger picture, for now, the decline from 0.9305 is seen as a leg inside the long term consolidation pattern from 0.9304 (2016 high). Such consolidation pattern could extend further. Hence, in case of strong rally, we'd be cautious on strong resistance by 0.9304/5 to limit upside. Meanwhile, in another decline attempt, we'd expect strong support from 0.8116 cluster support (50% retracement of 0.6935 to 0.9304 at 0.8120) to contain downside.
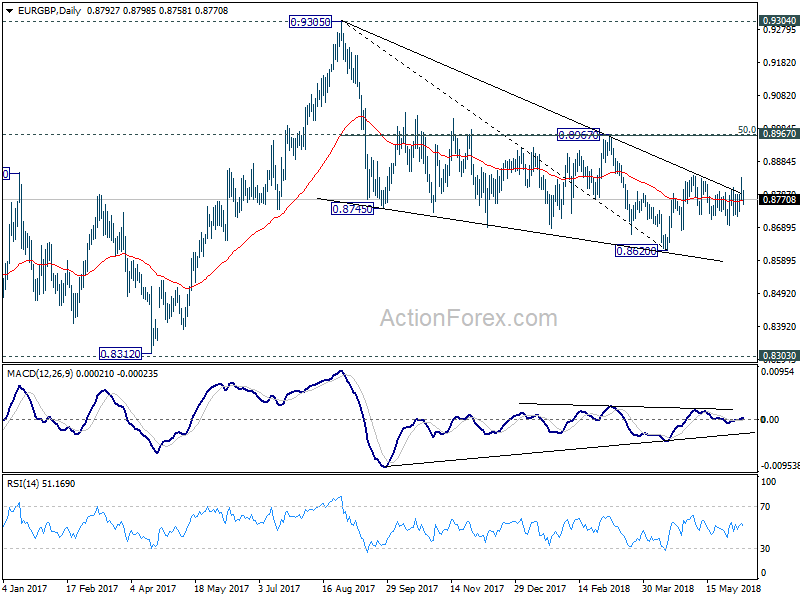
In the long term picture, we're holding on to the view that rise from 0.6935 (2015 low) is resuming the up trend from 0.5680 (2000 low). Hence, after the consolidation from 0.9304 completes, we'd expect another medium term up trend through 0.9799 to 100% projection of 0.5680 to 0.9799 from 0.6935 at 1.1054.
EUR/AUD Weekly Outlook
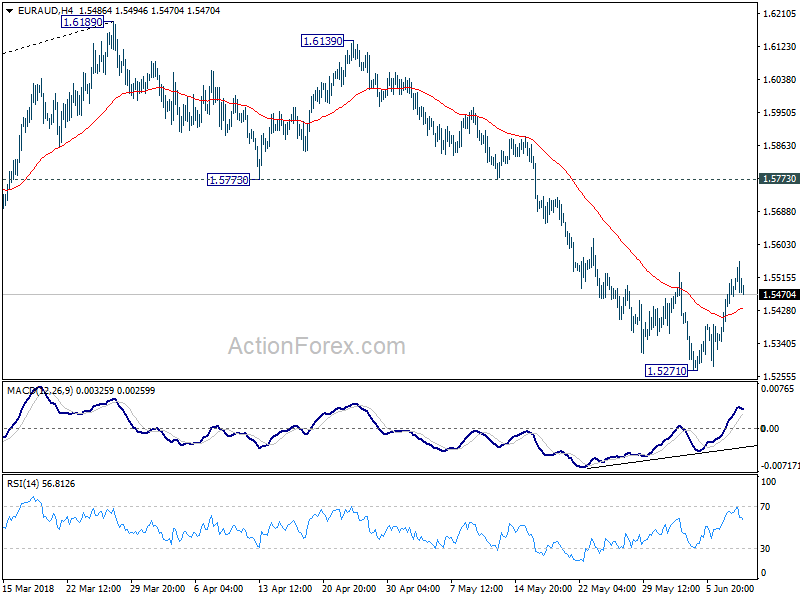
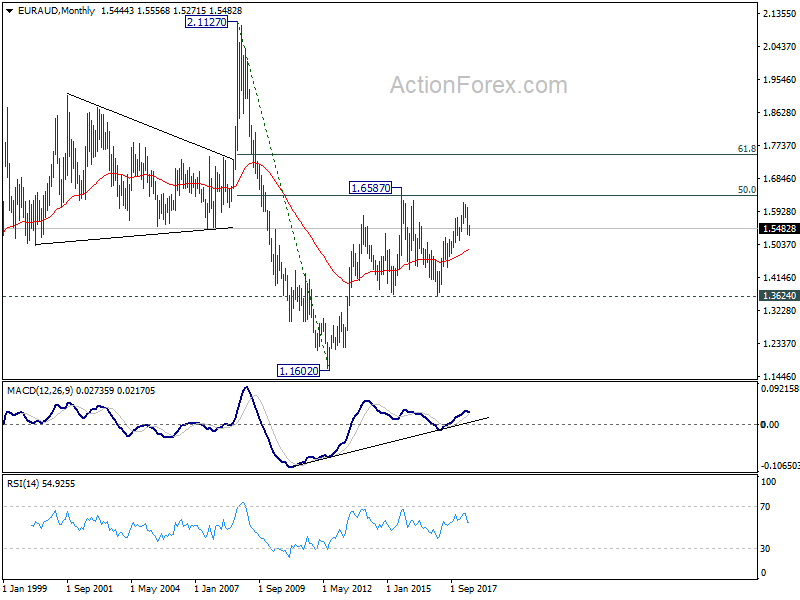
EUR/AUD edged lower to 1.5271 last week but formed a short term bottom there, ahead of 1.5153 key support and rebounded. Further rebound could be seen to 55 day EMA (now at 1.5677) this week. But upside should be limited below 1.5773 support turned resistance and bring fall resumption. On the downside, break of 1.5271 will extend the fall from 1.6189 to 1.5153 next.
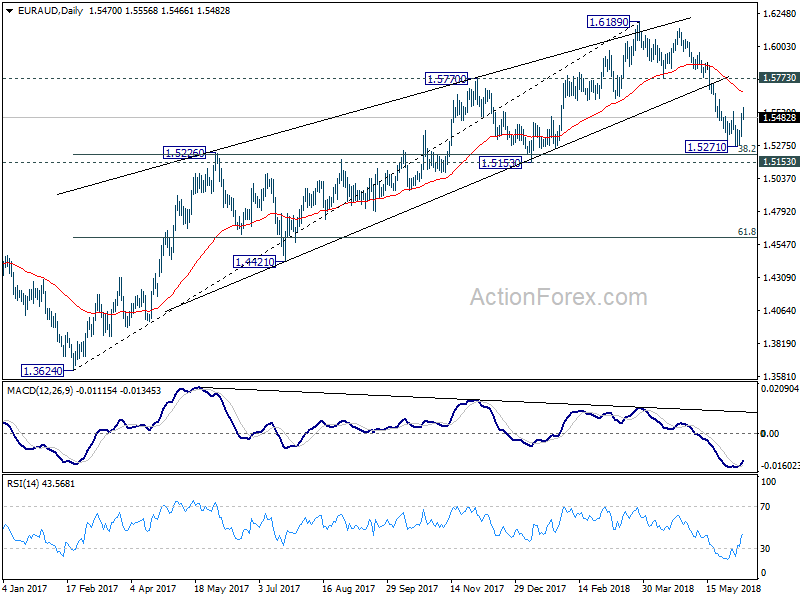
In the bigger picture, rally from 1.3624 (2017 low) should have completed at 1.6189 already, ahead of 1.6587 key resistance (2015 high). 1.6189 is seen as a medium term top. Deeper fall would be seen to 38.2% retracement of 1.3624 to 1.6189 at 1.5209 first. Decisive break there will pave the way to 61.8% retracement at 1.4604. In that case, we'll look for bottoming again below 1.4604. On the upside, firm break of 1.5773 support turned resistance is needed to indicate completion of the fall from 1.6189. Otherwise, further decline is expected in medium term, even in case of strong rebound.
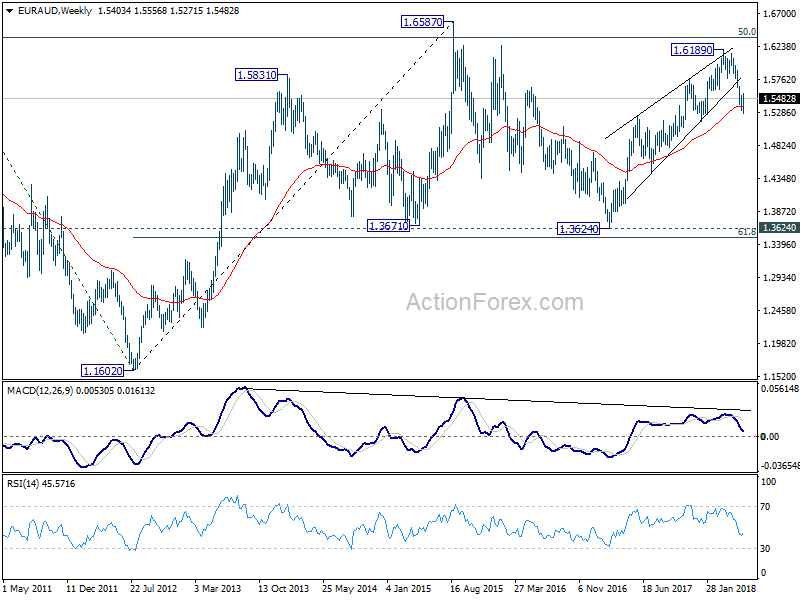
In the longer term picture, the rise from 1.1602 long term bottom (2012 low) isn't over yet. We'll keep monitoring the development but there is prospect of extending the rise to 61.8% retracement of 2.1127 to 1.1602 at 1.7488 and above. However, sustained trading below 1.3624 key support should indicate long term reversal and target 1.1602 long term bottom again.
EUR/CHF Weekly Outlook
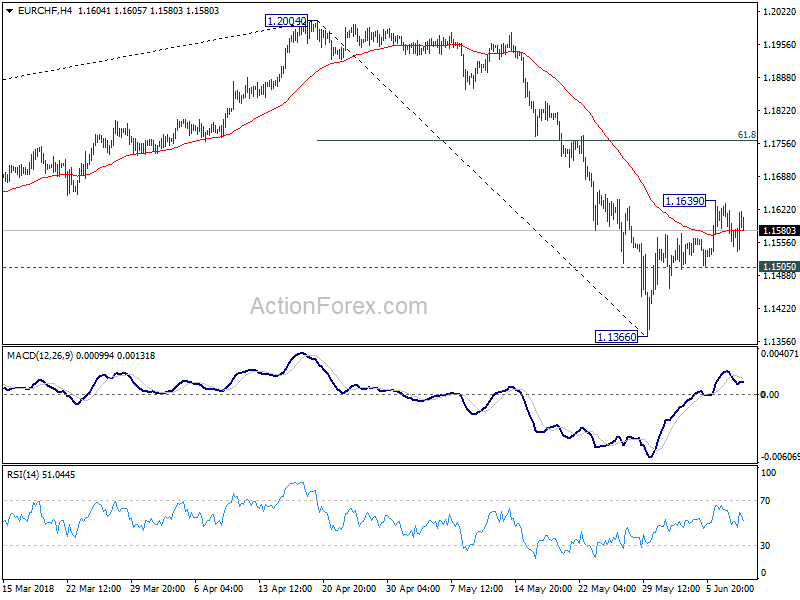
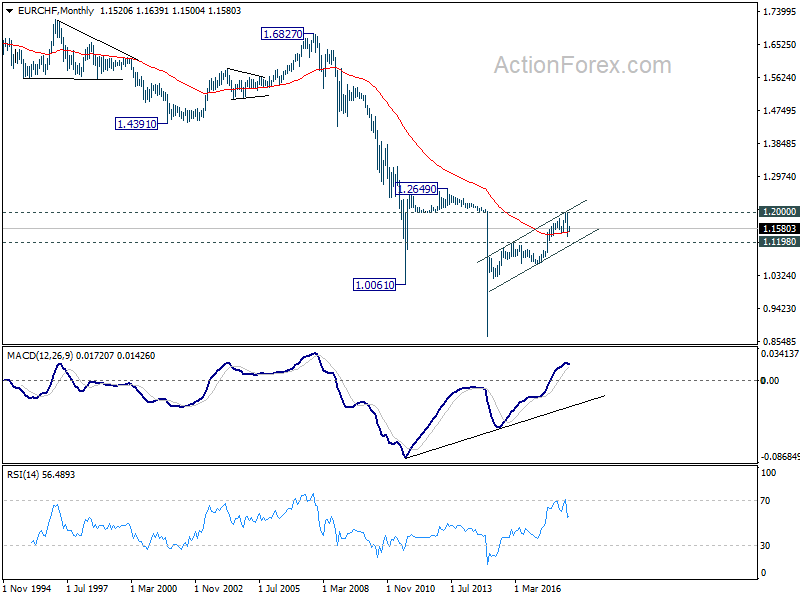
EUR/CHF's rebound from 1.1366 last week was stronger than originally expected, indicating short term bottoming. Thus, while initial bias is neutral this week first, further rise is mildly in favor as long as 1.1505 minor support holds. Above 1.1639 will extend the rebound from 1.1366 to 61.8% retracement of 1.2004 to 1.1366 at 1.1760. But after all, the corrective pattern from 1.2004 is extend to extend with at least one more falling leg. Hence, we'll look for reversal signal again above 1.1760. On the downside, break of 1.1505 will suggest that the rebound is completed. And intraday bias will be turned back to the downside for retesting 1.1366.
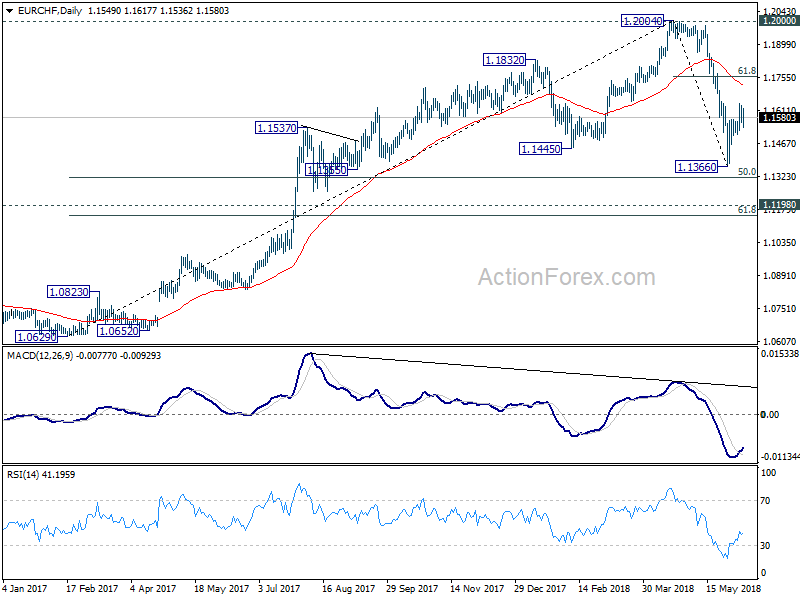
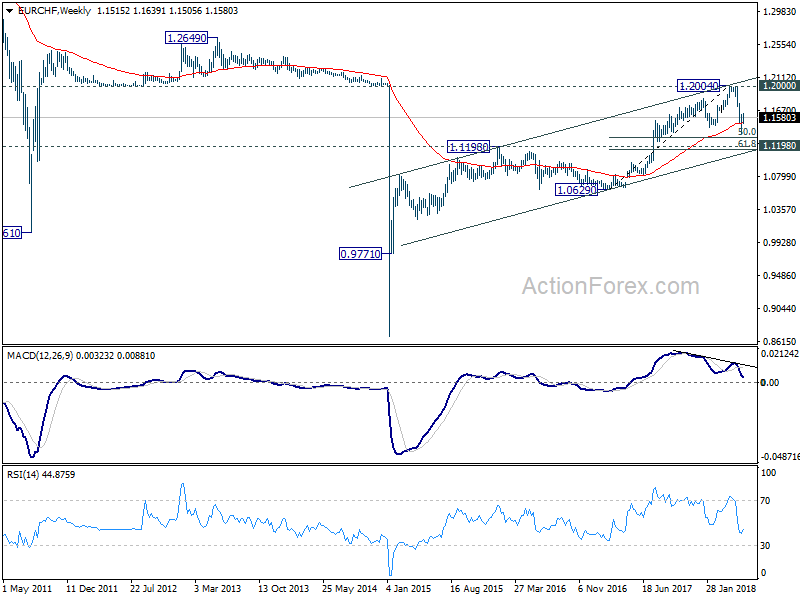
In the bigger picture, current development suggests solid rejection by prior SNB imposed floor at 1.2000. Considering bearish divergence condition in daily and weekly MACD, 1.2004 should be a medium term top. And price action from 1.2004 is correcting the up trend from 1.0629. Such correction is expected to extend for a while and therefore, we're not anticipating a break of 1.2004 in near term. Another decline cannot be ruled out yet. But in that case, strong support should be seen at 1.1198 (2016 high), 61.8% retracement of 1.0629 to 1.2004 at 1.1154 to contain downside.
Markets to Look Through G7 to Fed Hike and ECB Judgement Day
While trade tension between the US and its allies dominated the headlines last week, Euro emerged as the strongest major currency. Receding Eurozone internal political risks was a key factor. German 10 year bund yield hit as high as 0.52, comparing to 0.186 low just two weeks ago, before closing at 0.45. Expectation of a decision by ECB on it asset purchase program is another key factor pushing up the common currency. On the other hand, Japanese Yen ended as the weakest one as major US and European yields recovered. Dollar followed as the second weakest.
The G7 meeting in Canada should progress little progress. But based on the information so far, tensions between the US and G6 didn't intensify. Markets will likely look through G7 to the week with FOMC rate hike, ECB meeting and BoJ. In addition to that, there will be loads on important data including US CPI, UK CPI and jobs German ZEW and Australia employment, etc. And, don't forget the historical meeting between North Korean Leader Kim Jong-un and US President Donald Trump too. That's a marvellous achievement by South Korean President Moon Jae-in to orchestrate it.
Meeting is better tweeting, some though insufficient progress at G7 meeting
There were lots of heated exchanges between US President Donald Trump, French President Emmanuel Macron and Canadian Prime Minister Justin Trudeau ahead of the G7 leaders summit in Canada. But the atmosphere turned out to be much better than the leaders actually met in person. It's reported that G7 leaders confronted Trump with trade statistics to persuade him from stopping tariffs on the allies. But Trump stood firm with his stance victimizing the US in international trade, countering with his own set of numbers. Though, the principle of dialogue is believed to be agreed among them, including Trump.
Macron said after his bilateral meeting with Trump that the were "very direct and open" conversations". While "sometimes we disagree, but we share I'd say common concerns and common values and we share the willingness to deliver results together." Macron added "on trade, there is ... a way to progress all together" and "I saw the willingness on all the sides to find agreements and have a win-win approach for our people, our workers, and our middle classes." Trump also sounded in softer tone as he said "we have little tests every once in a while when it comes to trade" But, "something's going to happen. I think it will be very positive."
German Chancellor floated an idea to set up a share assessment and dialogue mechanism to result to disputes. And according to a Reuters' source, the proposal were agreed by other leaders. European Commission President Jean-Claude Juncker also offered to visit Washington for an assessment of EU-US trade to help resolve the dispute.
But still, the differences between US and the other G6 remain huge. And it unlikely for the group to issue a joint communique for the first time ever.
Euro higher on ECB expectation but beware of dovish tweak
Euro ended last week as the strongest one after comments from the highly respected ECB chief economist Peter Praet. The biggest take away was of course the indication that "next week, the Governing Council will have to assess whether progress so far has been sufficient to warrant a gradual unwinding of our net purchases." That is, ECB will make that "judgement call" this week, on what's next after the EUR 30B/month asset purchase program ends in September.
Praet actually offered more of his upbeat thoughts in the speech "Monetary policy in a low interest rate environment". There he noted "there is growing evidence that labour market tightness is translating into a stronger pick-up in wage growth". And, signals showing the convergence of inflation towards our aim have been improving, and both the underlying strength in the euro area economy and the fact that such strength is increasingly affecting wage formation supports our confidence that inflation will reach a level of below, but close to, 2% over the medium term."
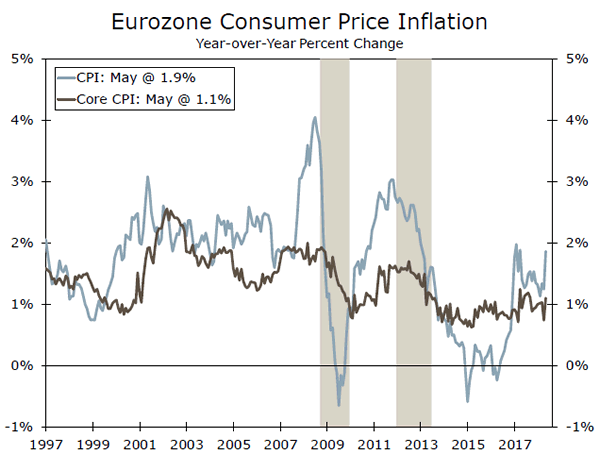
With Eurozone inflation picked up again in May, ECB should be much more comfortable to end the asset purchase program this year. However, this is still far from being certain. The tricky point is, if they don't end the program after September, it doesn't make much sense to taper it for another three months till December. If ECB extends the tapered program for six months, it will push away the timing of the first rate hike, which will be Euro negative. Stopping the program right after September is certain Euro positive. But are they confident enough to do so? It's doubtful. Hence, there could be some dovish tweaks out of the meeting.
Dollar consolidation continued ahead of FOMC rate hike and CPI
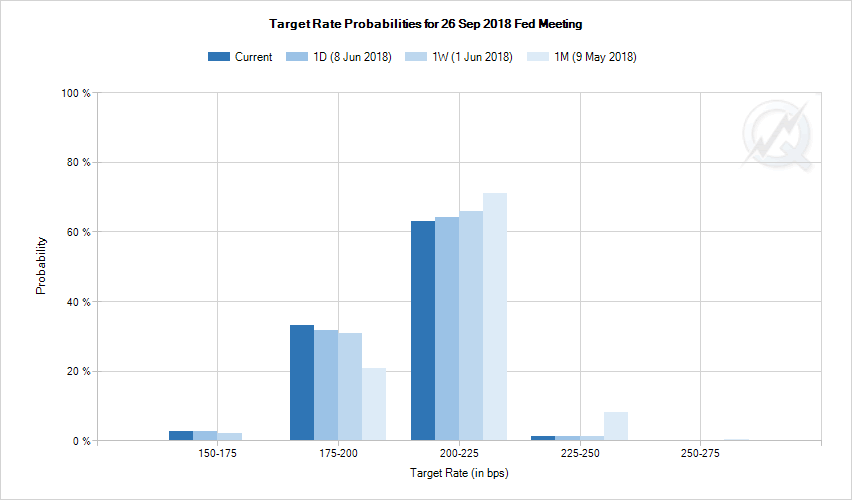
Dollar ended last week as the second weakest major currency after Yen as near term correction continued. FOMC is widely expected to raise federal funds rate by 25bps to 1.75-2.00% this week. Fed funds future are pricing in over 90% chance for that, and there shouldn't be any surprise. The focus will be on voting and the new projections for hints on more rate hike down the road. As of today, fed fund futures are pricing on around 64% chance of another hike in September. That's notably down from near 80% chance as priced in last month. But such pricing could change drastically on Fed's new projections (Wednesday) and May CPI data (Tuesday).
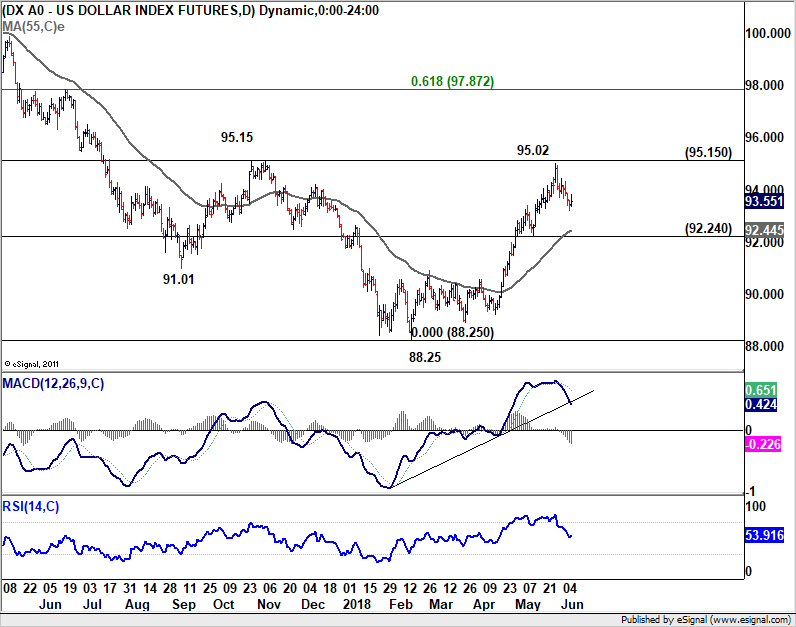
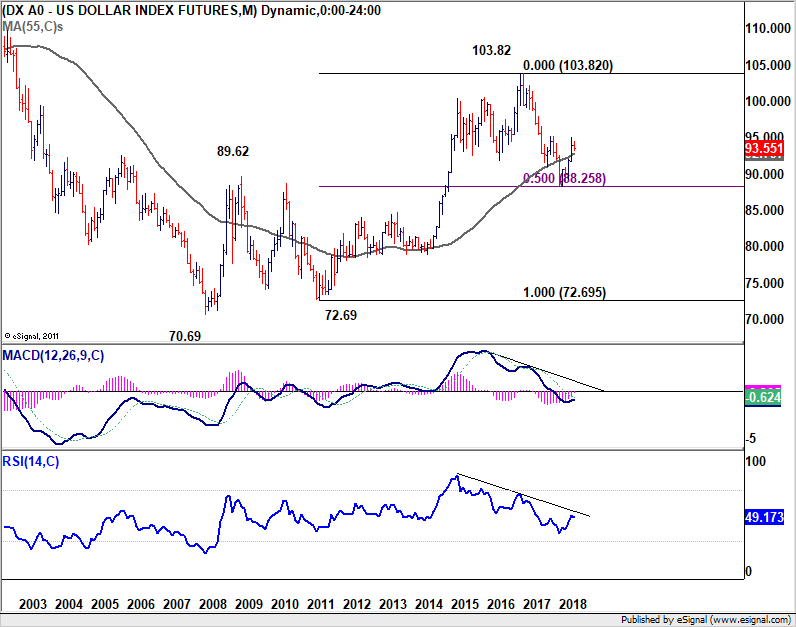
Dollar index's pull back from 95.02 extended lower last week as expected. Outlook is unchanged that a short term top was formed after failing 95.15 key medium term resistance. While some more decline could be seen, strong support should be seen at 92.24 support (which is close to 55 day EMA) to bring rally resumption. We'd expect rise from 88.25 to extend to 61.8% retracement of 103.82 (2017 high) to 88.25 at 97.87 at a later stage. But that could only come when markets are convinced that Fed will hike the fourth time this year in December. Or, 10 year yield can take out key resistance zone a around 3% decisive.
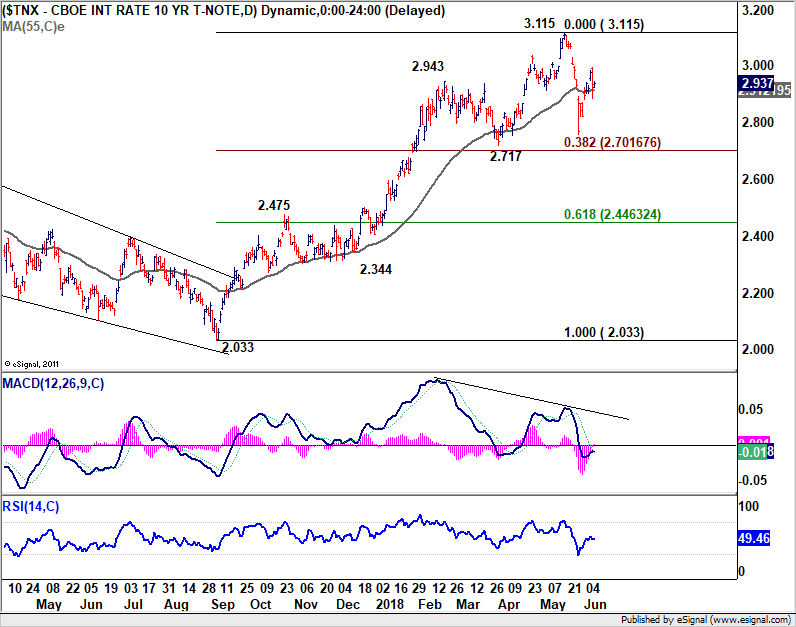
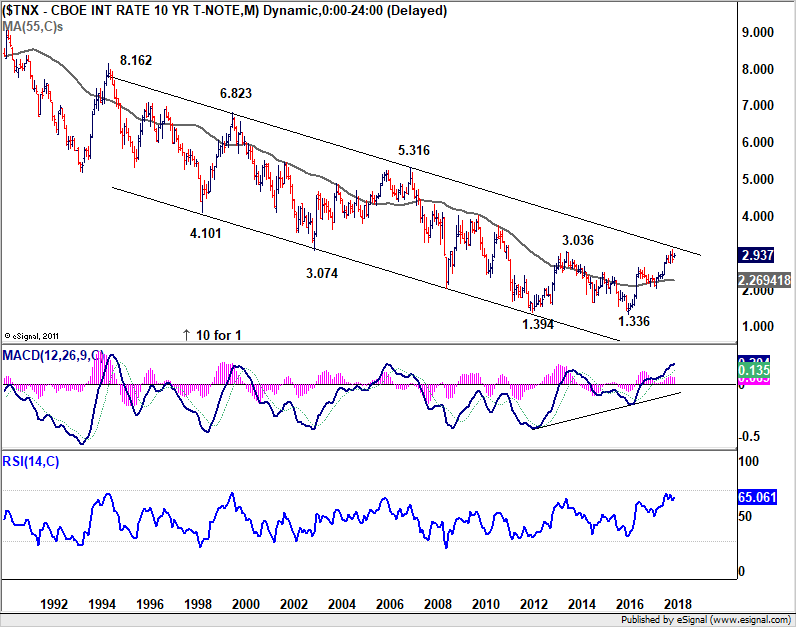
10 year yield had strong rebound last week to as high as 2.992. But TNX failed to take out 3% handle and retreated sharply. Overall outlook is unchanged that price actions from 3.115 are forming a consolidation pattern. Downside should be contained by 38.2% retracement of 2.033 to 3.115 at 2.701, which is close to 2.717 support. More time is needed, though, to complete the consolidation as TNX is facing multi-decade channel resistance.
EUR/USD Weekly Outlook
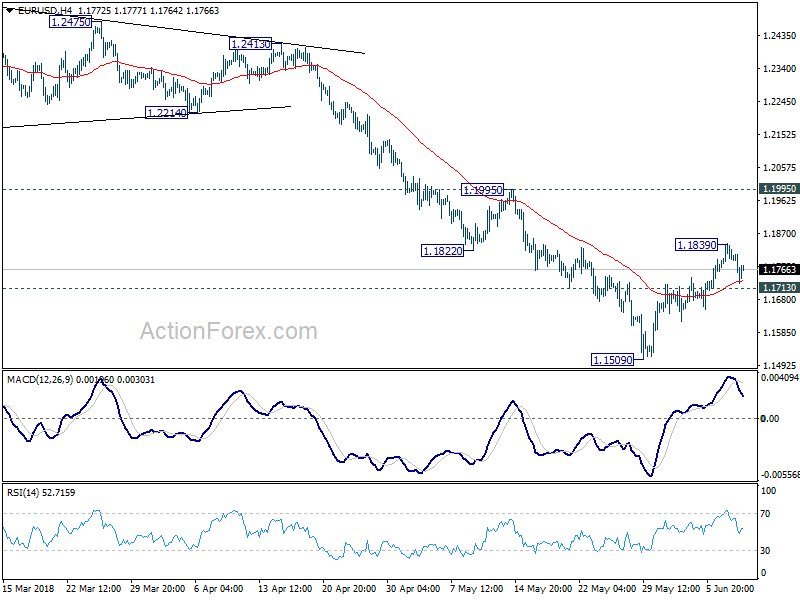
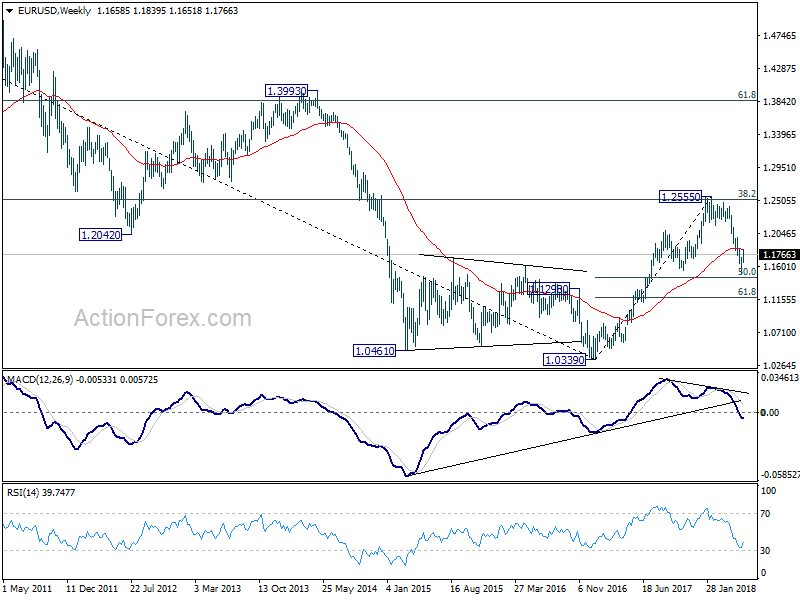
EUR/USD's rebound from 1.1509 short term bottom extend to 1.1839 last week but lost momentum since then. As the pair stays above 1.1713 minor support, initial bias is neutral this week first. Above 1.1839 will extend the rebound. But since it's seen as a correction, upside should be limited by 1.1995 resistance to bring reversal. On the downside, break of 1.1713 minor support will likely resume larger fall from 1.2555 through 1.1509 to 50% retracement of 1.0339 to 1.2555 at 1.1447.
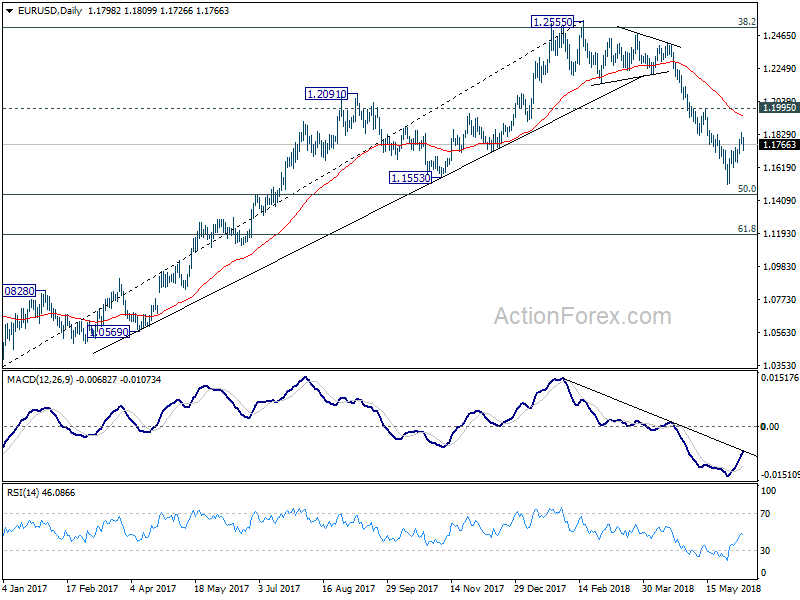
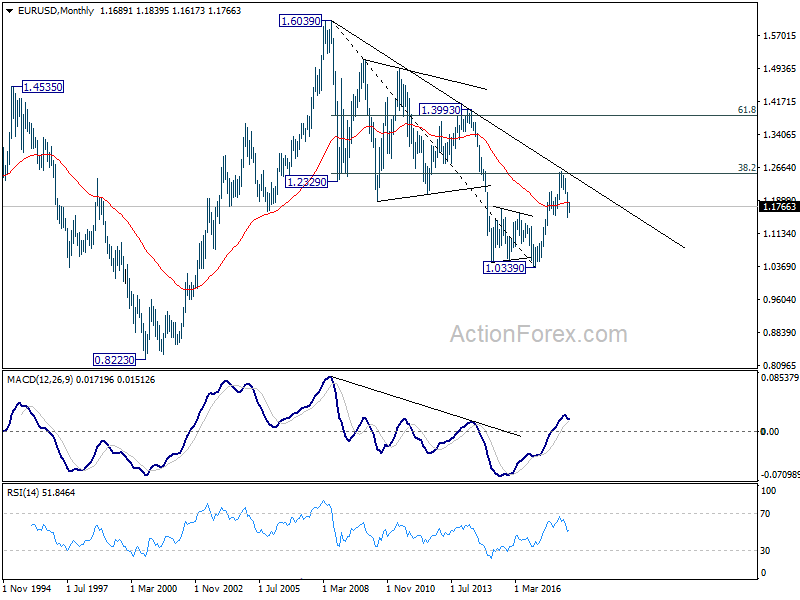
In the bigger picture, current development suggests that EUR/USD was rejected by 38.2% retracement of 1.6039 (2008 high) to 1.0339 (2017 low) at 1.2516. And, a medium term top was formed at 1.2555 already. Decline from there should extend further to 61.8% retracement of 1.0339 to 1.2555 at 1.1186 and below. For now, even in case of rebound, we won't consider the fall from 1.2555 as finished as long as 1.1995 resistance holds.
In the long term picture, the rejection from 38.2% retracement of 1.6039 to 1.0339 at 1.2516 argues that long term down trend from 1.6039 (2008 high) might not be over yet. EUR/USD is also held below decade long trend line resistance. Focus will now turn to 1.1553 support. Sustained break there would raise the chance of retesting 1.0339 low. It's early to tell, but the chance of long term bullish reversal is fading.
Day 1 of G7 in Charlevoix in 60s
https://twitter.com/g7/status/1005275092883005440
Summary 6/11 – 6/15
Monday, Jun 11, 2018
[php_everywhere instance="1"]
Tuesday, Jun 12, 2018
[php_everywhere instance="2"]
Wednesday, Jun 13, 2018
[php_everywhere instance="3"]
Thursday, Jun 14, 2018
[php_everywhere instance="4"]
Friday, Jun 15, 2018
[php_everywhere instance="5"]
Weekly Economic and Financial Commentary: Less Slack in the Economy
U.S. Review
Less Slack in the Economy
- April factory orders slid in the wake of a strong March reading, however the details of the report remained supportive of modest equipment investment in Q2.
- May's ISM non-manufacturing survey strengthened for the month but showed signs of input costs rising.
- The trade deficit narrowed in April signaling that trade is likely to add to GDP growth again in the second quarter.
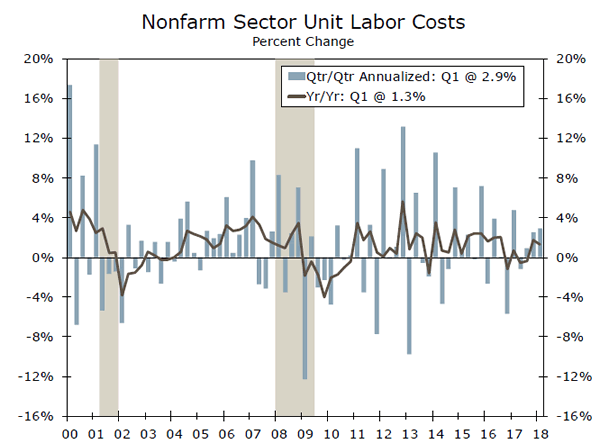
- Productivity rose 0.4 percent in Q1, while unit labor costs climbed 2.9 percent (annualized), signaling a continually tightening labor market.
Less Slack in the Economy
This week, economic data mostly reflected the effects of less slack in the economy. Factory orders showed another backlog of unfilled orders, while the ISM non-manufacturing report highlighted increasing input cost pressures in the service sector. Productivity growth improved 0.4 percent in the first quarter but unit labor costs grew 2.9 percent on an annualized basis. In short, with the robust pace of GDP growth we are forecasting in the second quarter (4.2 percent) combined with a continued reduction in slack in both the supply chain and the labor force, we see the scene set for a higher inflation environment as the year progresses.
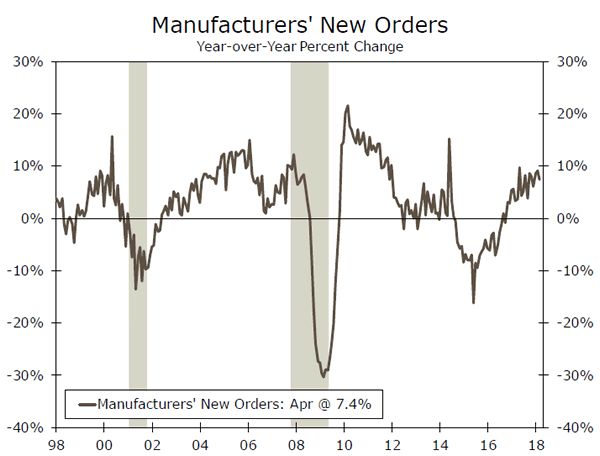
April factory orders declined 0.8 percent, reversing part of March's 1.7 percent increase. The closely watched core capital goods shipments component climbed 0.9 percent in the first month of the quarter, supporting our view of a modest pace of equipment investment. There were, however, signs of strain in the supply chain as the number of unfilled orders has climbed in five of the last six months.
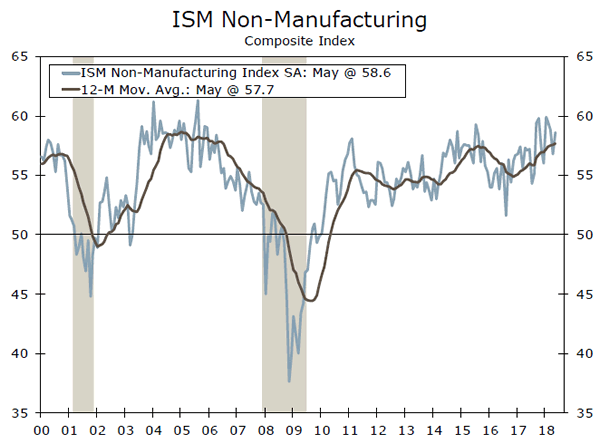
May's ISM non-manufacturing reading notched another gain, rising to 58.6 from 56.8 in April. Like the factory orders report, the ISM non-manufacturing report showed that order backlogs are rising at the fastest pace in the survey's history. Supplier delivery times are also increasing. The diminished slack in both the manufacturing and service sectors of the economy reflects the ongoing robust pace of overall economic activity and signals upside risks to price pressures in the coming months. To that end, the ISM's survey showed that the prices paid component rose for the third month in a row and now stands at 64.3, up from 59.9 in December of last year.
The final look at first quarter productivity showed that the measure rose 0.4 percent from the prior quarter but the bigger story was another gain in unit labor costs, which now stands at 2.9 percent on an annualized basis. The higher unit labor costs combined with the higher prices paid component of the ISM indices also underscore the continual tightening in the labor market.
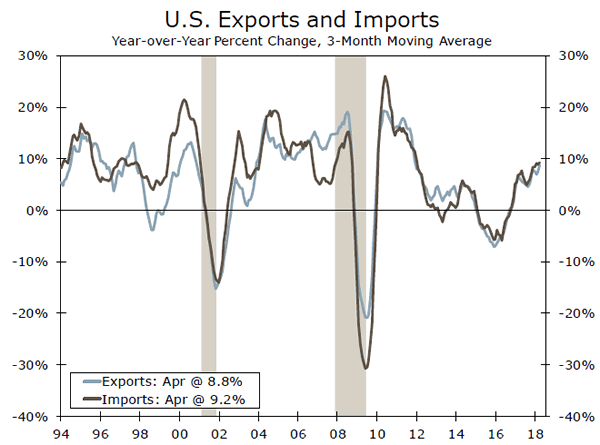
The trade deficit shrunk in April to $46.2 billion from March's $47.2 billion deficit. Imports in April fell 0.2 percent, while exports picked up 0.3 percent for the month. The surprising strength in export growth is likely to add to GDP growth in Q2. In our forecast, released this week, we see net exports adding 0.7 percentage points to headline GDP growth for the quarter.
Looking ahead to the remainder of the year, we are less optimistic that trade will continue to add to growth. One development we are watching closely is the potential fallout from the Trump administration's recent string of tariff announcements. In particular, other trading partners have signaled their intent to match, and in some cases expand upon the types of goods subject to import tariffs. The net result, in our view, is likely some downside risk to export growth down the road once these tariffs start taking hold. The possibility also exists that such tariffs could create global inflationary pressures, particularly for intermediate goods in the production process.
U.S. Outlook
CPI • Tuesday
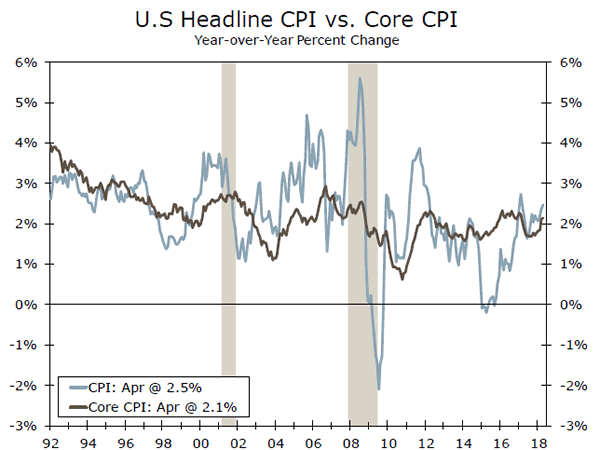
April's CPI read came in a bit softer than expected at 0.2 percent for headline consumer inflation, while the core CPI was a more tepid 0.1 percent. The food and energy components have been quite volatile in recent months, particularly food prices which saw its largest monthly gain in nearly a year. The softer showing in core prices is likely just some payback from the rapid clip posted in the first quarter of 2018. The upward trend remains intact. The yearover- year increase in headline CPI rose to 2.5 percent, largely reflecting base effects from last year's soft patch in wireless prices and other transitory factors.
The clearly upward trend in price pressure is sufficient for further Fed rate hikes. Inflation data for May will also see a boost from higher gasoline prices in the headline. Core inflation should also remain on an upward trend for the rest of the year as wage pressures and supply chain constraints put further pressure on prices.
Previous: 0.2% Wells Fargo: 0.3% Consensus: 0.2% (Month-over-Month)
Retail Sales • Thursday
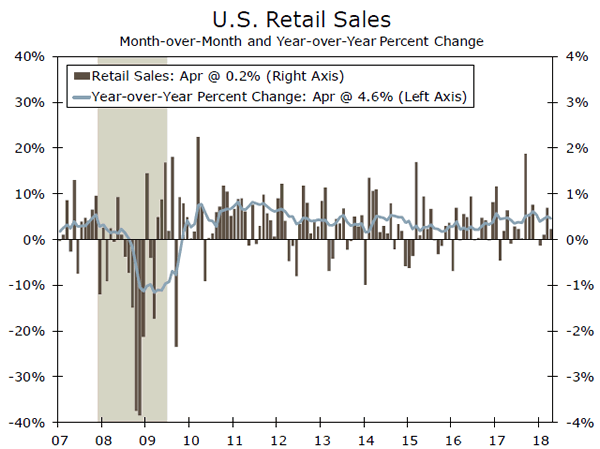
Retail sales rose a solid 0.2 percent in April and sales in March were revised higher to 0.7 percent. The consumer clearly had solid momentum going into the second quarter. The strongest retail categories in April were clothing and accessories and miscellaneous stores. Gas stations sales were also boosted by higher prices, which likely continued into May. Auto sales were basically flat in April on the heels of an impressive 2.0 percent increase in March.
Control group sales, which is a proxy for personal consumption in the GDP tables, was relatively strong in April with a 0.5 percent gain. That acceleration is a good start to Q2, which we anticipate will be an impressive bounce back from Q1 PCE. Our forecast calls for personal consumption to expand at a 3.4 percent pace in Q2 after a softer 1.0 percent rate in Q1.
Previous: 0.2% Wells Fargo: 0.4% Consensus: 0.4% (Month-over-Month)
Industrial Production • Friday
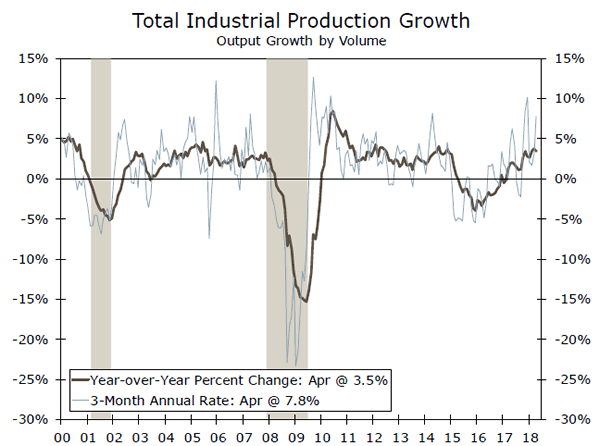
Industrial production rose 0.7 percent in April to a fresh all-time high. All three major categories contributed to the increase. Manufacturing production rose 0.5 percent, mining extraction increased 1.1 percent and utilities rose 1.9 percent on the month. The strong showing in April represented a good start to Q2 after a softer Q1, which revisions made slightly lower in April. Still, the firming trend in U.S. industrial output is clear now that the energy-driven sectors of the economy are back in expansion territory.
Capacity utilization rose 0.4 percentage points to 78.0 percent in April, in line with its 2013 level and 1.6 points below the cycle high posted in November 2014. The absorption of excess slack in production bodes well for the equipment investment line of GDP going forward as businesses work to meet rising demand for products. Tightening in the supply chain and labor market should incentivize continued spending on more equipment going forward.
Previous: 0.7% Wells Fargo: 0.2% Consensus: 0.3% (Month-over-Month)
Global Review
Emerging Markets Feel the Pain; Eurozone Q1 GDP
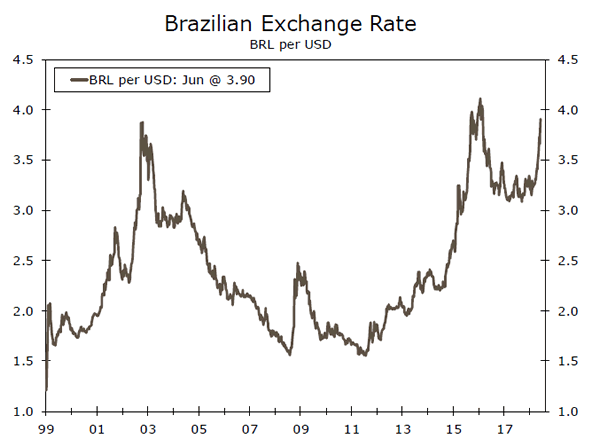
- Several weeks after Argentina and Turkey sent chills across emerging markets as currencies faced increased pressure, it seems that it is Brazil's turn this week, as the Brazilian currency has weakened to about 3.90 reais per U.S. dollar.
- In the Eurozone, government expenditures remained flat in the quarter after an unrevised 0.3 percent increase in the previous quarter and market expectations of a 0.2 percent increase.
- China reported slightly lower foreign exchange reserves in May, down a bit more than $14 billion compared to April. This was the third consecutive monthly decline.
Emerging Markets Global Interest Rate Pain
Several weeks after Argentina and Turkey sent chills across emerging markets as currencies faced increased pressure, it seems that it is Brazil's turn this week as the Brazilian currency has weakened to about 3.90 reais per U.S. dollar. Several weeks ago, analysts were calling for the Brazilian central bank to lower interest rates in the following meeting of the COPOM, the central bank's policy committee. However, they were surprised with the bank's decision to keep interest rates unchanged. Now there are some analysts calling for the central bank to start increasing interest rates. The Brazilian central bank will probably have to walk a fine line, as recent inflation numbers have been higher than expected, and it does not want expectations on inflation to start moving up. Furthermore, the recent currency jitters are just an added concern for an economy that is facing increased uncertainty due to the upcoming presidential political cycle where the leading candidates today are not perceived to be market/business friendly folks.
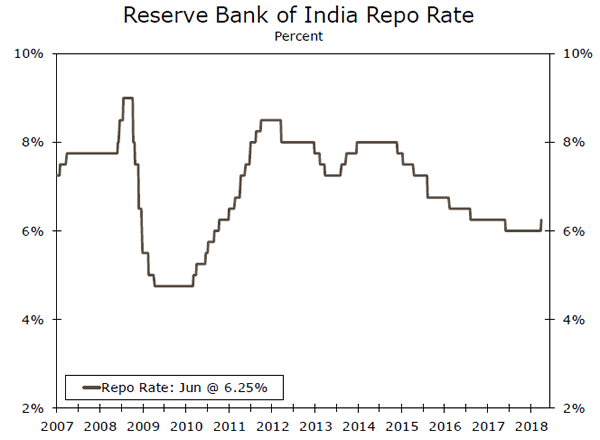
In India, the Reserve Bank of India (RBI) surprised markets with a 25 bps increase to its main repurchase rate, perhaps reacting not only to a strengthening economy but also to pre-empt any spillover effect from the recent crises in Argentina, Turkey and other emerging market economies. The RBI also increased the reverse repo rate by 25 bps to 6.00 percent while leaving the cash reserve ratio unchanged at 4.00 percent.
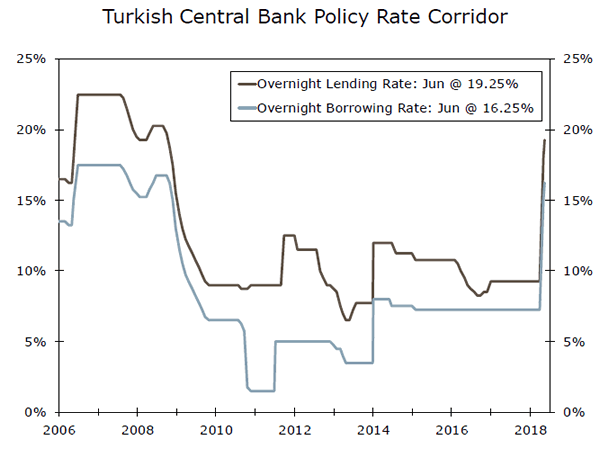
Meanwhile, Turkey's central bank also unexpectedly increased interest rates in an effort to defuse the pressure over the country's currency. The central bank increased the one-week repo rate by 125 bps while markets were expecting the bank to stay put at 16.50 percent. The rest of the rates were also increased 125 bps, the overnight lending rate to 19.25 percent while the overnight borrowing rate was increased to 16.25 percent.
China reported slightly lower foreign exchange reserves in May, down a bit more than $14 billion compared to April. This was the third consecutive monthly decline. However, foreign reserves remained slightly above $3.1 trillion, which is still a high foreign exchange reserve level.
Details of Eurozone Q1 GDP Better Than Expected
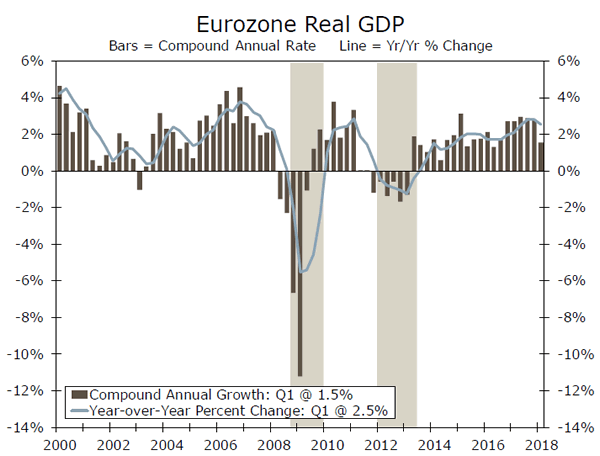
The Eurozone released detailed results for the demand side of the economy and while the overall result did not change, up 0.4 percent sequentially, not annualized, household consumption was higher than expected, up 0.5 percent versus market estimates of only 0.2 percent. Meanwhile, although gross fixed capital formation was lower than expected, up 0.5 percent versus expectations of a 0.7 percent increase, the previous quarter result was revised up from an original increase of 0.9 percent to 1.3 percent, sequentially and not annualized. Government expenditures remained flat in the quarter after an unrevised 0.3 percent increase in the previous quarter and market expectations of a 0.2 percent increase. On a year-earlier basis, GDP for the Eurozone was up 2.5 percent, agreeing with consensus expectations but lower than in Q4 of last year when it grew at a 2.8 percent rate.
Global Outlook
China Industrial Production • Wednesday
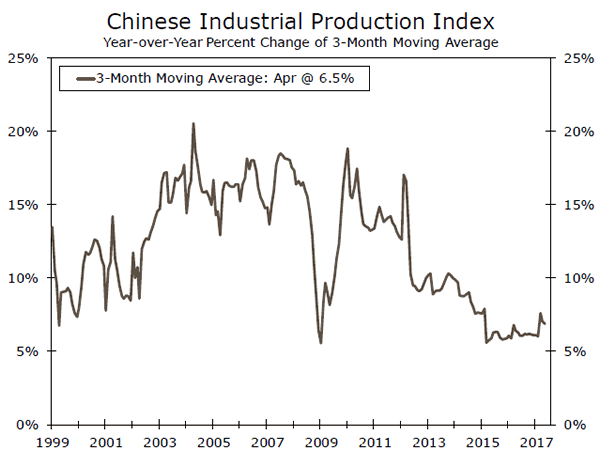
Next Wednesday, data on Chinese industrial production, fixed investment spending and retail sales will be reported for May. Thus far, economic indicators for the quarter suggest another dose of steady growth in Q2. Purchasing manager indices have been relatively flat over the past few months, while some April weakness in retail sales was offset by stronger-than-expected industrial production. With several smaller emerging market economies like Argentina and Turkey showing signs of stress, continued steadiness in the data out of China would be beneficial to global markets. In addition to the data next week, the White House has stated that it plans to announce a verdict on the tariffs it has proposed on imported Chinese goods by June 15. With Chinese policymakers trying to tightly control a gradual economic deceleration amid deleveraging efforts, tariffs on U.S. imports from China are a downside risk to growth in the quarters ahead.
Previous: 7.0% Consensus: 7.0% (Year-over-Year)
European Central Bank Meeting • Friday
The European Central Bank (ECB) will meet next week at what could be a crucial inflection point for monetary policy in Europe. Expectations had been building for months that the ECB would end or taper its purchases further in October. However, over the past couple months, a soft patch in growth and inflation coupled with political turbulence in Italy and Spain have raised questions about whether the ECB would actually cease buying by year's end.
We continue to remain of the view that the ECB will taper once more in October and end purchases by the end of 2018. Recent public comments by ECB officials have made markets aware that this will be a "live" meeting to discuss the end of asset purchases despite recent events. We do not envision a rate hike from the ECB until mid- 2019, and firming growth and inflation fundamentals in the coming months would go a long way towards keeping the tightening process moving in Europe.
Previous: 0.00% Wells Fargo: 0.00% Consensus: 0.00% (Refinancing Rate)
Bank of Japan Meeting • Friday
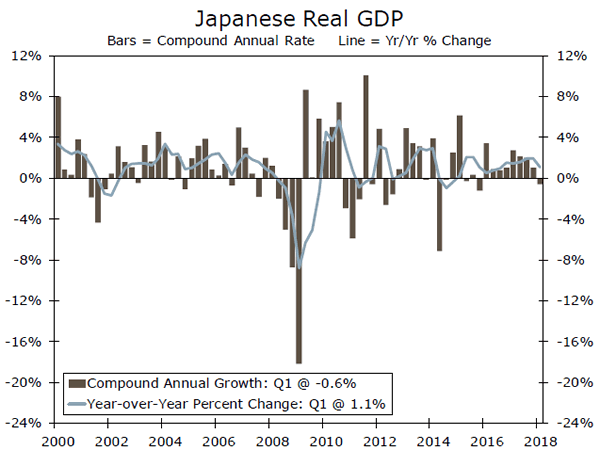
The Bank of Japan (BoJ) will meet at the end of next week in what will likely be a quieter meeting relative to the Fed and ECB over the two previous days. The Japanese economy contracted in Q1, snapping a streak of eight consecutive quarters of expansion. Inflation, while off its recent lows, has remained well short of the BoJ's 2 percent target through the first half of 2018.
At its April meeting, the BoJ held interest rates steady and maintained its comprehensive program of monetary policy support, but it dropped any reference to a timeline for achieving its 2 percent inflation target, although Governor Kuroda affirmed multiple times that the removal of the date was not in any way an indication of monetary policy bias. Given both the recent and historical track record for growth and inflation in Japan, we expect the BoJ to maintain its current degree of monetary policy accommodation for the foreseeable future.
Previous: -0.10% Wells Fargo: -0.10% Consensus: -0.10% (Policy Rate)
Point of View
Interest Rate Watch
Benchmark Yields and Inflation
While the 1o-year U.S. Treasury yield is treated as a benchmark for the bond market, the evidence indicates that the yield is not mean-reverting and is characterized by high volatility. One factor that does cause a change in the 10-year yield is the growth of nominal GDP.
Break Evens and Inflation
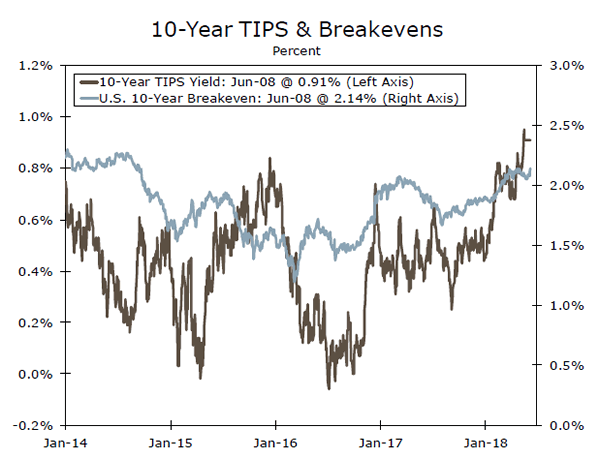
As illustrated in the top graph, both the breakeven and TIPS components of the 10-year have risen over the past year, and this would be consistent with the upswing in nominal GDP.
That upswing has also supported the case for the Federal Reserve to continue on its dot-plot path to raise the funds rate, which we expect it to do at its meeting next week. The rise in the breakeven rate is consistent with the rise in actual and expected inflation. Since early 2015, measures of average hourly earnings, the ISM prices paid index and the PCE deflator have all moved upward. Meanwhile, the TIPS yield has also moved higher on trend since last year, as would be consistent with an increase in real yields, reflecting a stronger economic expansion in recent months.
But if the FOMC Moves, Then What?
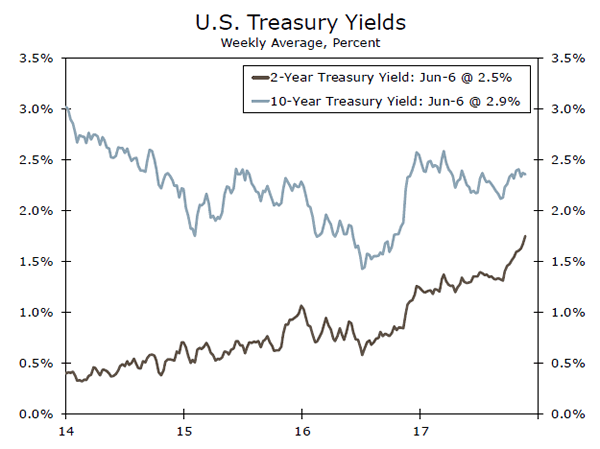
One interesting dynamic is that the expected pace of FOMC moves appears to be more aggressive than market expectations of real growth and inflation. As illustrated in the middle graph, since mid-2016 the two-year yield has risen more than the 10-year yield. The market is discounting a faster pace of FOMC rate hikes than the combined effect of faster real growth and inflation going forward. This is typical of this stage of the business cycle and the pattern of a flatter yield curve.
Inflation Overshoot and Yield Curve?
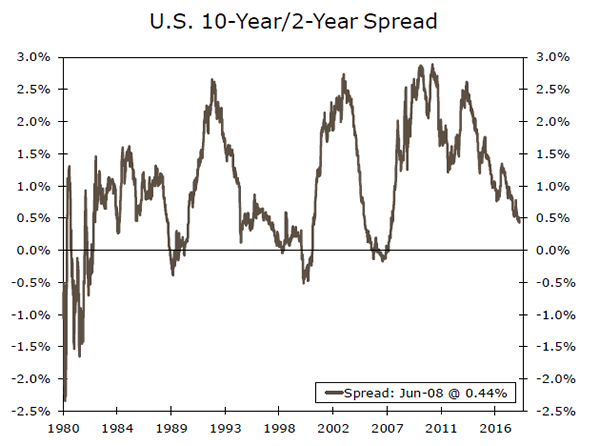
For decision makers, there is a distinct issue facing us in the first half of 2019. A pattern of continued FOMC tightening will tend to raise the two-year rate faster than the pace of our expected nominal GDP gains, thereby leading toward an inverted yield curve (bottom graph). Recent FOMC commentary has intimated that some members would let inflation overshoot the perceived two percent target and by implication avoid an inverted yield curve—an interesting policy tradeoff.
Credit Market Insights
Consumer Credit Slows Once Again
Consumer credit slowed for the third consecutive month in April, expanding $9.3 billion during the month. This fell short of consensus expectations for a $14.0 billion expansion on the month. Both revolving and non-revolving credit grew by below their averages for the current cycle, rising $2.3 billion and $7.0 billion, respectively.
The U.S. consumer has helped sustain the duration of the current economic expansion. Rising levels of consumer credit helped drive personal consumption, backed by strong confidence in the economy. Recent consumer credit prints that have been weaker than expected are beginning to cast doubt upon the strength of the consumer, as slowing credit balances indicate a more wary and cautious disposition toward spending. We are not expecting a halt to credit, but it is something that merits watching.
Part of the slowing credit story could be explained by the Fed's accelerating tightening policy, which has lifted shortterm interest rates. This makes outstanding balances on credit cards, auto loans and other consumer debt products more expensive. We expect the FOMC to continue raising rates throughout the end of 2019. Delinquency rates are also rising across all product types, as debt is becoming more expensive and harder for consumers to cover. We will be watching closely consumer credit reactions to rising borrowing costs amid monetary policy tightening.
Topic of the Week
Double, Double Oil and Trouble
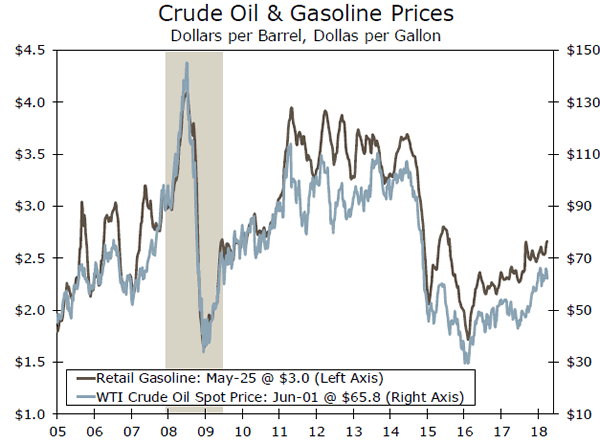
Oil prices have more than doubled since early 2016, including a 40 percent increase in WTI over the past year. Consumers have been paying up at the pump as a result. Through April, the Consumer Price Index (CPI) for gasoline was up more than 13 percent year over year and had added half a percentage point to the 2.5 percent increase in the CPI. Inflation, as measured by the PCE deflator, returned to the Fed's 2.0 percent inflation target in March, due in no small part to energy prices.
For the Fed, inflation will remain the primary focus for near-term policy. However, central bankers typically exclude food and energy prices when analyzing trend inflation, since price fluctuations are often driven by short-term changes in supply. Therefore, from a monetary policy perspective, higher energy prices matter mostly in terms of how much they feed into core inflation.
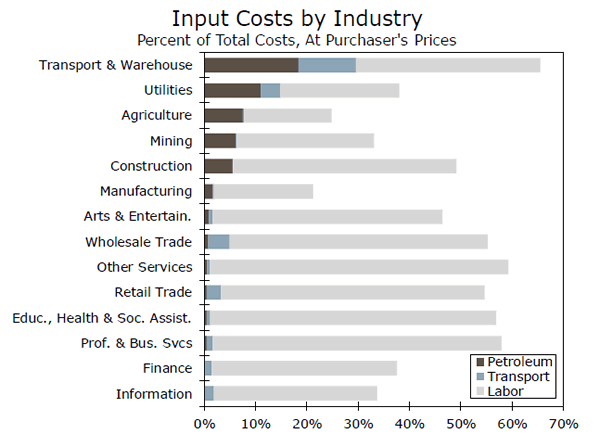
If persistent, energy price changes should eventually be transmitted to "core" prices as businesses, facing higher transportation and/or production costs, charge more for goods and services. However, in general, petroleum products and transportation represent a relatively small share of inputs. Labor remains by far the biggest input cost for most industries, and particularly services, which dominate the core inflation index. Therefore, the passthrough of higher oil prices to core consumer prices is ultimately quite small. Analyzing data since 1980, we find only a slight positive correlation between oil prices and core inflation (0.124), even when accounting for a lag.
Another mechanism through which oil prices can indirectly support core inflation is by supporting inflation expectations, since price changes at the pump are highly visible to consumers. Consumer expectations of longterm inflation have yet to recover the ground lost since 2014, but have held steady since the start of the year.
Overall, we expect a minimal effect from energy on core inflation. A tight labor market and core PCE inflation headed to 2.0 percent, irrespective of energy prices, should keep the Fed on track for three more rate hikes this year, For more, see our recent report "Running on Empty: Energy and the Inflation Outlook."
The Weekly Bottom Line: FOMC Locked in for Second Rate Hike of 2018
U.S. Highlights
- Next week the Federal Open Market Committee (FOMC) will meet for the fourth time this year to discuss whether the current level of monetary stimulus is appropriate for the U.S. economy.
- Well above-trend economic growth and inflation at target should be enough to convince the FOMC to move its main policy rate up by 25 basis points.
- Elevated geopolitical uncertainty is likely to keep the FOMC on its current course of gradual rate hikes.
Canadian Highlights
- G7 leaders meet this weekend in Charlevoix, Quebec. Trade wars threaten to overshadow the meeting with recent U.S. tariffs on steel and aluminum sparking an escalating war of words between the U.S. and its G7 counterparts.
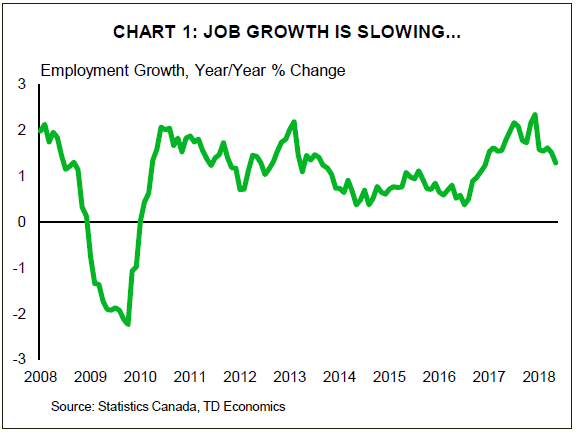
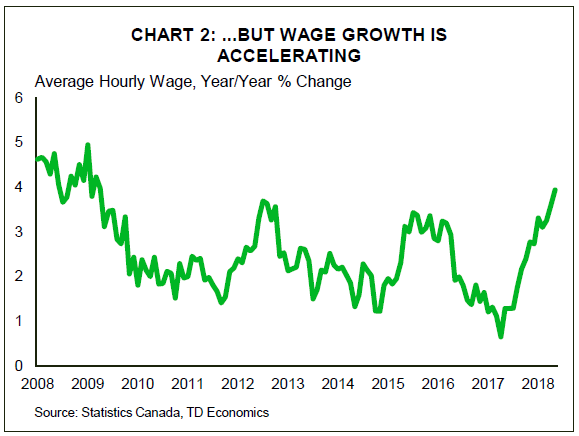
- Canada's job market took a step back in May, shedding 7.5k jobs. Still, the unemployment rate remained unchanged at a cycle low of 5.8% as people left the labor market. Encouragingly, wage growth accelerated to 3.9%, its strongest reading in nine years.
- Ontario elected a new PC majority government, ending 15 years of Liberal party rule. The new government will face a challenging environment of slower economic growth and has some work ahead to maintain fiscal sustainability.
U.S. - FOMC Locked in for Second Rate Hike of 2018
Next week the Federal Open Market Committee (FOMC) will meet for the fourth time this year to discuss whether the current level of stimulus is appropriate for the U.S. economy. During their discussions they will evaluate the health of the economy, wage and price pressures, and emerging risks before deciding on revisions to their outlook for economic activity, inflation, and the future path of the fed funds rate.
The U.S. economy is firing on all cylinders at the moment. Growth in the second quarter is currently tracking a blistering 4.0% annualized pace, helped along by a strong rebound in household spending, firm business investment, and surprising strength in net exports. What's more, growth is expected to continue at a 3.0% annualized pace on average for the remainder of the year, with fiscal stimulus contributing about half a point.
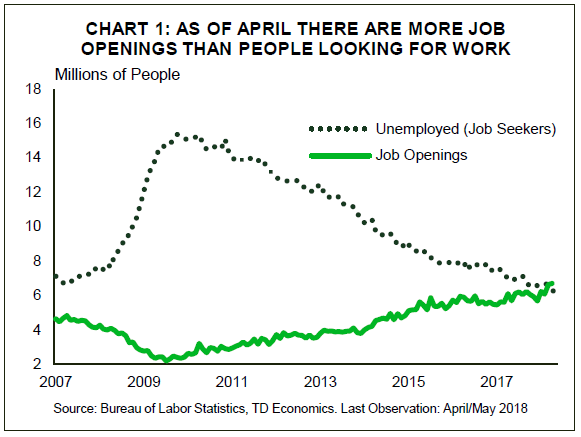
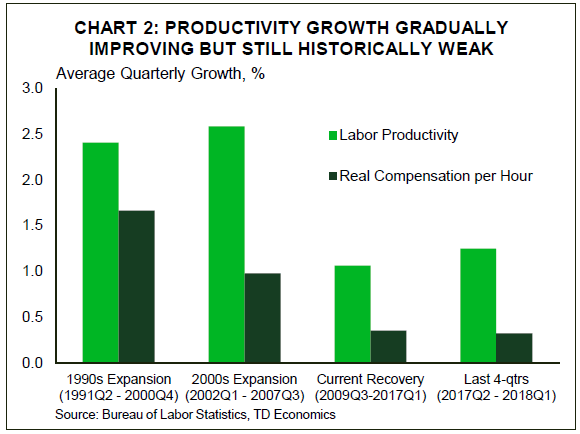
Strong economic activity is working to absorb any remaining spare capacity. The unemployment rate is at an eighteen year low, and as of April there were more job openings than there were job seekers (Chart 1). Wage growth is healthy by historical standards, but should move even higher as skilled labor becomes scarce. But, wages typically keep up with productivity growth, and on that front the U.S. economy continues to perform below historical trends (Chart 2).
Consumer price inflation is above 2.0%, a sign that the U.S. economy is bumping up against capacity constraints. Add higher fuel prices, higher import prices due to increased tariffs, and strong wage growth, and it's just a matter of time before profit margins get pinched enough for firms to pass on rising costs to consumers. All told, headline consumer price inflation is likely to peak at 2.7% this year, with the Fed's preferred measure, the core personal consumer expenditure deflator, holding near its target of 2.0% through the end of this year.
Altogether, this solid outlook should be more than enough to convince the FOMC that the U.S. economy does not require the amount of monetary stimulus currently on offer. As a result, the fed funds rate is likely to move up by 25 bps next week, with another hike or even two embedded in the updated dot plot summary for this year.
That said, although further rate hikes are certain, their exact timing is still open for debate. Geopolitical risks remain elevated, and a policy misstep or two may be just enough to send financial markets, business confidence, and global trade into a tailspin. Trade skirmishes could easily escalate into trade wars, particularly if talks fail to make progress between the U.S. and its major trading partners. Although much better prepared than in past tightening cycles, emerging markets remain at the mercy of nervous investors who are more concerned with capital retention than returns in such an uncertain environment. Argentina and Turkey were the first victims of speculative attacks, but they surely will not be the last during this tightening cycle. All told, in light of these and other risks, the FOMC is likely to stay on its current path of gradual rate hikes.
Canada - Trade Disputes Take Center Stage as G7 Meets
It was a whirlwind week for Canada. As Prime Minister Trudeau gets ready to host fellow G7 leaders, the trade dispute with the United States continues to boil, setting a testy stage for the meeting. Both sides appear to be steeling their resolve. On the Canadian side, Prime Minister Trudeau held a joint press conference with French President Macron, where he again expressed his dissatisfaction with steel and aluminum tariffs. Trump retorted in several tweets, calling out Canada's protected agricultural sector.
Fortunately, there was some good news for Canada the in the international trade report this week. Canadian exports climbed 1.6% (m/m) in April, with big gains in mineral products and consumer goods. This marked the sixth increase in seven months. With imports dropping 2.5% (reversing part of the prior month's 6% run-up), the merchandise trade deficit narrowed. This strong start to Q2 suggests that trade could add substantially to GDP growth – breaking a three-quarter streak of subtraction. Still, the external environment will remain challenging.
While exports of steel and aluminum are a small share of overall trade (accounting for 2.5% of exports and 1.5% of imports) an escalating trade war will not help. Given the headwinds to domestic demand from rising interest rates, this is one reason to expect a more muted pace of economic growth over the foreseeable future.
Were it not for the trade kerfuffle, the Canadian government had hoped to theme the meeting around inclusive economic growth and environmental sustainability. A policy paper released by the Canadian government noted that even as G7 economies have made considerable progress in moving toward full-employment, many people still feel left behind. This is important context to the meeting, and even frames the anxiety around trade. Economic growth doesn't mean as much if the benefits only accrue to a select few. On that front, the report noted the challenges in measuring well-being that cannot be captured in GDP growth, especially in an environment of increasing inequality.
On the employment and income front, Canada's job market took a step back for a second straight month in May, shedding 7.5k jobs. Despite the losses, the unemployment remained unchanged at a cycle-low of 5.8%. While much of the details of the report were soft (full-time jobs dropped 31k, while part time rose 23.6k), the one exception was wage growth, which accelerated to 3.9% in the month – its highest rate in nine years. Notably, wage growth has accelerated across major industries, with 12 of 16 above the 3% mark.
Of course, the other big news this week was that Ontario elected a new PC majority government, ending 15 years of Liberal party rule. The election result was not surprising, but the magnitude of the victory perhaps was. The new government will face a challenging environment. Growth in Ontario is likely to cool from its relatively heady pace over the last few years, and the government still has work to do in closing the budget deficit. The party's pledges during the election committed to cutting taxes, but were light on details about where offsetting cuts would be made. We look forward to seeing the details as the government is formed and communicates its fiscal plans.
U.S.: Upcoming Key Economic Releases
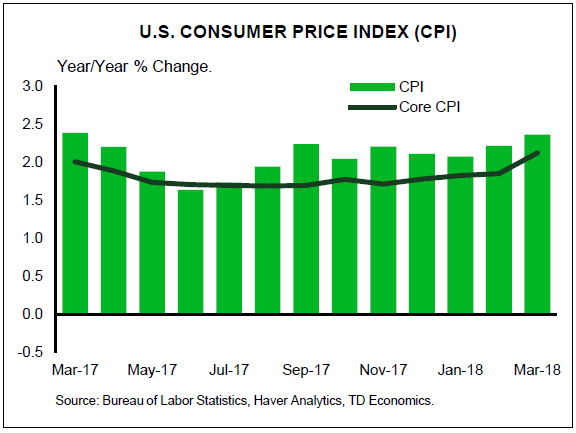
U.S. Consumer Price Index - May
Release Date: June 12, 2018
Previous Result: 0.2% m/m, 2.5% y/y
TD Forecast: 0.3% m/m, 2.8%
Consensus: 0.2% m/m, 2.8% y/y
We expect headline CPI inflation to hit 2.8% y/y in May, led by another surge in gasoline prices. Prices at the pump jumped further by about 6%, peaking in late May. Their rise is likely to resume in the summer months, though likely by a smaller margin. Utility costs however should offset on weakness in electricity. Moderate gains in food prices will allow for a positive contribution to the headline. Outside of food and energy, we look for a 0.2% m/m print after the disappointing 0.1% print in the prior month. That should drive core inflation higher to 2.2% y/y. Driving the pickup will be a firmer read on core goods prices after back-to-back declines in the prior month and ongoing strength in core services, the latter led by potential pickups in medical care and airfares. However, we expect any rebound to be limited by a likely moderation in OER and rents, which posted outsized gains in April. Thus, we view risks as skewed to the downside.
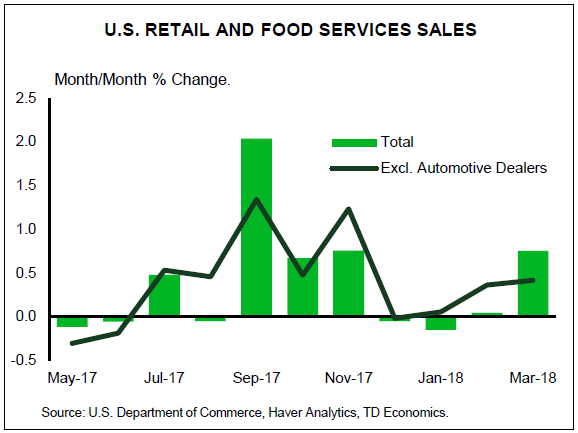
U.S. Retail Sales - May
Release Date: June 14, 2018
Previous Result: 0.3%, ex-auto 0.3%
TD Forecast: 0.5%, ex-auto 0.7%
Consensus: 0.4%, ex-auto 0.5%
We look for a strong 0.5% rise in retail sales, propped up by higher gasoline prices along with a solid 0.3% increase in the core group. More favorable weather suggests a boost from building materials and food services categories as well. This should leave Q2 real consumer spending tracking near a robust 3% pace given the solid performance in April.
Canada: Upcoming Key Economic Releases
Canadian Manufacturing Sales - April
Release Date: June 15, 2018
Previous Result: 1.4% m/m
TD Forecast: 1.0% m/m
Consensus: N/A
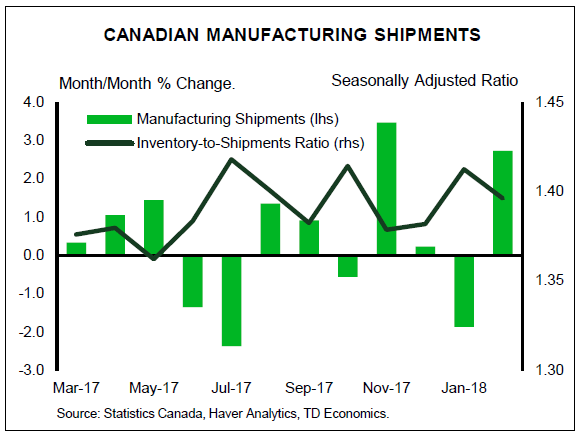
TD expects manufacturing sales to rise by 1.0% m/m in April, building on strength in the prior two months. Non-durable goods should serve as the primary driver of growth amid a sharp pickup in gasoline prices, while soft exports of transportation equipment suggest a weaker performance in durables. The advance in real manufacturing sales should be roughly half the nominal gain owing to higher factory prices, though this is still suggestive of a healthy contribution to industry-level GDP for April. Looking ahead, Canada's manufacturing sector is subject to elevated uncertainty following the implementation of steel and aluminum tariffs, which took effect on June 1st, though the strong hand-off from March should help to anchor Q2 exports.
Dollar Struggles as Geopolitics and Central Banks Take Center Stage
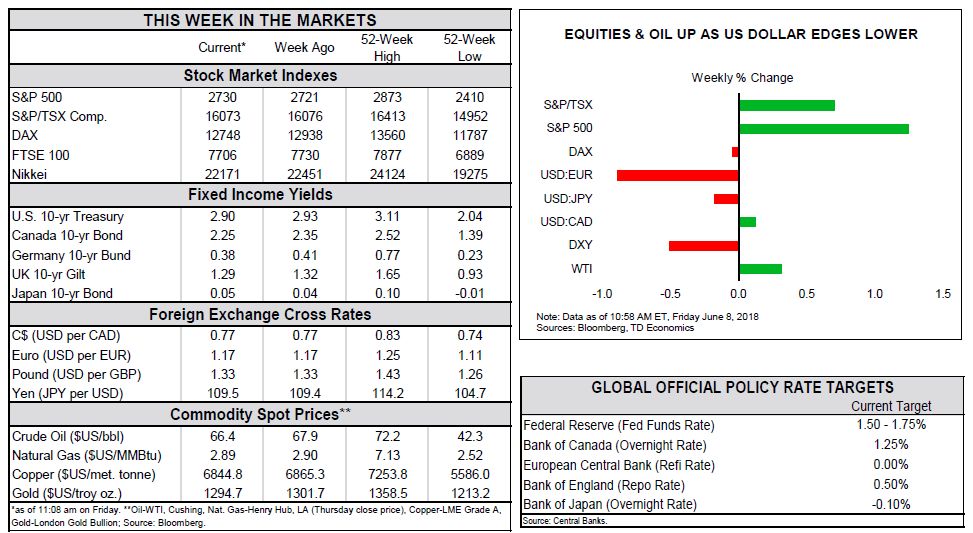
The US dollar is lower against major pairs this week as the market prepares for an eventful week. The U.S. Federal Reserve will kick off its June Federal Open Market Committee (FOMC) meeting on Tuesday June 12. The two day meeting is expected to end with the announcement of a 25 basis points rate hike. The same day President Donald Trump will be in Singapore for the much anticipated meting with North Korean Leader Kim Jong Un. That is also the same day that UK Prime Minister Theresa May will ask her party to overturn changes to the EU withdrawal bill. The European Central Bank (ECB) could add support for the single currency with analysts anticipating a hawkish statement signalling faster tapering on its massive QE program.
- G7 meeting aftermath to guide markets
- US central bank expected to hike rates on Wednesday
- ECB and BoJ to hold but could give more insight on monetary policy
Euro Higher as Italian Drama Ebbs and ECB Forecasted Hawkish
The EUR/USD rose 0.97 percent during the last five trading sessions. The single currency is trading at 1.1761 ahead of the weekend G7 meeting in Canada. The biggest topic given the escalation of tariffs prior to the sit down will be trade. The US ended the exclusion from the steel and aluminum tariffs for the EU with a retaliation forthcoming. The trade spat has triggered a flight to safety for investors that have sold the dollar. The EUR has recovered after the Italian political crisis was averted although questions remain on the stability of the Union as the rise of euro scepticism grows.
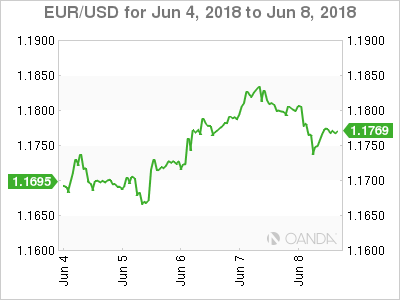
The ECB is now expected to tighten monetary policy in June following the actions from the U.S. Federal Reserve. The rate lift by the US central bank has already been priced in which is why it won’t drive the USD higher. The ECB in contrast has been less clear with its monetary policy intentions. EUR/USD flows indicate a belief that with the Fed tightening on Wednesday it can offer a further monetary policy signal and make a clear indication it will end its QE program this year opening the possibility of an European rate hike in 2019.
The Fed and the ECB could collectively make a statement on their confidence on the strength of their respective economies. While the central banks might be on the same page things are different on the political arena. US President Donald Trump was again on the trade offensive ahead of the G7 meetings. The US risks being isolated from other major economies if the tone continues to be so combative. The US has opened various fronts which will tax its ability to deal effectively with so many concurrent negotiations on top of growing issues of national importance.
Loonie Lower as Canada Hosts G7 Meeting
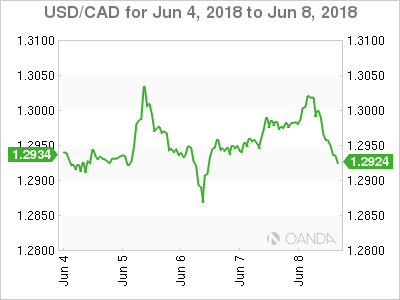
The USD/CAD gained 0.24 percent during the week. The currency pair is trading at 1.2983 after trading in a tight band all week. The US has toughened its stance on trade adding uncertainty to NAFTA ongoing renegotiations. The loonie also took a hit from the weaker than expected job numbers published on Friday. The Canadian economy lost 7,500 jobs in May with a forecast of a gain of 17,500. The main positive of the report was the rise of hourly wages and it might just have been enough to cancel the negative impact of the headline number miss.
Possible End of OPEC and Russia Deal to Decide Fate of Crude Prices
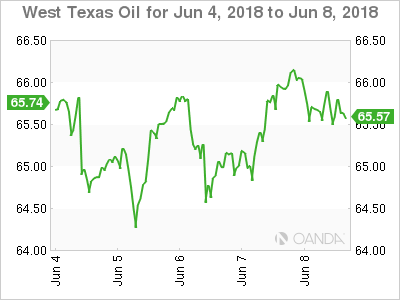
Oil prices will end the week close to where they started it. West Texas Intermediate is trading at $65.57 very close to the $65.74 price level at market open on Monday. Supply worries from Venezuela and Iran have kept prices near current levels even as the Organization of the Petroleum Exporting Countries (OPEC) and Russia will meet to review the state of their crude output agreement. The deal to limit the amount of supply has been the biggest factor in keeping prices stable after the free fall of 2014. The talk surrounding a possible easing of those terms to allow members to capitalize on high prices have put downward pressure on prices. The OPEC and Russia will meet on June 22.
Pound Rises Despite Brexit Concerns
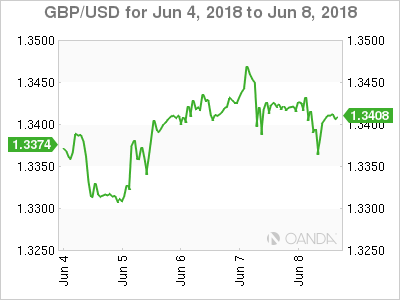
The GBP/USD gained 0.30 percent in the last five days. The currency pair is trading at 1.3382 ahead of an important decision on the Brexit process on Tuesday. The UK government will be taking votes on its EU withdrawal bill, which could end up with Parliament having a say in the Brexit deal minimizing the possibility of a hard exit scenario. The optimism about a softer Brexit deal and the possibility of a rate hike later in the summer by the Bank of England (BoE) have boosted the GBP.
Market events to watch this week:
Monday, June 11
- 4:30am GBP Manufacturing Production m/m
Tuesday, June 12
- 4:30am GBP Average Earnings Index 3m/y
- 8:30am USD CPI m/m
- 8:30am USD Core CPI m/m
- 10:00pm AUD RBA Gov Lowe Speaks
Wednesday, June 13
- 4:30am GBP CPI y/y
- 8:30am USD PPI m/m
- 10:30am USD Crude Oil Inventories
- 2:00pm USD FOMC Economic Projections
- 2:00pm USD FOMC Statement
- 2:00pm USD Federal Funds Rate
- 2:30pm USD FOMC Press Conference
- 9:30pm AUD Employment Change
Thursday, June 14
- 4:30am GBP Retail Sales m/m
- 7:45am EUR Main Refinancing Rate
- 8:30am EUR ECB Press Conference
- 8:30am USD Core Retail Sales m/m
- 8:30am USD Retail Sales m/m
- Midnight JPY BOJ Policy Rate
- Midnight JPY Monetary Policy Statement
Friday, June 15
- Tentative JPY
- BOJ Press Conference
*All times EDT
Australia & New Zealand Weekly: Public Demand and Exports Lift Australian Growth above Trend, But Consumer Still Patchy
Week beginning 11 June 2018
- Public demand and exports lift Australian growth above trend, but consumer still patchy.
- RBA: Governor Lowe and Assistant Governor Economic Ellis speak.
- Australia: Westpac-MI Consumer Sentiment, employment, housing finance, Westpac- AusChamber Manufacturing Survey.
- NZ: retail card spending, house sales & prices.
- China: new loans, retail sales, industrial production, fixed asset investment.
- US: FOMC policy decision & press conference, CPI, retail sales.
- Central banks: ECB and BOJ policy decisions.
- Key economic & financial forecasts.
Information contained in this report current as at 8 June 2018.
Public Demand and Exports Lift Australian Growth above Trend, But Consumer Still Patchy
The Australian economy performed solidly over the past year as evident from labour market trends and as confirmed in the March quarter National Accounts. However, areas of weakness persist and are likely to weigh on the outlook.
Output increased by 1.0% in the March quarter, lifting annual growth to 3.1%. This is an above trend outcome, with trend judged to currently be around 2.7%. Non-farm GDP grew by 3.6% over the year, the strongest annual outcome since 2012. Domestic demand is expanding by a little in excess of 3%, +3.2% over the past year, well up from the sluggish outcomes of around 1% prevailing over 2013, 2014 and 2015.
GDP increasing by 3.1% over the year, and by 3.6% for the nonfarm economy, brings output growth more in to line with job creation, with employment growth a brisk 3.5% over the year.
Economic conditions have been supported by a combination of powerful global and domestic forces, namely:
(1) The global backdrop is more favourable. World growth accelerated in 2017 to 3.8%, up from 3.2%, the strongest pace since 2011. We expect world growth to hold around this 3.8% pace in 2018, supported by a strengthening of conditions in the US. However, conditions in our number one trading partner, China, are likely to moderate somewhat this year.
(2) Commodity prices are up off the lows of late 2015 and early 2016, improving cash flows for miners and triggering a shift away from the earlier cost cutting mindset. Higher commodity prices have also supported government tax revenue collections.
(3) The mining investment drag is greatly diminished, albeit not quite complete, with the remaining gas projects under construction to be completed over the coming year.
(4) Non-mining investment is trending higher, led by construction activity, as the capital stock expands to meet the needs of a fast growing population.
The upshot is that business investment turned the corner in 2017, up 6%, following four years of decline, averaging -7.5% per year. In Q1, business investment consolidated, +0.1%, constrained by a dip in non-residential building work, which will be quickly reversed given the strength of approvals.
(5) Public demand, a quarter of the economy, is expanding at a well above trend pace. Investment is in an upswing, up from the lows of 2015, and additional resources are being directed to health. In Q1, public demand grew by 1.0%qtr, 5.5%yr, directly adding 1.3ppts to activity over the year, with additional positive spill-over effects.
(6) Exports are a growth driver, directly adding 0.9ppts to activity over the past year. LNG exports are expanding strongly as new capacity comes on stream and service exports have been growing solidly, although current estimates suggest a recent consolidation (one that may well be revised up as additional information becomes available).
Supply disruptions have contributed to a choppy export profile, with flow-on effects to activity. Net exports swung from a 0.65ppts subtraction in Q4 to a positive contribution of 0.35ppts in Q1.
These global and domestic developments have led to conditions becoming more synchronised across the state economies, contributing to a stronger national result. This is particularly evident in job trends, with employment trending higher across each of the major states during 2017.
We have recognised the significance of these key themes, which were broadly confirmed in the March quarter National Accounts.
Equally, there are some prevailing weaknesses, particularly around the consumer and housing. The consumer remains vulnerable at a time of weak wages growth, high debt levels and slipping house prices. The housing sector is cooling as lending conditions tighten, with prices easing back from recent highs.
Consumer spending has been mixed in early 2018, expanding just 0.3% in the March quarter, keeping annual growth at 2.9%. Household demand is tracking 'slightly below trend' and remains choppy. The absence of above trend consumer spending remains a striking feature of the post GFC period, contributing to the absence of material inflation pressures.
We assess that the current pace of consumer spending is likely unsustainable and anticipate a moderation in spending growth to around 2.5% for the 2018 year as a whole and to remain at this rate for 2019. Notably, consumer spending has also been supported by a moderation in the savings rate, declining from 4.0% a year ago to a relatively low 2.1% currently. The scope for a further run-down of the savings rate is now diminished.
On incomes, total labour income posted a solid 1.1% rise in the March quarter. This, along with upward revisions, lifted the trajectory for annual growth. At 5.1%yr it is now running at the fastest pace since June 2012, although it is still half a per cent below the average over the last fifteen years. Labour income is showing a particularly sharp turnaround in the mining states, annual growth now tracking at just over 5% in both Qld and WA.
However, the key point is that strength in labour incomes is largely centred on the recent hiring burst, which has subsequently faded. Wages, as measured by average compensation of employees (non-farm) grew by only 1.6% over the year to be flat in real terms. Weakness in wages growth reflects, among other things, ongoing labour market slack.
Momentum shifts in jobs growth have been quite marked. An undershoot in 2016, associated with uncertainty around the Federal election, was followed by a hiring burst, in part a catch-up. Jobs growth of 3.5% in the year to the March quarter 2018, which is twice population growth, is unsustainable. Indeed, employment growth has subsequently slowed, to 1.3% annualised for the initial four months of 2018 - for the full year we expect jobs growth of around 1.8%.
As to home building activity, this contracted by 5.0% in 2017, consistent with the decline in dwelling approvals from the historic highs of 2016, largely centred on high rise projects. This downturn has further to run with the contraction accelerating into 2019 after a near-term consolidation over the first half of 2018 (home building actually made a small positive contribution to growth early in 2018). Large increases in new supply and a marked slowdown in sales to foreigners are weighing on the outlook for residential building.
Another consideration is the potential for heightened political uncertainty ahead of the next Federal election, due by mid-2019, which could see businesses delay spending and hiring.
In summary, key positives around pubic demand, business construction investment and exports will provide a solid base for overall economic activity during 2018. However, with weaknesses in consumer spending and housing we expect GDP growth to moderate to 2.7% in the year to December 2018 and then slip to a below trend 2.5% for December 2019.
The week that was
This week, the focus was Australian Q1 GDP. Albeit a little dated, the report provides an overview of the state of the Australian economy no other release can match.
The March quarter GDP outcome was stronger than the market had anticipated, with a gain of 1.0% for the three months to March leaving annual growth at an above-trend 3.1%. Full detail on our thinking can be found on the previous page.
Our first look at retail spending in Q2 (the April monthly retail sales survey) continued to point to underlying weakness in consumption. Sales in the month were a touch above the market expectation, but annual growth slowed to just 2.6%yr. By state, over the year, sales were robust NSW and Vic, but broadly flat in Qld and SA.
By sector, sales growth was also mixed, with clothing and department store sales remaining under pressure, while online trade and cafes & restaurants saw solid gains, along with basic food retail. If, as we anticipate, the soft consumer trend persists, then the RBA will be firmly on hold through both 2018 and 2019.
Finally for Australia, this week the balance of payments release offered a timely update on how we fund ourselves as a nation. The latest data from the ABS again highlight that, with portfolio and 'other' (deposits and loans) inflows largely offsetting each other over the past 15 months (to March 2018), direct investment has remained Australia's net funding source.
With the mining investment boom over, this inflow of capital shows strong foreign investor demand for existing assets in Australia across a wide array of industries. Being primarily equity based, it is therefore long-term in nature.
The strength of direct investment in recent years has been an 'x factor' for the currency, holding it at a higher level than interest rates and commodity prices would have by themselves. We anticipate this inflow of capital will slow going forward, but there is little evidence it will do so quickly.
Quickly on commodity prices' influence on the currency, coal prices remain elevated, but firmer met coal supply from China should weigh in time.
Lastly on the global economy, this week has continued to emphasise that resolving current trade tensions will be difficult and time consuming. Following our video update on Europe at the beginning of the week, European officials retaliated against the US' move on aluminium and steel. We wait to see if the US will exacerbate tensions or instead seek to negotiate.
As highlighted in the video, trade and political tensions make it increasingly likely that the region's true core issue (an absence of political reform) will remain entrenched and see growth slow materially through 2018 and 2019. The long-term growth potential of the region needs to be focused upon, not short-term instability.
In stark contrast, the US' domestic economy continues to fire. One example of this is the US' housing market where income growth; lower debt (relative to income); and still-low interest rates are providing a strong foundation for robust gains. The flip-side of continued price gains however is deteriorating affordability. This will see new construction split between single homes in the suburbs for owner occupiers and buildto- let developments in cities where (a lack of) affordability is most pressing. The home-ownership rate will therefore remain depressed.
Diverging growth prospects for Europe/US and a number of domestic challenges suggest greater caution is warranted in assessing the outlook for Asia as well. In the latest update, we have seen a continued slowing in growth momentum in advanced Asian PMIs.
Chart of the week: National accounts, spending overseas
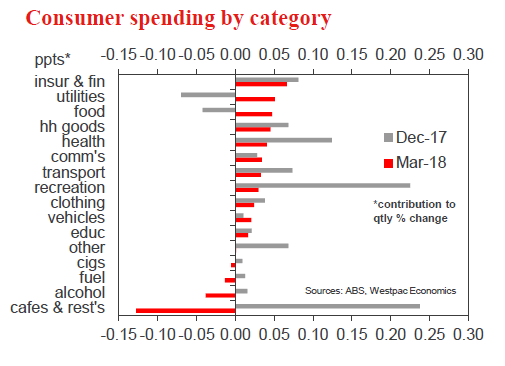
Consumer spending came in well below expectations for the quarter, rising just 0.3% vs our expectation of a 0.6% gain. Upward revisions to previous quarters partially offset with annual growth at 2.9%yr still close to our expected 3%.
A significant portion of the Q1 weakness appears to be due to a pull-back in spending by Australian tourists abroad. Consumption includes spending by Australians abroad and excludes domestic spending by non-residents in Australia. The detail from yesterday's Balance of Payments release showed outbound tourism spending fell 3.3% in real terms in Q1. Notably, two heavily tourism-affected items account for the lion's share of the Q4 slowdown – 'cafes & restaurants' and 'recreation' together accounting for 0.56ppts of the 0.68ppt turnaround.
It should also be noted that the contribution from net tourist spending has been a problem area for the ABS recently with technical changes seeing a particularly big revision last quarter.
New Zealand: week ahead & data wrap
In previous years, New Zealand was an outperformer on the global stage. Our solid rates of GDP growth encouraged high levels of net migration, and that in turn reinforced the strength in demand. More recently, however, we've seen the momentum in domestic activity fading, while conditions in other economies have firmed. We expect that the New Zealand economy will continue to underperform its peers for the next few years, and this will have important implications for both net migration and the NZ dollar.
With slowing GDP growth, New Zealand's position on the global stage is starting to slip
As we've been highlighting in recent weeks, New Zealand's economic cycle has now entered a more mature phase. Earlier in the decade, we were an outperformer on the global stage, with GDP growth running at rates of around 3.5% to 4% p.a. That was well ahead of what we were seeing in other developed economies, including Australia and the US.
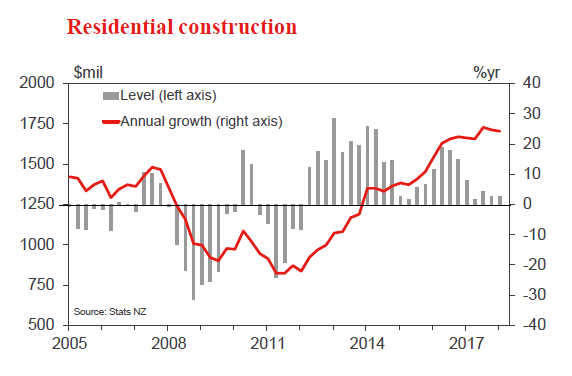
Earlier drivers of growth, which included house prices and construction activity, have now moved into new phases and are providing less of a boost to economic activity than they once did. This has already seen annual GDP growth cool to 2.9% at the end of last year. And recent updates on economic activity indicate that growth has continued to soften in the early part of 2018. Notably, retail spending was softer than expected in the March quarter, rising by only 0.1%. On top of that, construction activity fell by 0.9% in the March quarter and has essentially been flat for around three quarters now. Underlying this softness in construction, home building has been trending broadly sideways since mid-2016. That pre-dates any uncertainty associated with the change in Government, and highlights the brake that capacity constraints and difficulties accessing finance are having on building activity, regardless of the large pipeline of work that is planned.
Putting it altogether, it now looks like GDP growth in the March quarter could be around 0.5% or even a little lower. That would pull annual GDP growth down to around 2.8%, which would be the slowest pace since 2014.
Softening GDP growth will be reinforced by a slowdown in net migration …
The slowdown in GDP growth has seen New Zealand's position on the global stage slipping from 'rock star' to 'support act', as growth in other developed economies has lifted. In particular, we're now underperforming the Australian economy, where GDP grew by 1% in the March quarter, to be up 3.1% over the past year.
The changes in New Zealand's relative standing in the global economy will have some important implications. One key area that will be affected is net migration. In recent years, our favourable economic conditions and jobs growth made New Zealand a very attractive destination. That saw a strong lift in new arrivals to the country. It also encouraged larger-thanusual numbers of New Zealanders to remain onshore or come back from abroad (especially from Australia). Combined, those factors saw annual net migration rise to a record high of 72,000 in mid-2017, and pushed the rate of overall population growth above 2% p.a. That provided a powerful boost to demand and our productive capacity, reinforcing the other factors that were supporting growth.
Net migration has been softening in recent months, slowing to a still elevated level of 67,000 in the year to April. We expect that it will slow substantially more over the next few years, as the New Zealand economy starts to lag its peers like Australia and the US. This will exacerbate the more general softening in economic growth, with smaller additions to our demand base, as well as reducing the degree of pressure on new home building (at least outside of Auckland).
…however, a lower NZ dollar will provide a buffer
The other area where the New Zealand economy's underperformance will really matter is the exchange rate. In recent years, strong economic conditions saw the Kiwi soaring to 88 cents against the US dollar, and at one stage we flirted with parity relative to the Australian dollar.
The NZD/USD is now back around US$0.70, and we expect it will fall to around US$0.64 over the coming year. Strengthening US conditions are likely to see the Fed continuing to gradually hike the Federal Funds Rate, while softening economic conditions in New Zealand will keep the RBNZ on the sideline for some time yet.
The Kiwi has also lost some altitude against its Aussie counterpart, and is now down around AU$0.92. With the RBA expected to remain on hold for even longer than the RBNZ, we see less downside on this front. Nevertheless, with Australia's relatively firmer economic outlook, we expect the NZD/AUD cross rate will ease back to around AU$0.90 by the start of next year.
The depreciation of the NZ dollar over the coming year will provide a buffer for the economy, boosting export returns and cushioning the effects of slowing activity in other parts of the economy.
Data Previews
Aus Apr housing finance (no.)
- Jun 12, Last: –2.2%, WBC f/c: –3.0%
- Mkt f/c: -1.8%, Range: -3.0% to -0.5%
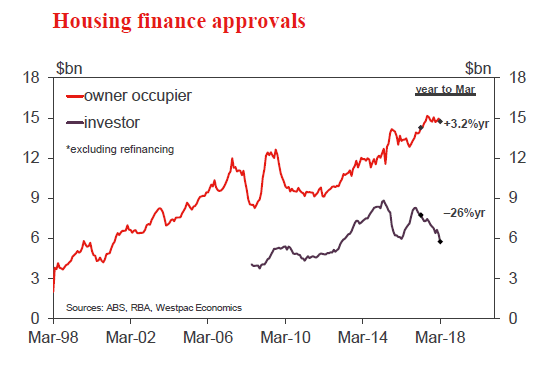
After holding relatively steady through most of 2017 and early 2018, Australian housing finance approvals showed a notable pull back in March. The total number of owner occupier approvals declined 2.2% to be down 3.5%yr but the real weakness was around the value of investor approvals which dropped 9%mth to be down 16.1%yr (estimates of investor approvals ex refi look to be down over 30% from their 2016 peak). Combined, the total value of approvals ex refi fell 4.6%mth to be down 6%yr.
Industry figures suggest owner occupier approvals declined again in April – we expect the official figures to show a 3.0% drop. Housing markets remained soft but stable through the month. More recent data suggests the Sydney and Melbourne markets have seen a further deterioration through May and early June, likely relating to tightening lending standards.
Aus Q2 AusChamber-Westpac survey of Industrial Trends
- Jun 12, Last: 58.3
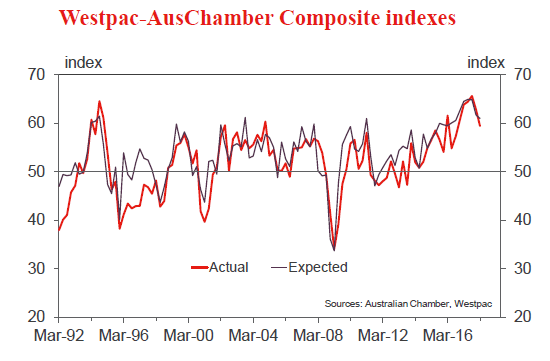
The Australian Chamber-Westpac survey of the manufacturing sector provides a timely update on conditions in the sector and insights into economy-wide trends. The Actual Composite tracks a range of demand related measures including investment and employment. The Q2 survey was conducted after the Federal budget during May and the start of June.
In Q1, the Actual Composite moderated to 58.3 from 63.4 in Q4, after an uptrend to 65.7 in September 2018 from a base in June 2015 of 55.1. Strength is centred on a lift in new orders and output as well as increased overtime and an uplift in employment.
Manufacturing is benefitting from a rise in public infrastructure, non-mining business investment, and above par world growth with a relatively low AUD. However, against this are moderate consumption constrained by slow wage growth and the fading of the homebuilding boom.
Aus Jun Westpac-MI Consumer Sentiment
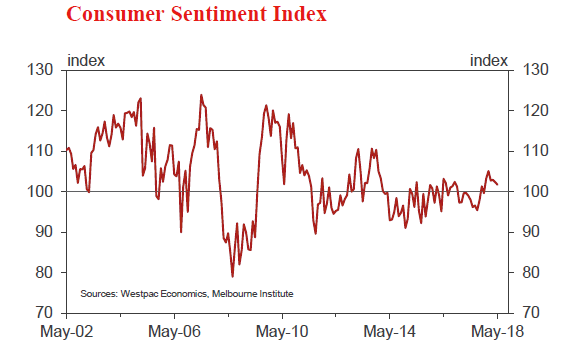
- Jun 13 Last: 101.8
After a promising start, sentiment has drifted lower as the year has progressed. The index slipped to 101.8 in May despite what appeared to be a relatively well-received Federal Budget that included the announcement of personal income tax cuts. While it is still above 100, indicating that optimists outnumber pessimists, the sentiment index is well below the 105–115 levels typically associated with a robust consumer. Family finances remain a clear area of weakness.
The June survey is in the field from June 4-9. Factors that may influence this month include: a strong March quarter GDP result with growth lifting above 3%; continued slippage in dwelling prices, now down 1.1%yr nationally; a further rise in petrol prices, average pump prices hitting $1.53/ litre nationally in early June, up over 20c since mid-March. Financial markets were subdued, the ASX retracing 1% after a 5.7% surge last month and the AUD down over 1c vs the USD.
Aus May Labour Force - total employment '000
- June 14, Last 22.6k, WBC f/c: 17k
- Mkt f/c: 19k, Range: 8k to 32k
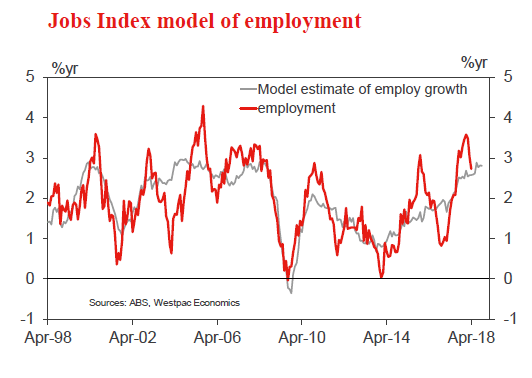
Employment rose 22.6k in April beating both the market (20k) and Westpac's (17k) expectations. Full-time employment rose by 32.7k while part-time fell 10.0k. Past employment results were revised with March now –0.7k (was +4.9k) and February is now –7.4k (was reported as –6.3k last month and originally reported as +17.5k).
The three month average gain in April was just 4.9k compared to an average of 27.7k for the previous year. Momentum in employment stalled in early 2018 and annual employment growth dipped to 2.7%yr from a January peak of 3.6%yr. The six month annualised pace is now 2.5% while the four month annualised pace is just 1.3%yr.
The leading indicators are still pointing to sound monthly employment prints as is estimates of population growth. However, due to base effects our forecast +17k gain in employment has the annual pace dipping to 2.6%yr.
Aus May Labour Force - unemployment rate %
- June 14, Last 5.6%, WBC f/c: 5.5%
- Mkt f/c: 5.6%, Range: 5.4% to 5.6%
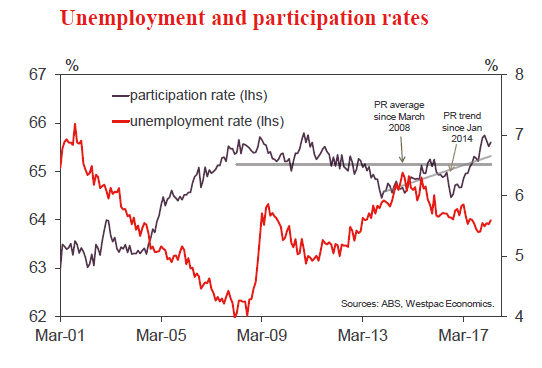
Despite a sound print on employment in April the unemployment rate rose to 5.6%, (5.60% at two decimal places) a full percentage point on 5.5% in March (5.53% at two decimal places). This jump was due to a 33.2k lift in the labour force with participation bouncing to 65.61%.
The strength in female participation has been driving the overall lift in participation. However, it is the weakness in male employment, given the recent strength male participation, that is behind the lift in unemployment.
We are forecasting a flat participation rate for May which means that after rounding, the forecast +17k in employment is enough to lower the unemployment rate to 5.5%.
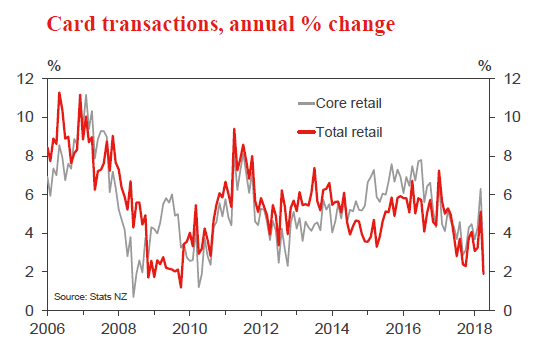
NZ May retail card spending
- Jun 12 Last -2.2%, WBC f/c: +1.6%
Retail card spending fell by 2.2% in April. That followed a large gain in the previous month, which may have been affected by the timing of the Easter holiday. Nevertheless, the size of the April fall was surprising. Looking at the broader trend in spending, it looks like after a solid start to the year, some of the momentum in spending is fading.
We expect that spending will rise by 1.6% in May as earlier volatility fades. Nominal spending levels will also be boosted by increases in fuel prices.
Spending continues to be supported by strong population growth and low interest rates. However, this strength will be challenged later this year by the slowdown in the housing market that is underway.
NZ May REINZ house sales and prices
- Expected in the week beginning Jun 12
- Sales last: –3.3%, Prices last: 3.8%yr
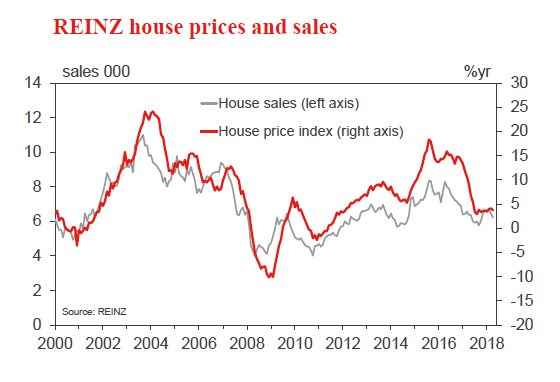
House sales fell 3.3% in April after a similar sized decline in March. House price inflation also softened, slowing to an annual rate of 3.8% - that's well down on what we saw in recent years. The weakness in April was most pronounced in the upper North Island – Northland, Auckland, Waikato and Tauranga. In these regions, which account for about half of New Zealand's population, both house prices and house sales fell noticeably.
We expect the housing market to slow further over the rest of this year as the new Government rolls out a range of policies aimed at cooling housing speculation. The first of these changes came at the end of March, when the bright– line test for taxing capital gains on investment properties was extended from two to five years.
US Jun FOMC meeting
- Jun 13–14, last 1.625%, WBC 1.875%
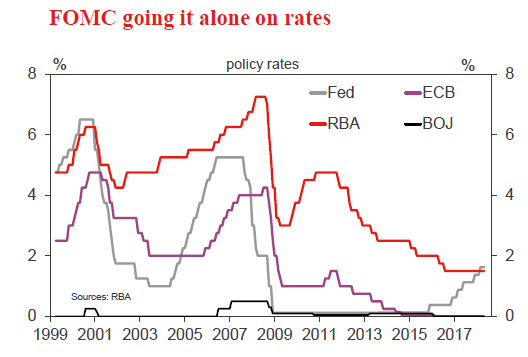
Based on market pricing, the June FOMC decision is as certain as they come, with all anticipating a further 25bp increase in the fed funds range, to a mid-point of 1.875%.
While trade and political uncertainty has swirled across the globe this month, the focus of the Committee remains the domestic US economy. There, there is strong cause for another step in the normalisation of policy. To put it simply, employment growth is strong; residual slack in the labour market low; inflation is near target; and wage gains are (finally) showing some momentum. Adding the anticipated positive influence of fiscal policy through 2018 and 2019, the US economy should remain in strong shape, and capable of digesting further hikes.
Post decision, all eyes will be on the forecasts and press conference. Our expectation is gradual will remain the operative word, in line with recent communication.
US Jun ECB meeting
- Jun 14, deposit rate, last –0.40%, WBC –0.40%
These are certainly interesting times for Europe. The past month has shown that the region's political instability is certainly not behind it. In addition, in early 2018, the economy has looked decidedly more fragile than anticipated.
For policy makers, this calls for restraint. The awkward point however is that this is all occurring at a time when the market is desperate for guidance on the ECB's intended tightening of policy: first an end to the asset purchase program; then, at some stage, a rate hike(s).
Recent comments by Council members imply discussions will be had at the June meeting, though (as evinced by the past) this does not mean detail will soon be forthcoming to the public. Look for loose guidance on the path forward at this press conference, followed by a concrete plan by September.