

Sample Category Title
EURUSD Multiple Bullish Patterns For Uptrend Continuation
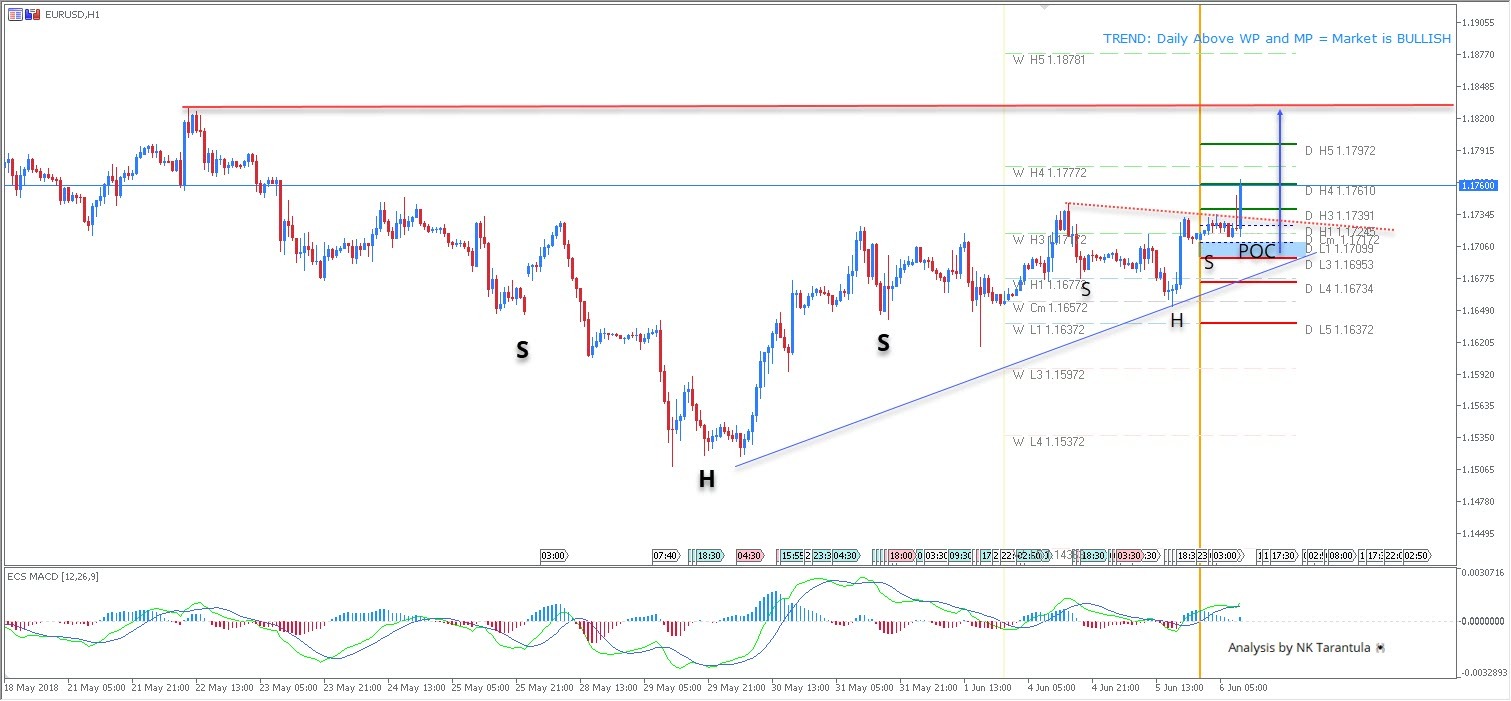
The EUR/USD was sold on rallies and bought on dips as I predicted in the FXStreet poll. Yesterday’s drop to 1.1650 has been bought, and the market is bullish right now. We can see a huge inverted head and shoulders coupled with a smaller pattern that has formed today. 1.1700-10 is the POC bouncing zone if we see a retracement. A 4h close or 1h momentum above the red dotted line ( Inv. Head and Shoulders breakout) – 1.1740 should provide a continuation towards 1.1765, 1.1792 and eventually 1.1820.
W L3 - Weekly Camarilla Pivot (Weekly Interim Support)
W H3 - Weekly Camarilla Pivot (Weekly Interim Resistance)
W H4 - Weekly Camarilla Pivot (Strong Weekly Resistance)
D H4 - Daily Camarilla Pivot (Very StrongDaily Resistance)
DL3 – Daily Camarilla Pivot (Daily Support)
DL4 – Daily H4 Camarilla (Very Strong Daily Support)
POC - Point Of Confluence (The zone where we expect price to react aka entry zone)
EURUSD Analysis: Should Remain Stable Today
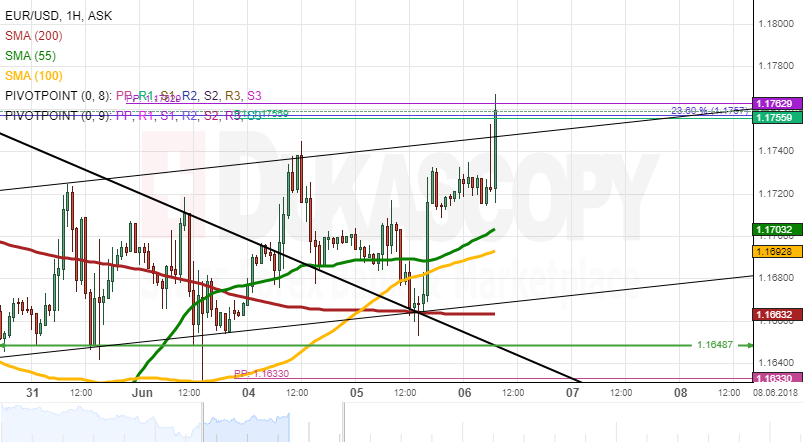
The common European currency was guided lower mid-Tuesday where it was stopped by the strong support of the 200-hour SMA and a junior channel circa 1.660.
A significant bullish boost to this currency was seemingly provided by the inaugural speech of the new Italian PM as a result of which the pair surged 62 pips within three hours. Its subsequent movement was sideways limited from above by the 100-period (4H) SMA at 1.172.
The rate still shows some potential up to the junior channel line, the monthly PP and the weekly R1 at 1.1760. Given that no significant data releases are scheduled, the Euro should maintain its current trading range in the junior pattern, with the upper boundary being the 1.1760 mark and the lower one—the 200-hour and 55-period (4H) SMAs circa 1.1665.
GBPUSD Analysis: Tests Weekly R1
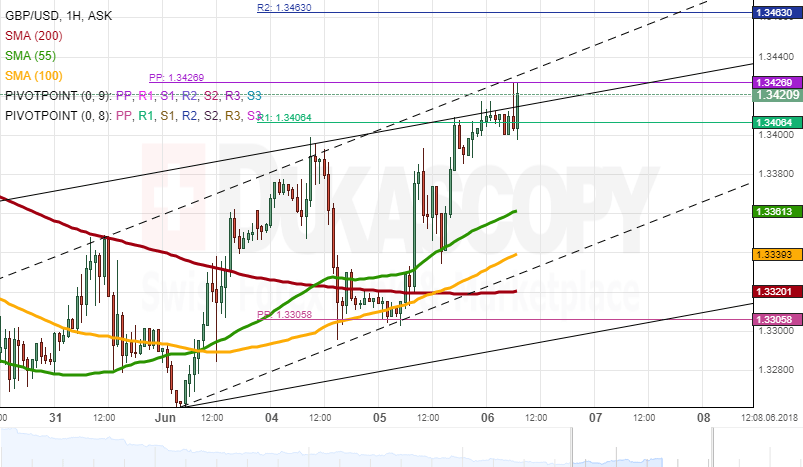
Strong upside risks prevailed on Tuesday, thus sending the Sterling 96 pips higher against the US Dollar. A notable hourly boost of 0.39% was provided by solid British Services PMI released early in the session. The pair subsequently found resistance at the 55-hour SMA and resumed its movement upwards, thus being located at the weekly R1 early today.
As apparent on the 4H chart, the Pound has surpassed the 100-period SMA which might provide additional support to the rate. Technical indicators show that some upside potential should be realised within the following trading hours, setting the weekly R2 at 1.3465 as a probable northern target.
The overall market sentiment for today remains bearish, with the Sterling approaching the 200-hour SMA and the weekly PP circa 1.3320.
USDJPY Analysis: Reaches For Strong Resistance At 110.20
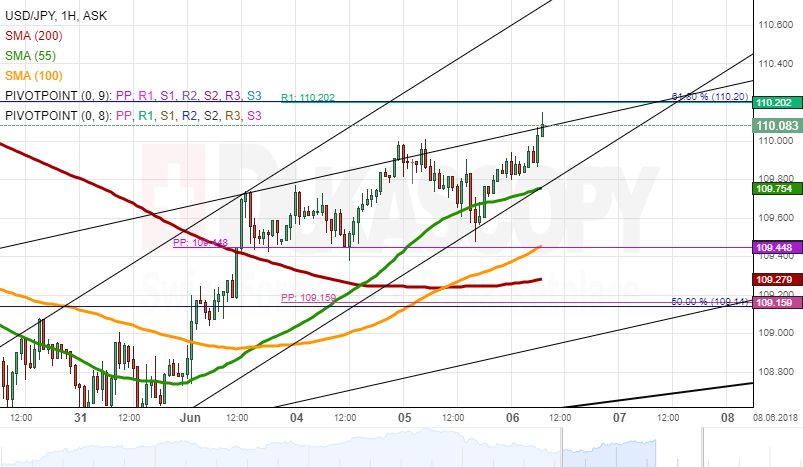
The US Dollar was trading sideways against the Yen for the second consecutive session on Tuesday. Its attempt to move below the 109.50 mark was restricted by the combined support of the 55-hour SMA and the monthly PP. As a result, the pair was once again pushed to the upside.
The rate had reached the psychological 110.00 level by Wednesday morning. Technical indicators flash bullish signals for this session. This likelihood of this scenario is also strengthened by the fact that the Greenback surpassed the 100-period (4H) SMA early in the morning which could provide additional support. However, the 200-day SMA and the weekly R1 are located at 110.20, so gains could be limited today.
In terms of downside potential, the pair might fall until the 100– and 200-hour SMAs and the weekly PP at 109.20.
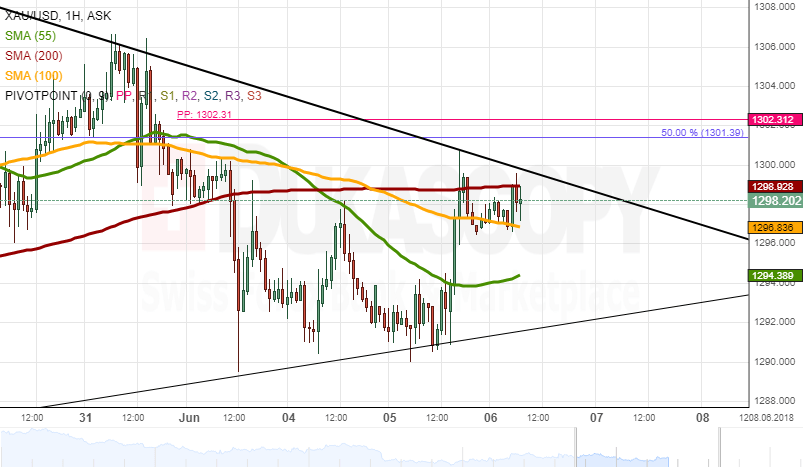
Gold Analysis: Tries To Overcome 1,300.00
Following a rather calm Tuesday morning, bulls started to dominate Gold later in the session, thus dashing through the 55– and 100-hour SMAs. This bullish momentum halted shortly after at the 200-hour moving average located near 1,300.00.
This line which has proved to be a strong resistance level this week was breached early today. In case the pair manages to remain above this long-term SMA, it is likely that the rate continues to strengthen until the 200-period (4H) SMA located near 1,310.00.
Conversely, a failure to surpass above this psychological level should trigger sellers and result in a decline. A possible southern target is the 61.80% Fibo retracement at 1,285.00.
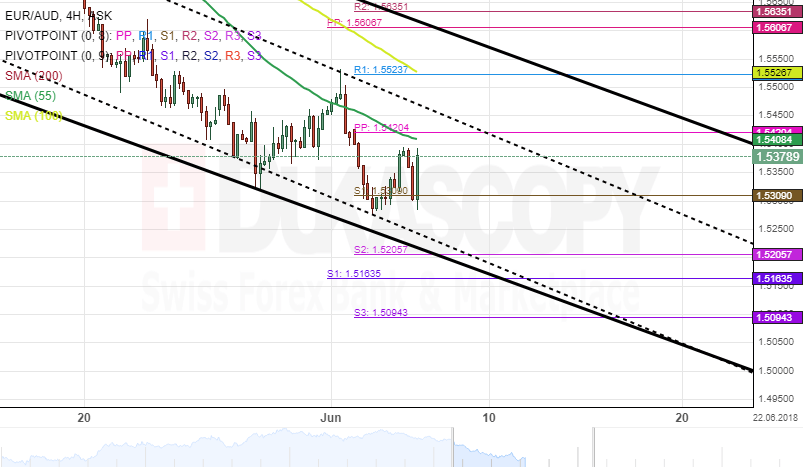
EUR/AUD 4H Chart: Bearish Sentiment This Week
The movement of the single European currency against the Australian Dollar has been steered by two descending channels. The most recent pattern was formed on May 18.
After testing the upper boundary of the junior channel and the weekly resistance level at 1.55, the exchange rate continues its southern journey. Also, the 55– hour simple moving average has guided the pair lower.
Everything being equal, the EUR/AUD currency exchange rate could continue it bearish sentiment during the following trading sessions. Meanwhile, technical indicators demonstrate that bear is likely to grow strong through the end of this week.
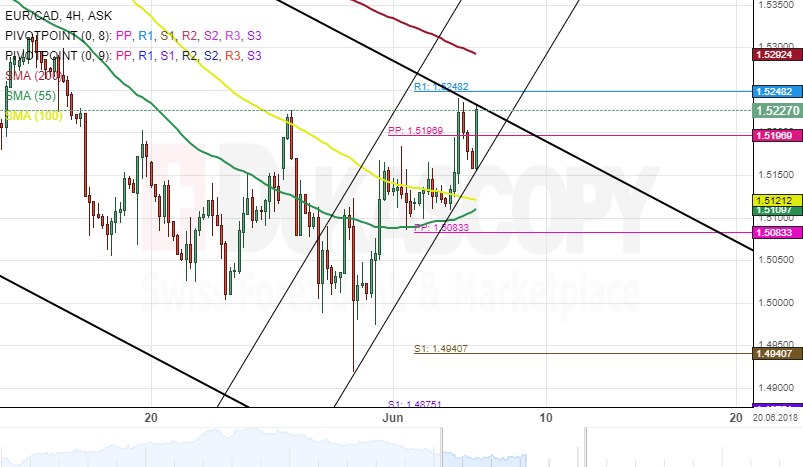
EUR/CAD 4H Chart: Two Scenarios Likely
The Eurozone single currency movement against the Canadian Dollar has been constrained by an eight-week descending pattern. The pair made a U-turn south after hitting the upper boundary of a channel down on March 20.
During the past one week, the exchange rate has developed a new junior ascending channel. Furthermore, the pair has breached both the 55– and 100– hour simple moving averages near 1.51.
Two scenarios are likely to take place within the following trading session. First, the currency exchange rate could decline and find support at the 55– hour SMA.
Second, the EUR/CAD currency pair might reverse from the aforementioned support and gather enough momentum to break out through the upper boundary of the dominant channel.
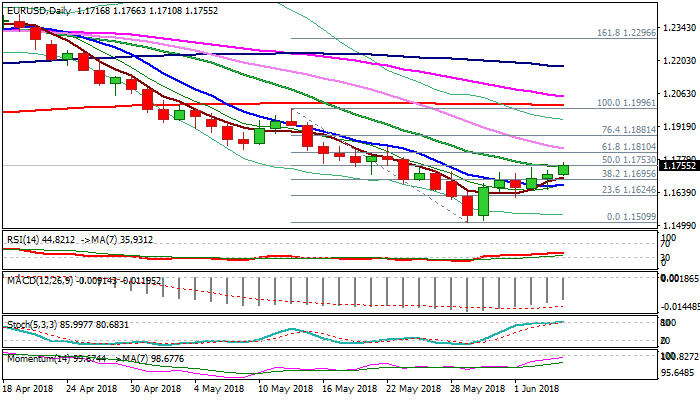
EURUSD Outlook: Holds Bullish Bias And Probes Above Key Fibo/20SMA Barrier
The Euro stands at the front foot and accelerates higher in early European trading, following narrow consolidation in Asia. Bulls remain in play after Tuesday's dip to 1.1652 proved short-lived as probe through key barrier at 1.1753 (falling 20SMA/50$% retracement of 1.1996/1.1509) maintains bullish bias. Strong momentum studies also support the advance. Sustained break above 1.1753 pivot would open next key barrier at 1.1810 (Fibo 61.8%), reinforced by falling 30SMA (1.1827). Doji reversal pattern is forming on weekly chart and could further boost recovery rally from 1.1509 (29 May low). Rising 5SMA (1.1705) underpins today's action and marks solid support which is expected to hold and guard lower pivot at 1.1675 (10SMA).
Res: 1.1776, 1.1810, 1.1827, 1.1881
Sup: 1.1705, 1.1681, 1.1671, 1.1652
US Treasury Secretary Mnuchin Urges President Trump To Exempt Canada From Tariffs
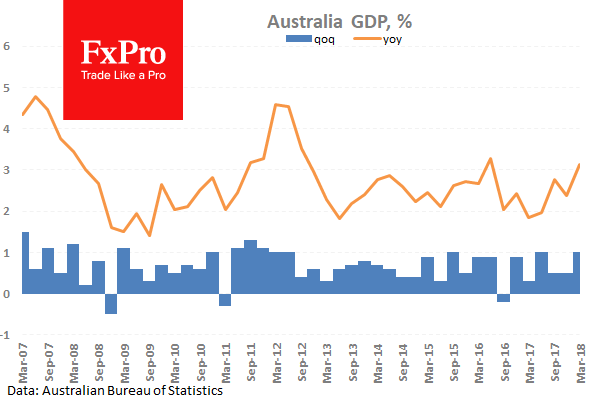
The news broke overnight that Steve Mnuchin had urged the President to give Canada an exemption from the Steel and Aluminium tariffs. USDCAD had already sold off from its high of 1.30657 but extended the move and is now trading around 1.29300. Whether Canada gets a pass or not remains to be seen but traders have piled in on the move, with any headlines to the contrary potentially setting up a short squeeze. Australian GDP was released this morning with a beat of 1.0% against 0.9% (QoQ)(Q1) expected. The 1.0% level has been the top of the range in recent years. AUDUSD climbed from 0.76332 to 0.76720 and is now just down off the highs.
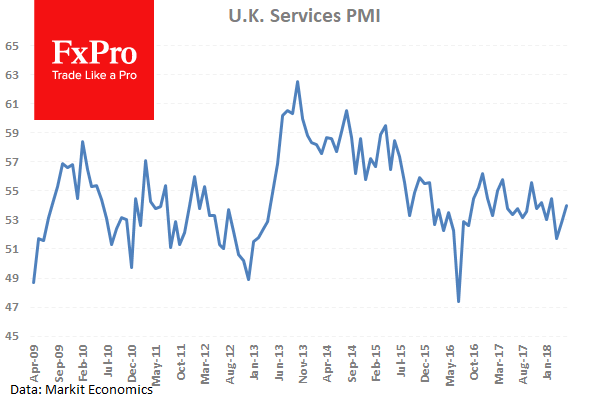
UK Markit Services PMI (May) came in at 54.0 against an expected 53.0 from 52.8 previously. This data is down from its 2013 high of 62.5 but it has bounced from 53.0, which was somewhat of a floor for the last 18 months. The number beat the consensus as expected to move back into this range above 53.0 showing modest growth. GBPUSD moved higher from 1.33341 to 1.33921 following the data release.
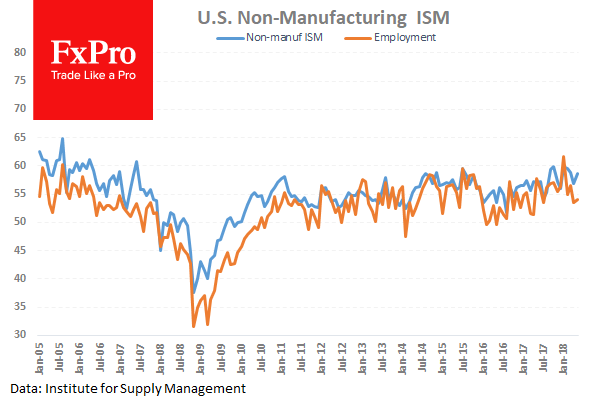
US ISM Non – Manufacturing PMI (May) was 58.6 versus an expected 57.5 against 56.8 previously. This is still in the upper range of the data releases we have seen over the past seven years but off the highs reached before the financial crisis above 65.0. The recent data shows a beat on expectations which was above the previous reading suggesting an increase in demand going forward. EURUSD fell from 1.16672 to 1.16523 following this data release.
Global Dairy Trade Price Index was released coming in at -1.3% with a previous reading of 1.9%. This was the most negative reading since December 2017 Prices have traded around the zero level since the high of 5.9% in January. NZDUSD moved higher from 0.70037 to finish the day at 0.70344 after this data release.
EURUSD is up 0.05% overnight, trading around 1.17225.
USDJPY is up 0.11% in the early session, trading at around 109.896
GBPUSD is up 0.12% this morning trading around 1.34105.
Gold is up 0.18% in early morning trading at around $1,298.67
WTI is up 0.64% this morning, trading around $65.92
US Labour Costs Expected To Increase As Productivity Declines
At 10:40 GMT, UK MPC Member Tenreyro is due to deliver a speech titled “Productivity Matters: What is the state of trade?” at the Confederation of British Industry Economic Briefing, in Belfast. Audience questions are expected to follow. This event can result in moves in GBP crosses from any comments made.
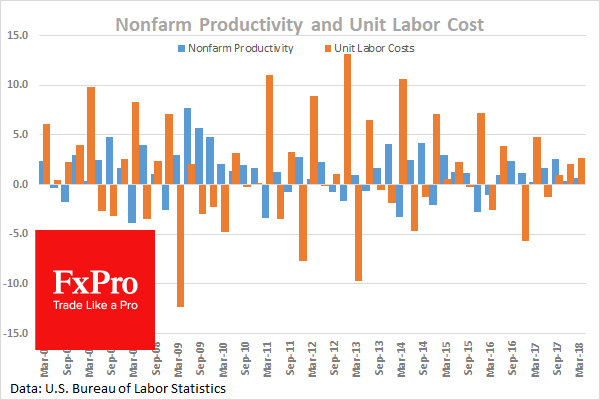
At 12:30 GMT, US Nonfarm Productivity (Q1) is expected to be in at 0.6% against 0.7% previously, showing efficiency slipping and ultimately upward pressure on inflation. Unit Labour Costs (Q1) is expected to be 2.8% against 2.7% prior, showing what has become a seasonal increase expected in this metric but these cost can be passed onto consumers. There is growing evidence, albeit anecdotal that labour costs are increasing as workers are becoming harder to find.
Trade Balance (Apr) is expected to be $-49.0B against a previous $-49.0B, rebounding off the low levels, at -57.6%, not previously seen since 2008. USD crosses can see an increase in volatility from this data release. 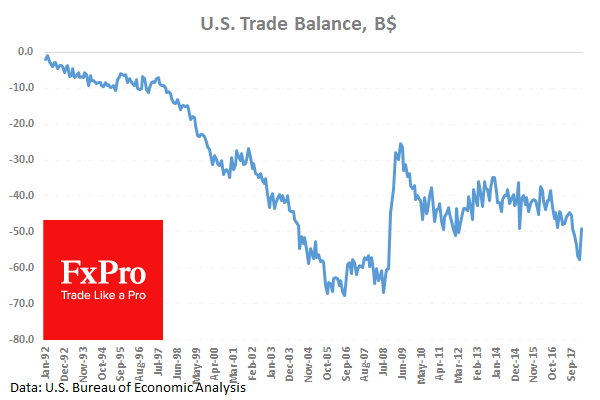
At 12:30 GMT, Canadian International Merchandise Trade (Apr) is expected to be $-3.40B against $-4.14B previously. This fell to match the low of November 2016 last month and it is expected to come in off the lows today but still at very low levels. CAD traders will be closely watching this data release. 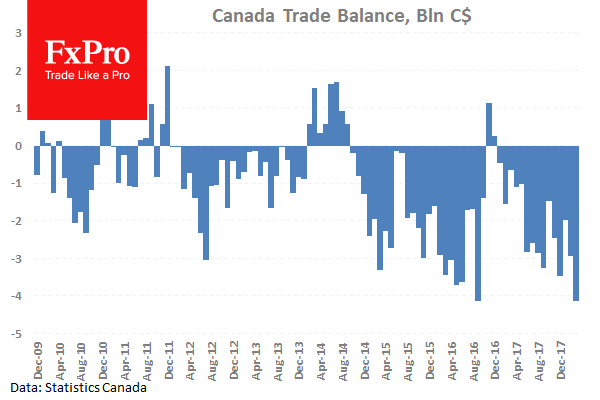
At 14:00 GMT, Canadian Ivey Purchasing Managers Index s.a. (May) is expected to be 69.7 against a previous 71.5. Ivey Purchasing Managers Index (May) was 70.4 previously. The data is expected to come in under last month’s reading which was the highest since 2011 and greatly exceeded expectations. This data is showing robust growth, continuing one of the longest positive runs with over 20 months above 50.0. CAD crosses can be moved by this data release.
At 16:00 GMT, UK MPC Member McCafferty is expected to deliver a speech discussing the economic outlook and monetary policy in a phone-in interview conducted by Iain Dale on LBC Radio. Audience questions expected. GBP crosses may be affected by any comments made.
At 22:30 GMT, Australian AIG Construction Index will be released with a previous reading of 55.4 which is down from the April reading of 57.2. This data has been above 50 for fifteen consecutive months showing the strong run ongoing in the sector. AUD pairs can be influence by this data release.