Sample Category Title
European Commission Vice Sefcovic: Retaliation duties on US goods will start in July
European Commission Vice President for energy Maros Sefcovic said the commission expects to conclude the "relevant coordination" with member stats regarding the retaliation tariffs to the US in June. The new duties on US imports to EU would start applying in July.
Sefcovic declared earlier this week to make the bid to succeed Jean-Claude Juncker as President in late 2019.
Japan PM Abe: G7 should play a role in free and fair global economic development
Japan Prime Minister Shinzo Abe warned today that "no country benefits from retaliatory trade restrictions." And, ahead of the G7 leaders summit on June 8-9, Abe said "my message is G7 should play a role in free and fair global economic development."
Separately, Abe said that ahead of the Kim-Trump summit in Singapore on June 12, he will meet Trump to "coordinate in order to advance progress on the nuclear issue, missiles and - most importantly - the abductees issue." A sticky point is that upon declaring peace in the Korean peninsula, UK could eventually have to reduce military forces in South Korea. And Japan's constitution, diplomatic policies and national security policies all will have to be totally reviewed for the completely new situation.
GBPUSD Outlook – Bulls Eye Barriers At 1.3459/80
Cable continues to head north on Wednesday and extends previous day’s strong rally. Fresh advance broke through pivots at 1.3405 (20SMA) and 1.3410 (50% retracement of 1.3617/1.3204).
Bulls are supported by stronger Euro and soft-Brexit hopes, with 5/10SMA underpinning the advance.
Break above 20SMA opens targets at 1.3459 (Fibo 61.8%) and 1.3480 (falling 30SMA).
On the other side, bulls may show signs of fatigue as momentum is losing traction and slow stochastic turns sideways at the boundary of overbought territory, while falling daily Kijun-sen caps the rally for now.
Consolidation should hold above solid supports at 1.3362/51 zone (broken Fibo 38.2% of 1.3617/1.3204 / rising 5SMA) to keep bullish bias intact.
Res: 1.3429, 1.3459, 1.3482, 1.3520
Sup: 1.3384, 1.3362, 1.3351, 1.3302
EURJPY Rises To 2-Week High, Looks Strongly Bullish
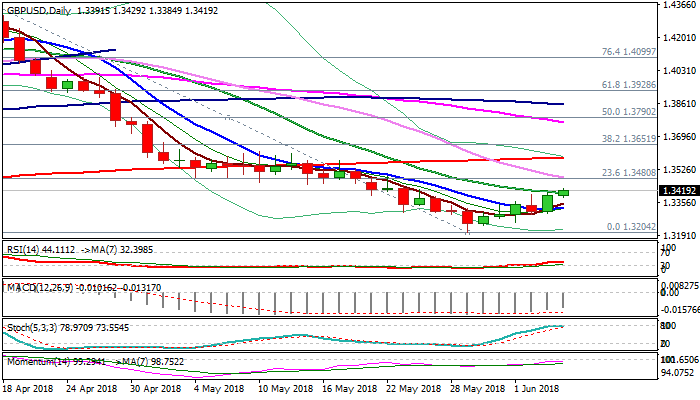
EURJPY has been recording a stunning rally over the last five days, creating a new two-week high of 129.57. The sharp buying interest has shifted the near-term bias from negative to positive. Also, the momentum indicators are supportive of the bullish picture.
From the technical point of view, the MACD oscillator completed a bullish cross with the trigger line with strong momentum, while the Relative Strength Index (RSI) is approaching the overbought zone and is sloping upwards.
The price is developing slightly below the 129.50 resistance level, taken from the low on May 16 and in case of a jump above this region it could drive the pair towards the 130.30 barrier, 100 pips above the current market price. Further gains could increase the positive momentum and open the way for the 131.37 resistance hurdle.
A move to the downside may meet support around the 20-simple moving average (SMA), 128.20 in the 4-hour chart. Immediate support for further declines may be taking place at 127.15.
The short-term picture is looking predominantly bullish at the moment, with price action taking place above the 20- and 40-SMAs lines after the rebound on the 124.60 barrier.
G7 And Trade War Under Focus | Oil Off Its Low
Bargain hunters have attacked the oil market and this has pushed the oil price higher. Having said this, the price is still moving close enough to the the previous day’s trading sessions. In order for us to declare that we have formed a bottom, the price needs to show more strength and it needs to break above the $68 mark for the WTI.
OPEC could increase the supply as the US has requested the cartel to loosen up the tap a little. However, the US inventory stockpiles continue to support the oil price to some extent and it shows that there is no glut. The US trade inventory data released yesterday showed that the US inventories have fallen by2%.
Global trade war is the only factor providing the support for the gold price. Retaliation was the very act which traders had in their mind, a direct consequence of Trump’s action. Mexico introduced tariffs on US steel, bourbon and pork. If Trump doesn’t soften his stance towards North American Free trade agreement, the situation would only get worse and this could provide the support for the gold price.
The other aspect where the gold price would see some impact is the upcoming Fed meeting during which it is expected that the Fed would hike the rate again. Strength in the dollar index could push the gold price back toward the 1280 mark.
As for the equity market, we may continue to move higher but caution is the main word amid investors. The focus remain towards the upcoming G7 meeting where trade-war would be the most debated topic. This is a war created by Donald Trump, the president of the United States. Mr Trump is of the mind frame that by putting this kind of pressure on other countries can get him the desired outcome. This may be true to a certain extent because there appears to be some sign that China has agreed to buy US agriculture and energy products worth more than $70 billion under a condition that no extra tariffs would be implemented.
Italian bond yield have suffered once gain and the spread between the German and Italian two year bond yield has taken off again coz the new new Prime Minister of Italy has pledged to push the agenda of the populist parties forward.
Forex Technical Analysis: EUR/USD, USD/JPY, GBP/USD
EUR/USD
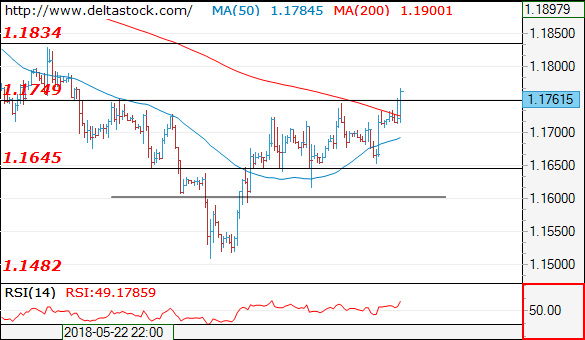
Current level - 1.1761
My outlook remains positive, for a tight test of 1.1830 area. Initial minor support lies at 1.1710, followed by the crucial low at 1.1650.
| Resistance | Support | ||
| intraday | intraweek | intraday | intraweek |
| 1.1830 | 1.1830 | 1.1710 | 1.1480 |
| 1.1830 | 1.2060 | 1.1650 | 1.1300 |
 USD/JPY
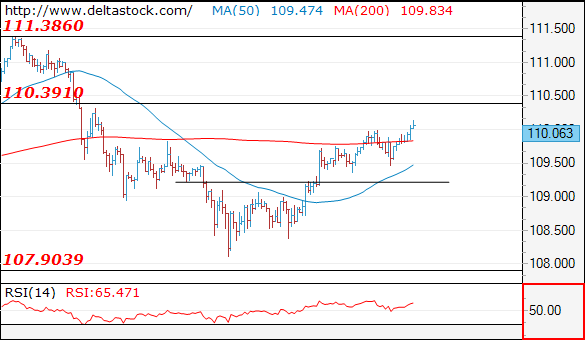
Current level - 110.06
The uptrend is intact, heading towards 110.40 zone. Crucial on the downside is 109.45 low.
| Resistance | Support | ||
| intraday | intraweek | intraday | intraweek |
| 110.40 | 111.40 | 109.45 | 107.80 |
| 111.40 | 114.40 | 108.40 | 106.70 |
GBP/USD
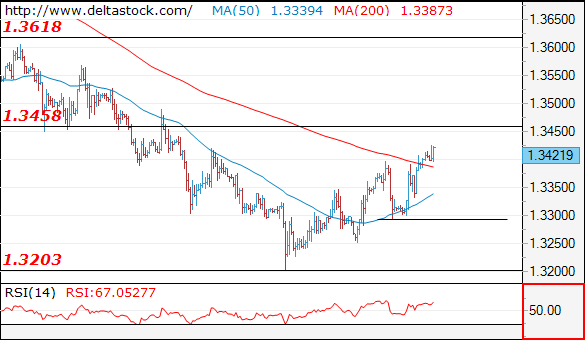
Current level - 1.3421
The bias is positive above 1.3380, for a test of 1.3460 area. Crucial on the downside is 1.3290 low.
| Resistance | Support | ||
| intraday | intraweek | intraday | intraweek |
| 1.3460 | 1.3618 | 1.3380 | 1.3210 |
| 1.3460 | 1.3990 | 1.3290 | 1.3040 |
Bitcoin Slight Decrease
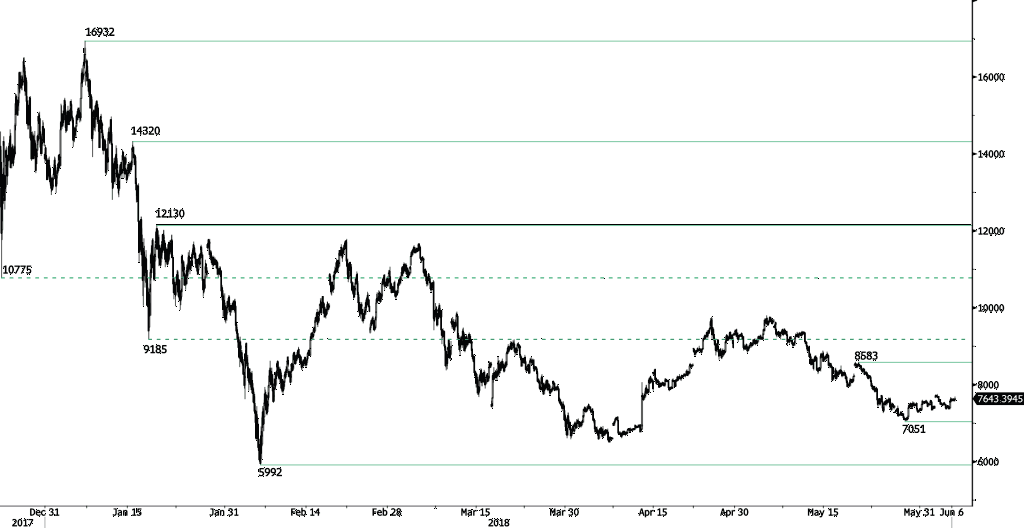
Bitcoin is slightly decreasing following recent bounce from 7360 low. The pair is currently trading along 7600, heading along 7540. The pair is further contained between support and resistance given at 7051 (29/05/2018 low) and 8583 (21/05/2018 high). The technical structure suggests short-term decrease.
In the long-term, the digital currency has had an exponential growth but also presented important downturns. There is decent likelihood that the currency could stabilize between 7'000 - 12'000 in 2018. Bitcoin is trading below its 200 DMA (8800 range).
AUD/USD Strong Bounce
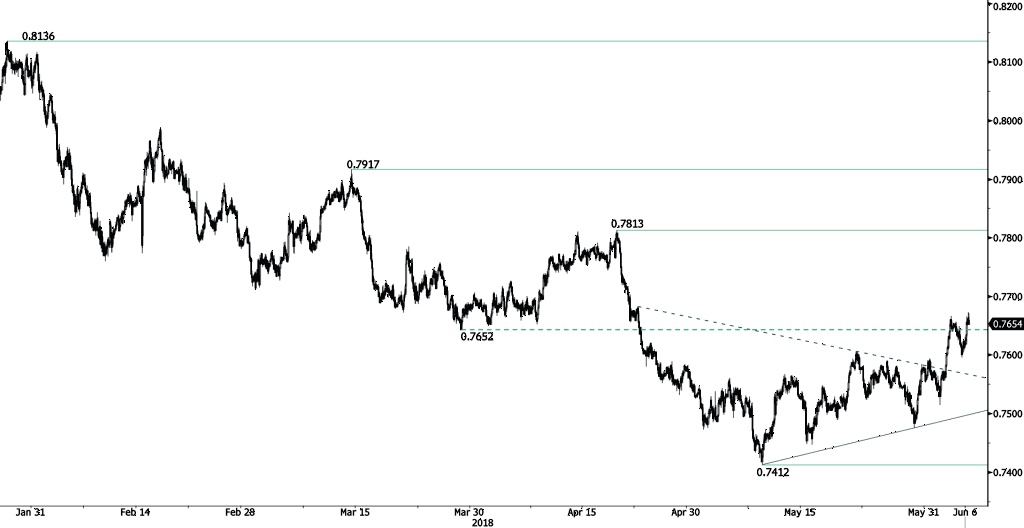
AUD/USD strong bounce from 0.7595 low continues, currently trading along 0.7650 and approaching the 0.7675 range. A break of the strong resistance at 0.7917 (14/03/2018 high) is needed to invalidate the current short-term bearish bias. Hourly support remains at 0.7412 (09/05/2018 low). The technical structure suggests short-term upward moves.
In the long-term, the upward trend slows down after failing to reach key resistance at 0.8164 (14/05/2015 low). Key support stands at 0.6011 (28/10/2008 low). A break of the key resistance at 0.8164 (14/05/2015 high) is needed to invalidate our long-term bearish view.
USD/CAD Bearish Breakout
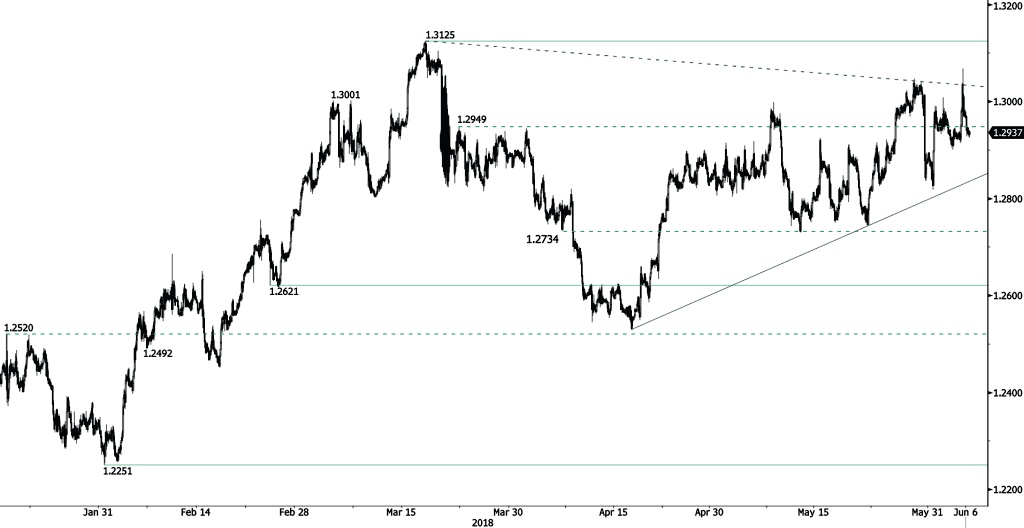
USD/CAD selling pressures continue after reaching 1.3067, trading below 1.30 and heading along 1.2924. Hourly support and resistance are located at 1.2621 (23/02/2018 low) and 1.3125 (19/03/2018 high). The technical structure suggests short-term decrease.
In the longer term, the pair is trading between resistance point at 1.3805 (05/05/2017 high) and support at 1.2128 (18/06/2015 low). Strong resistance is given at 1.4690 (22/01/2016 high). The pair is likely to head lower. The pair is trading above its 200 DMA.
USD/CHF Neutral
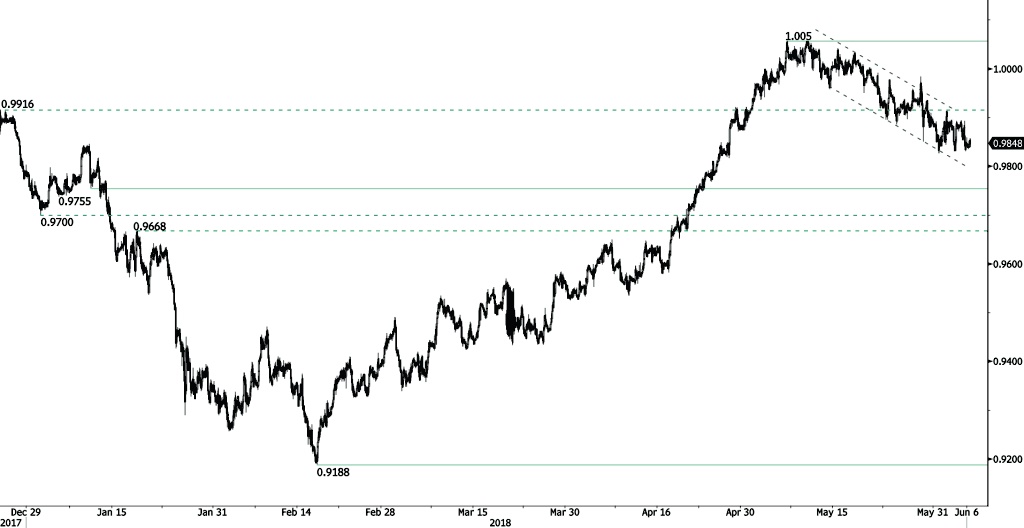
USD/CHF is stabilized at the 0.9845 range, trading sideways. The bearish pattern started in May 2018 is maintained. Key support and resistance are given at 0.9755 (10/01/2018 low) and 1.01 (11/05/2017 high). The technical structure suggests short-term sideways trading moves.
In the long-term, the pair is still trading in range since 2011 despite some turmoil when the SNB unpegged the CHF. Key support lies at 0.9072 (07/05/2015 low) while resistance at 1.0344 (15/12/2016 high) is distanced. The technical structure favours a long term bullish bias since the unpeg in January 2015.