Sample Category Title
EUR/USD Daily Outlook
Daily Pivots: (S1) 1.1563; (P) 1.1620 (R1) 1.1720; More.....
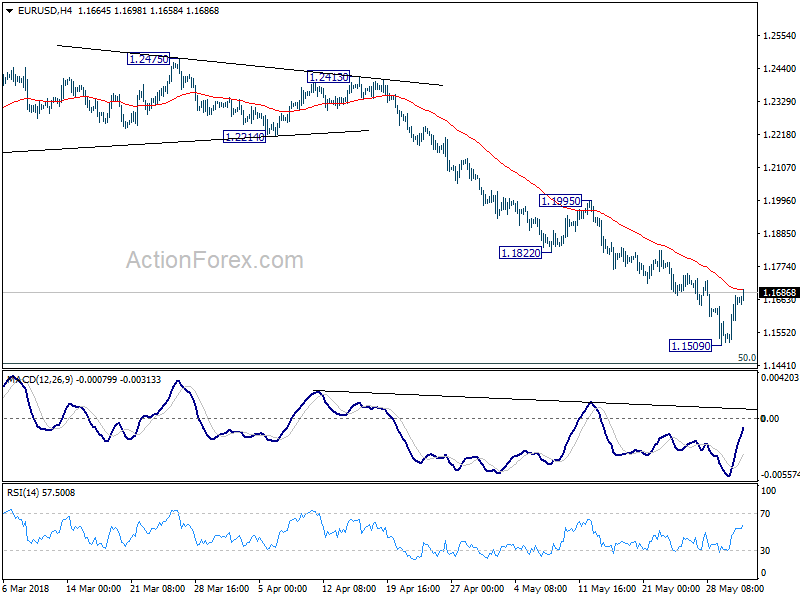
EUR/USD's recovery from 1.1509 is still in progress and touches 4 hour 55 EMA. Further rise could be seen. But upside should be limited by 1.1822/1995 resistance zone to bring fall resumption. Below 1.1509 will target 50% retracement of 1.0339 to 1.2555 at 1.1447 first. Break will target 61.8% retracement at 1.1186 next.
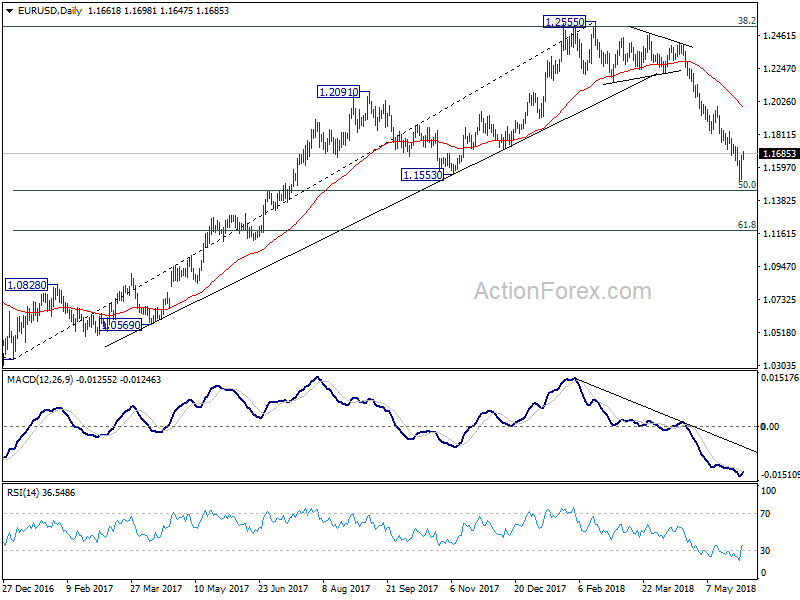
In the bigger picture, current development suggests that EUR/USD was rejected by 38.2% retracement of 1.6039 (2008 high) to 1.0339 (2017 low) at 1.2516. And, a medium term top was formed at 1.2555 already. Decline from there should extend further to 61.8% retracement of 1.0339 to 1.2555 at 1.1186 and below. For now, even in case of rebound, we won't consider the fall from 1.2555 as finished as long as 1.1995 resistance holds.
GBP/USD Daily Outlook
Daily Pivots: (S1) 1.3242; (P) 1.3274; (R1) 1.3315; More...
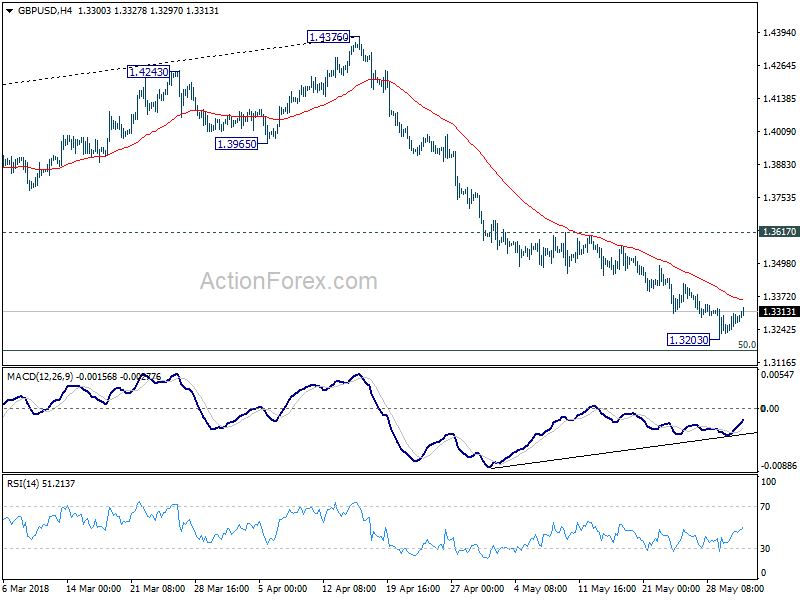
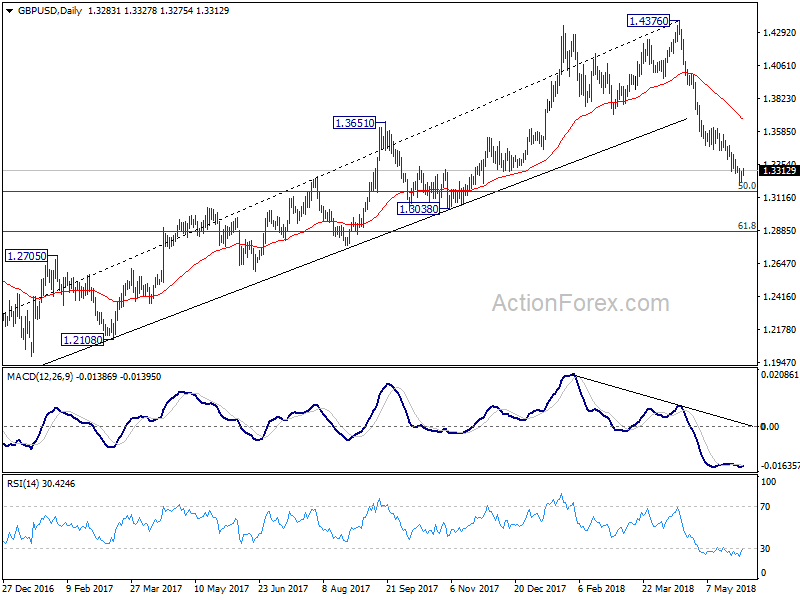
Intraday bias in GBP/USD remains neutral for consolidation above 1.3203 temporary bottom. Stronger recovery might be seen. But near term outlook will remain bearish as long as 1.3617 resistance holds. Fall from 1.4376 is expected to resume later. Below 1.3203 will target 50% retracement of 1.1946 to 1.4376 at 1.3161 first. Break will target 61.8% retracement at 1.2875 next.
In the bigger picture, current development suggests that whole medium term rebound from 1.1936 (2016 low) has completed at 1.4376 already, with trend line broken firmly, on bearish divergence condition in daily MACD, after rejection from 55 month EMA (now at 1.4223). 61.8% retracement of 1.1936 (2016 low) to 1.4376 at 1.2874 is the next target. We'll pay attention to the reaction from there to asses the chance of long term down trend resumption. For now, outlook will stay bearish as long as 55 day EMA (now at 1.3730) holds, even in case of strong rebound.
USD/CHF Daily Outlook
Daily Pivots: (S1) 0.9868; (P) 0.9902; (R1) 0.9927; More...
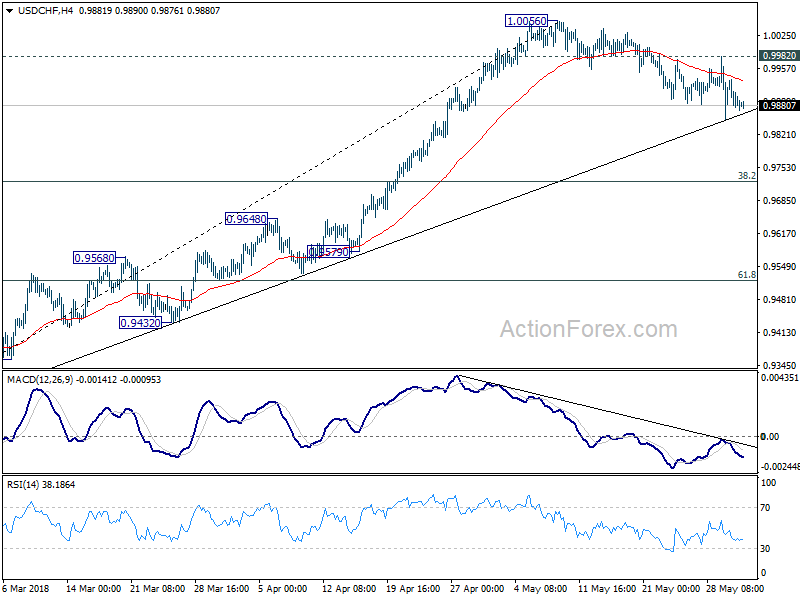
Intraday bias in USD/CHF remains neutral for the moment. We'd continue to expect strong support from near term trend line (now at 0.9863) to complete the correction from 1.0056 to bring rise resumption. On the upside, above 0.9982 will bring retest of 1.0056 first. However, sustained break of the trend line will argue that it's a larger scale correction and will target 0.9724 fibonacci level.
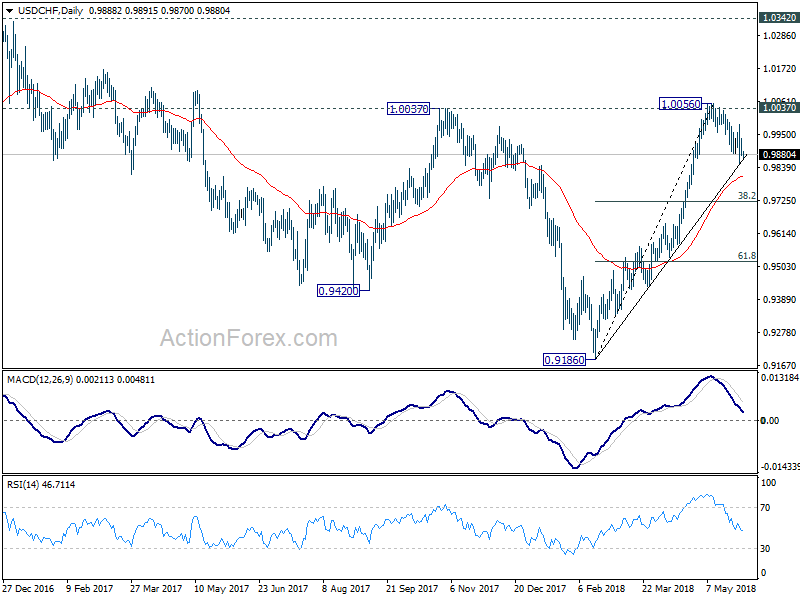
In the bigger picture, medium term decline from 1.0342 has completed with three waves down to 0.9186. Rise from there is currently viewed as a leg inside the long term range pattern. Hence, while further rally would be seen, we'd be cautious on strong resistance from 1.0342 to limit upside. For now, further rise is expected as long as 38.2% retracement of 0.9186 to 1.0056 at 0.9724 holds.
USDJPY Remains Weak Below 109.00 Level
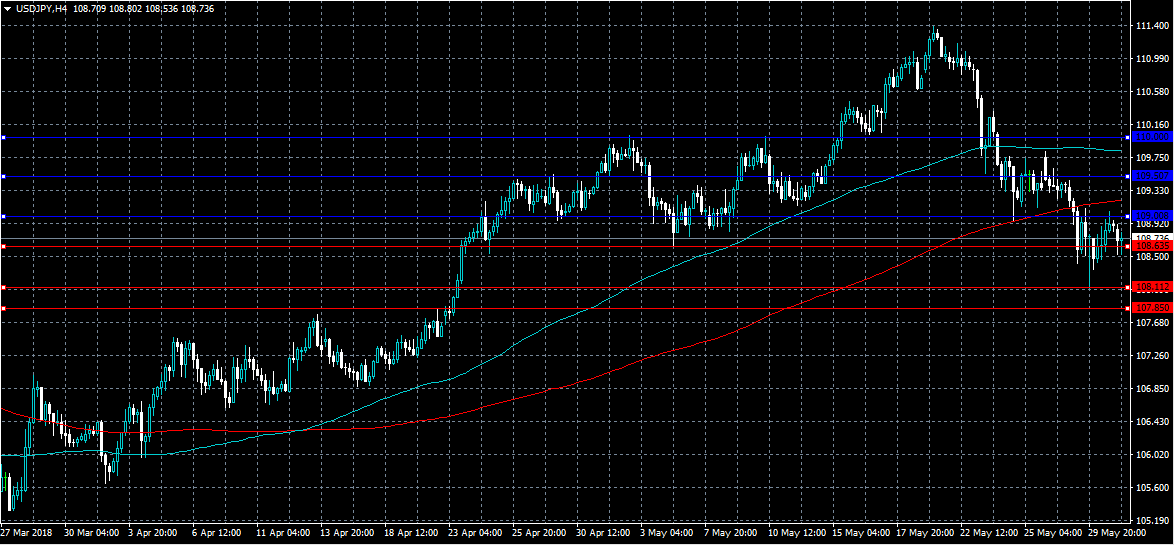
The US dollar remains under selling pressure against the Japanese yen, with weakness in the US dollar index helping to contain price below the 109.00 level. The USDJPY pair currently trades around the 108.70 level, with sellers still using any upside moves towards the 109.00 level as a selling opportunity. Sellers now need continued weakness below 108.63 support level, while buyers need a clean break above the key 109.00 resistance level.
The USDJPY pair remains bearish while trading below the 109.00 level, further downside towards 108.11 and 107.85 remains likely.
If USDJPY buyers can move price above the key 109.00 level, they may be encouraged to test towards the 109.50 and 110.00 resistance levels.
EURUSD Intraday Bullish Above 1.1600 Level
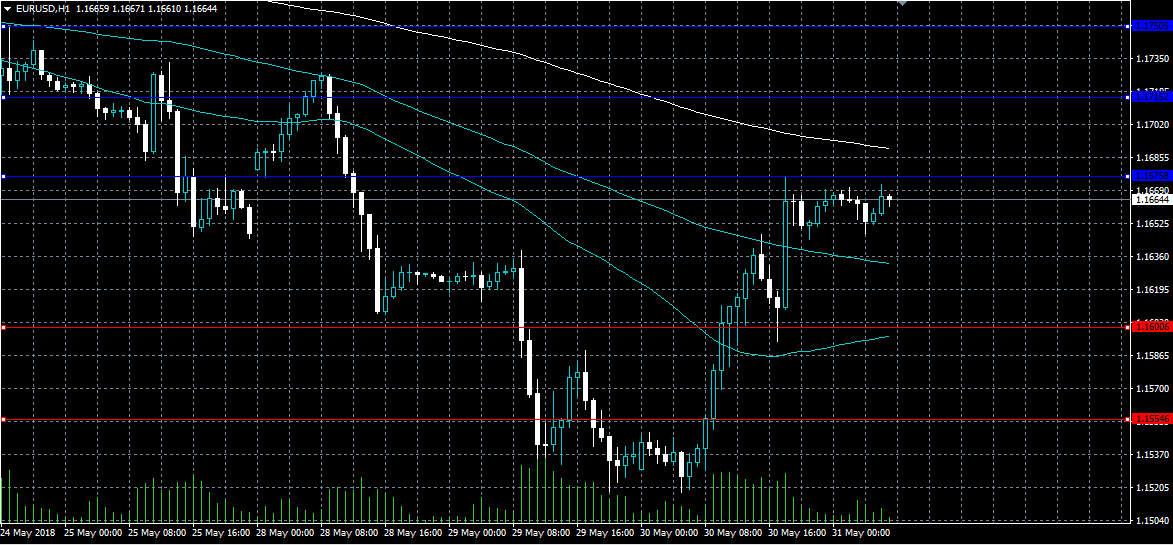
The euro has started to correct higher against the US dollar, hitting 1.1675, following the release of weaker than expected data from the United States economy on Wednesday. The EURUSD pair remains bearish in the medium-term while trading below the 1.1715 level, but still retains an intraday bullish bias above the 1.1600 level. EURUSD traders will likely find direction from the US dollar index and the latest news coming out from the Italian economy.
The EURUSD pair is intraday bullish while trading above the 1.1600 level. Key resistance is located at the 1.1715 and 1.1750 levels.
If the EURUSD pair moves below the 1.1600 level, we may see a technical correction back towards the 1.1554 and 1.1500 levels.
North American Data In The Spotlight
A deluge of economic data will flow through the financial markets on Thursday, with US and Canadian releases set to generate the bulk of the headlines.
Ahead of North America, investors can expect several European releases to hit the newswire, including Swiss and Spanish GDP figures. The Swiss economy likely grew 2.3% in the first quarter. Analysts are projecting Spanish growth to accelerate 2.9% annually.
France is also set to publish inflation numbers at 06:45 GMT. The consumer and producer indices will be released at that time.
Italy, a nation going through another political crisis, will release inflation and unemployment figures throughout the day.
At 09:00 GMT, the European Commission’s statistical agency will report on consumer inflation for the 19-member Eurozone. According to analysts, the preliminary reading will likely show annual growth of 1.6% for May, up from 1.2% the previous month. Core inflation, which strips away volatile goods such as food and energy, likely jumped 1% year-over-year.
Shifting gears to North America, the US Commerce Department will report on personal incomes and outlays at 12:30 GMT. The monthly report also contains the latest reading on core personal consumption expenditures (PCE), the Federal Reserve’s preferred measure of inflation. The core PCE index likely rose 2% year-over-year in April.
Labor economists will also report on initial jobless claims at 12:30 GMT. Meanwhile, ISM-Chicago will issue its monthly purchasing managers’ index (PMI) for May.
North of the US border, the Canadian government will report on first-quarter GDP at 12:30 GMT. The Canadian economy is projected to grow 1.8% between January-March, up from 1.7% the previous quarter.
On the policy front, Federal Open Market Committee (FOMC) members Raphael Bostic and Lael Brainard will deliver speeches at 16:45 GMT and 17:00 GMT, respectively.
EUR/USD
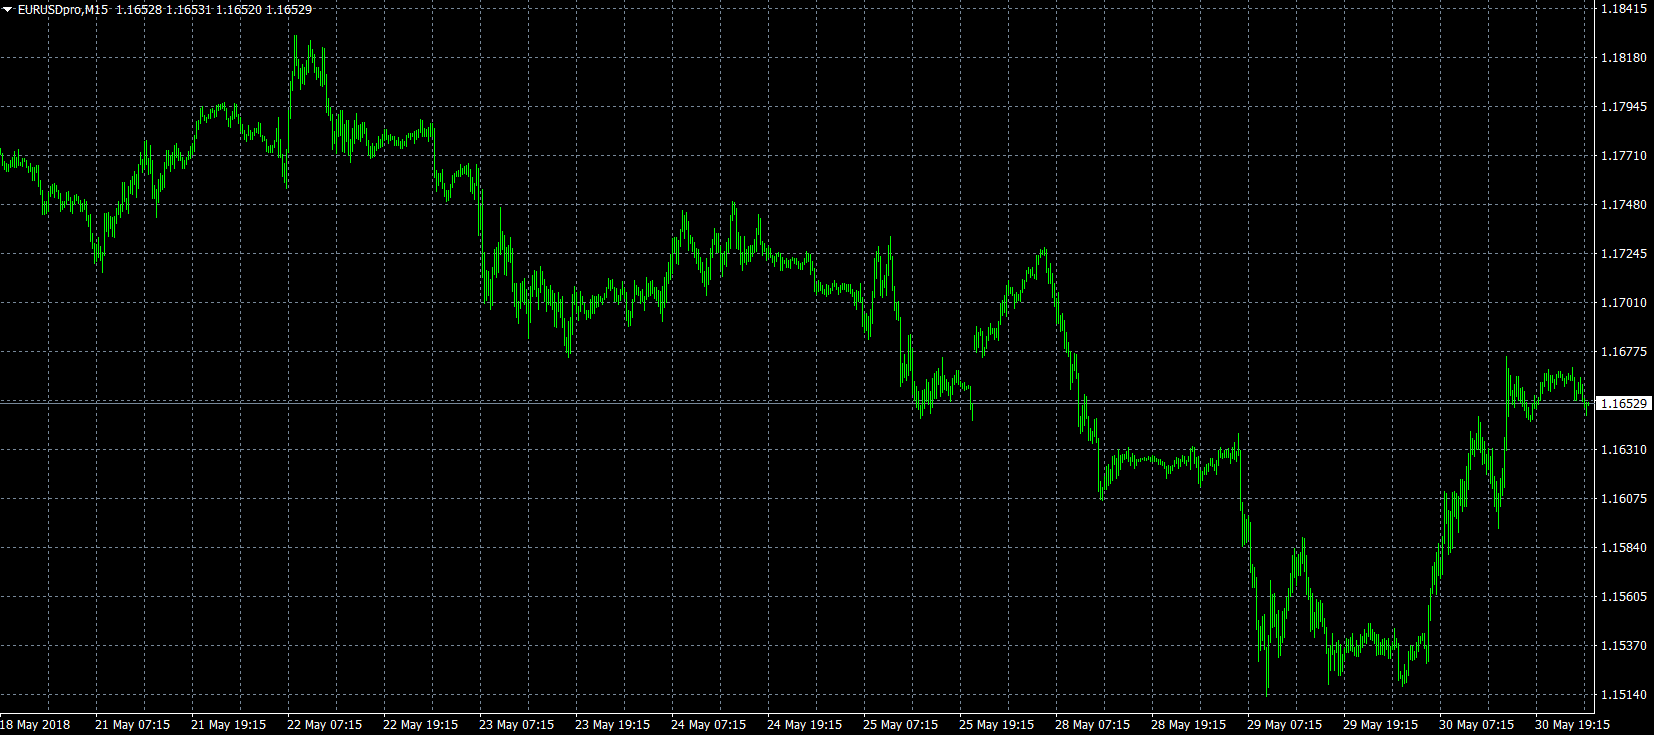
Europe’s common currency got some reprieve on Wednesday as the US dollar eased off five-month highs. EUR/USD recovered around 1.1650, where it faces firm support around 1.1550. On the opposite side of the ledger, gains are likely capped below 1.1725 for the time being.
USD/CAD
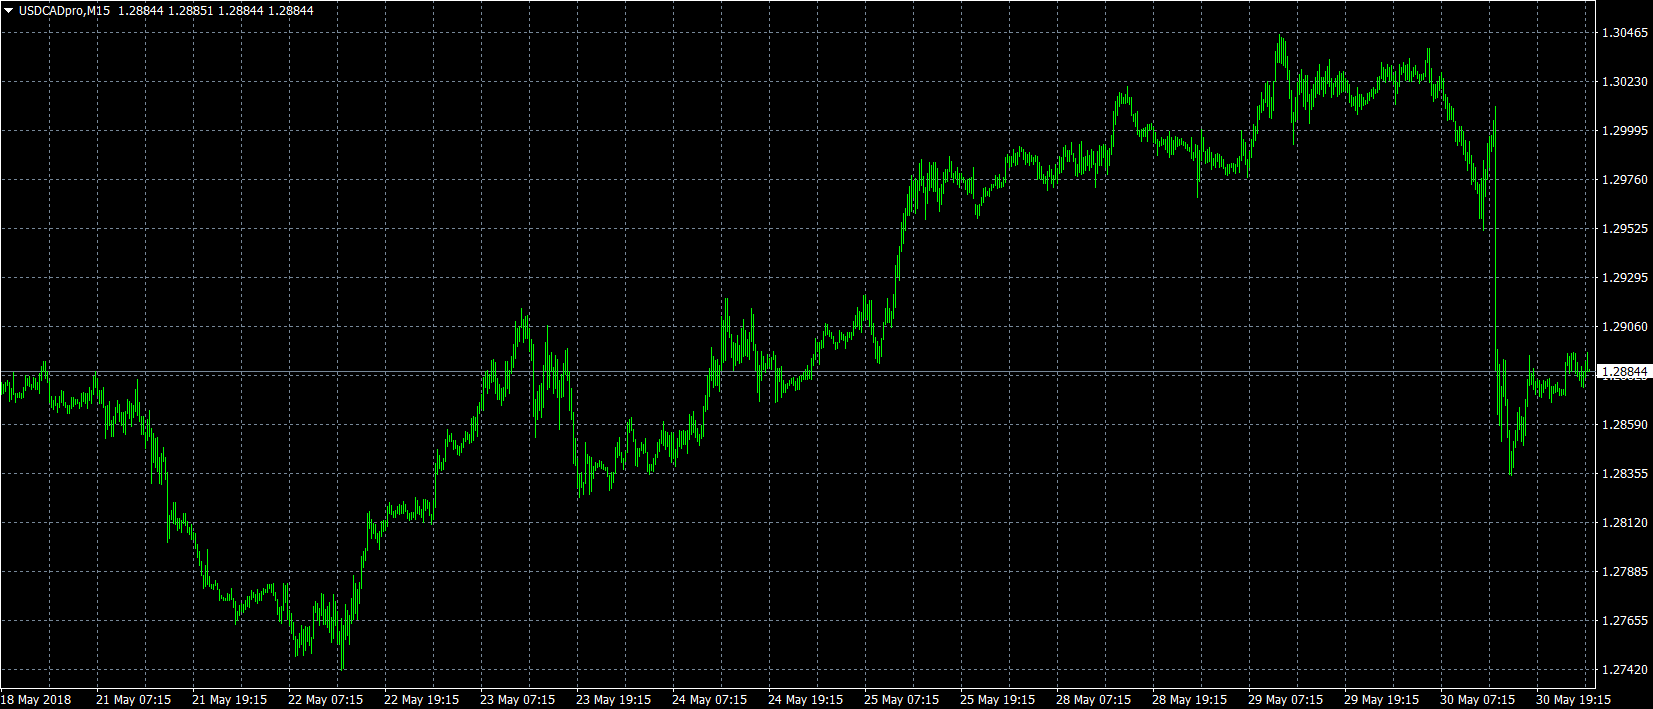
The loonie bounced back on Thursday after the Bank of Canada (BOC) gave strong indications that interest rates will continue to rise this year. According to analysts, the BCO could raise rates as early as July. After hitting a high of 1.3038, USD/CAD has plunged around 150 pips to the 1.2890 region. Further declines could be in store should Canada’s GDP figures surprise to the upside.
GBP/USD
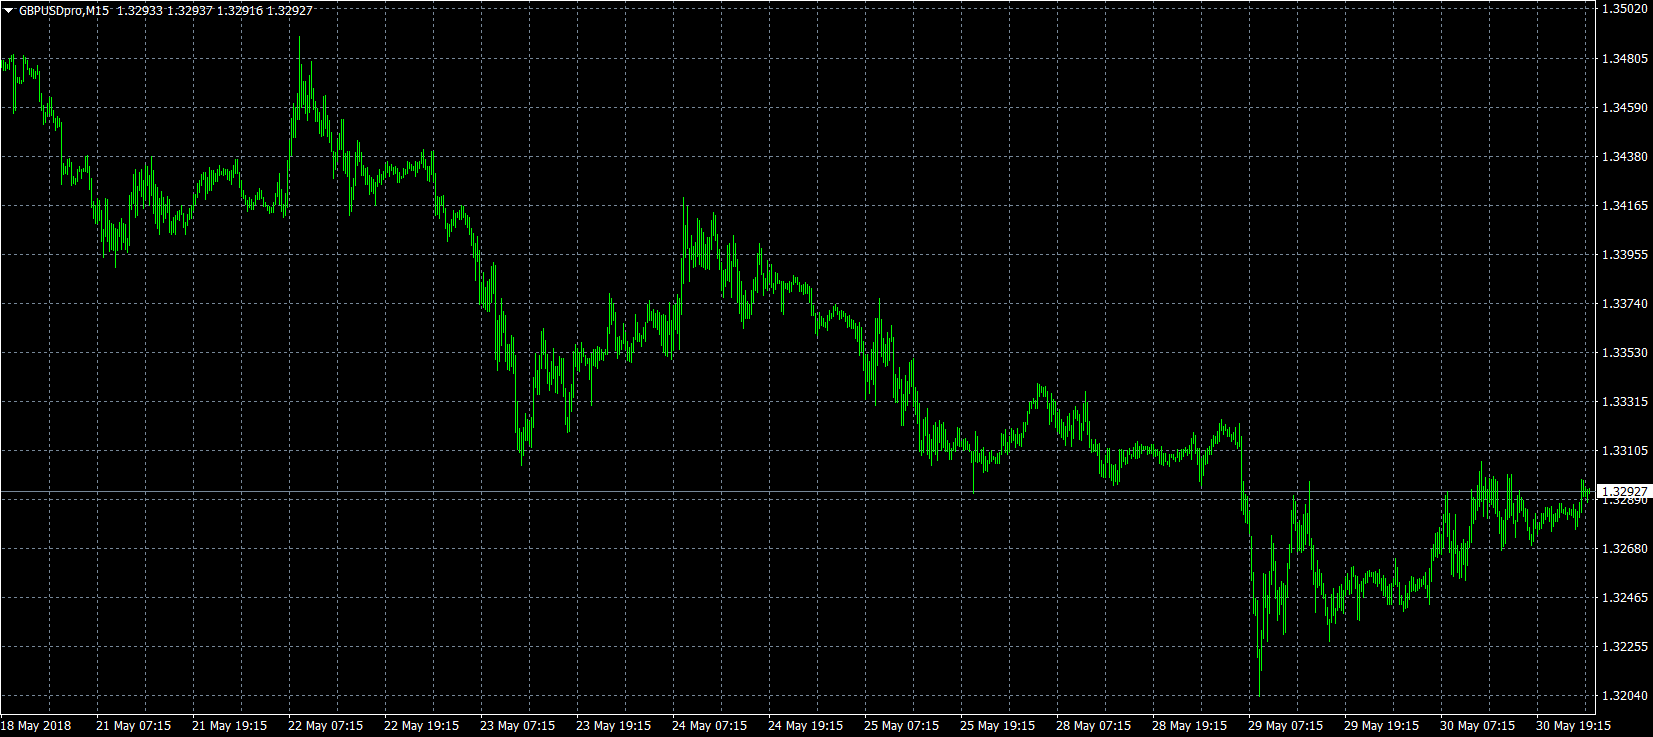
Cable drifted between gains and losses Wednesday before settling higher, as prices approached the 1.3300 US handle. GBP/USD is currently trading just below those levels, as the pair remains vulnerable to a bigger retracement. Key support continues to hold at 1.3255 for the time being.
USD/JPY Daily Outlook
Daily Pivots: (S1) 108.47; (P) 108.78; (R1) 109.20; More...
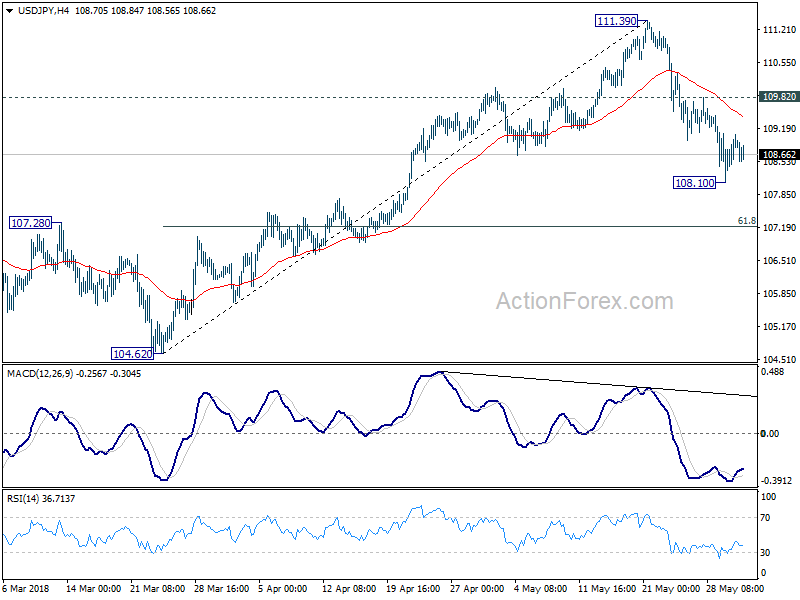
A temporary low is in place at 108.10 and intraday bias is turned neutral first. As long as 109.82 minor resistance holds, deeper decline is expected in USD/JPY. Below 108.10 will target 61.8% retracement of 104.62 to 111.39 at 107.20. Break will likely resume larger decline from 118.65 for a new low below 104.62. On the upside, break of 109.82 is needed to confirm completion of the fall from 111.39. Otherwise, near term outlook will be mildly bearish even in case of recovery.
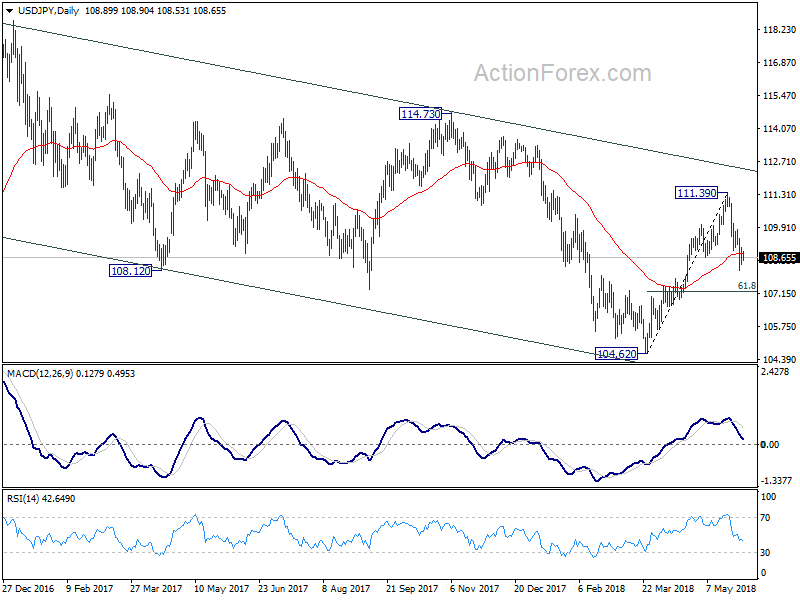
In the bigger picture, USD/JPY remains bounded in medium term falling channel from 118.65 (2016 high). The development. Current deeper than expected fall from 111.39 argues that fall from 118.65 is not finished. Break of 104.62 low would target 98.97 or even below. Though, break of 111.39 will revive the case that fall from 118.65 has completed and turn focus to 114.73 for confirmation.
Elliott Wave View: Russell (TF_F) In Ending Diagonal
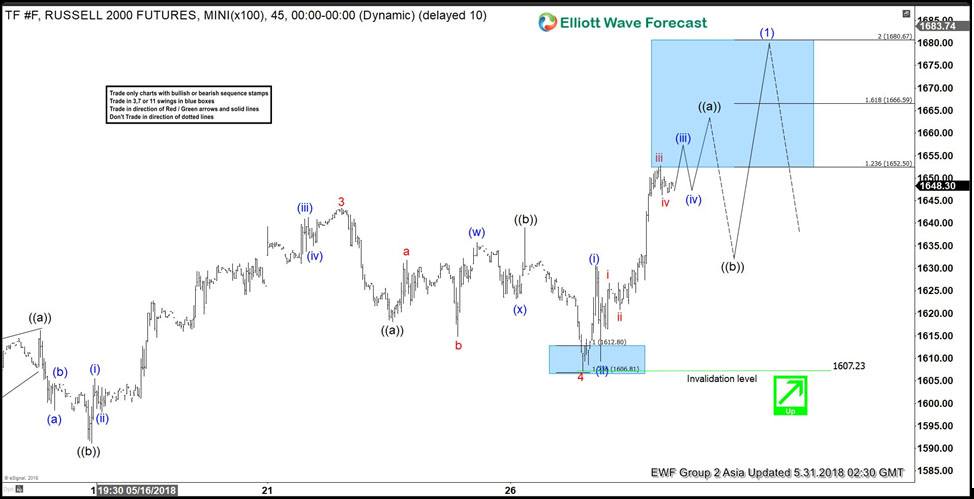
Russell (TF_F) index short-term Elliott Wave view suggests that the rally from April 02.2018 low (1482.6) is taking a form of an Elliott wave leading diagonal structure within Intermediate wave (1) higher. Leading diagonal structure usually appears as the sub-division of a wave (1) of an impulse or wave (A) of a Zigzag structure. The internal sub-division of a leading diagonal can either be 5,3,5,3,5 or 3,3,3,3,3.
In Russell’s case, the internal sub-division of Intermediate wave (1) is unfolding in 3.3.3.3.3. Minor wave 3 of (1) ended at 1643.3 as corrective 3 waves (zigzag) structure. Where Minute wave ((a)) of 3 ended at 1616.2. Minute wave ((b)) of 3 ended 1591.2. And Minute wave ((c)) of 3 ended at 1643.3. Down from there the pullback to 1607.23 low ended Minor wave 4 of (1) with internals also as a zigzag structure. When the Minute wave ((a)) of 4 ended at 1618.1 and Minute wave ((b)) of 4 ended at 1639.
Above from 1607.23 low the index has already made a new high confirming Minor wave 5 of (1) has resumed. The rally is expected to take the form of another zigzag structure. As far as near-term dips remain above 1607.23 level, the index has scope to extend higher towards 1680.67 area before ending Intermediate wave (1). Afterwards, the index is expected to do a pullback in intermediate wave (2) in 3, 7 or 11 swings before further upside is seen. We don’t like chasing it here because it has already reached the minimum extension area for Minor wave 5. I.e it has reached inverse 1.236-1.618% Fibonacci extension area of 4 at 1652.50-1666.59 area.
Russell 1 Hour Elliott Wave Chart
USDJPY Pauses Above 5-Week Low But Remains Below 40-Day SMA
USDJPY recorded a stunning sell-off rally last week and the bearish movement continues this week, with the price diving several times below the 108.65 support level. On Tuesday, the pair posted a five-week low of 108.10 and currently is trading slightly above this trough. The momentum indicators are endorsing the bearish structure in the short-term as both, the RSI and the MACD, are moving lower.
In the daily timeframe, the RSI indicator is pointing to the downside below the threshold of 50, while the MACD oscillator is falling below its trigger line and near the zero line. As a side note, the price is developing below the 20- and 40-simple moving averages (SMAs) at the moment of writing.
In case of further declines in the pair, immediate support may be found near the latest lows at 108.10. A downside break of that zone would open the way towards the next support near the 23.6% Fibonacci retracement level of the downleg from 118.60 to 104.60, around 107.80. If sellers manage to push below that hurdle too, that would drive the price until the 105.65 barrier, increasing the probability for further bearish extensions.
On the flip side, if the bulls retake control, price advances may stall initially near the 38.2% Fibonacci mark of 109.94, and subsequently near the psychological figure of 110.00. A potential upside violation of this handle would push the price higher until the 111.40 resistance level.
When looking in the longer timeframe, USDJPY has been trading within a channel tilted slightly to the downside since December 2016.

AUD/USD Daily Outlook
Daily Pivots: (S1) 0.7508; (P) 0.7546; (R1) 0.7616; More...
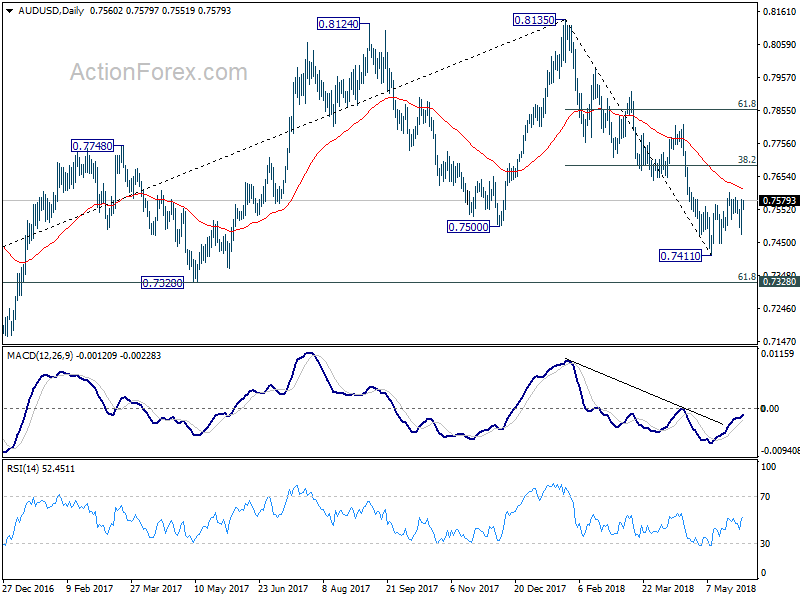
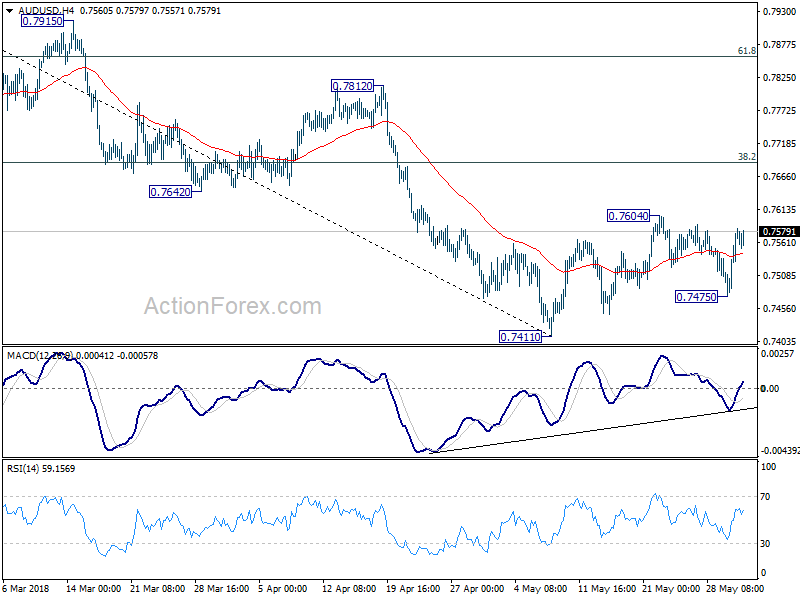
Strong rebound in AUD/USD dampens the immediate bearish case and turn intraday bias neutral again. More consolidation would be seen first and above 0.7604 will bring stronger rebound. But still, we'd expect strong resistance from 38.2% retracement of 0.8135 to 0.7144 at 0.7688 to limit upside to bring decline resumption eventually. On the downside, below 0.7475 will bring retest of 0.7411 low first. Break will resume the larger decline from 0.8135 to cluster support at 0.7328 (61.8% retracement of 0.6826 to 0.8135 at 0.7326).
In the bigger picture, medium term rebound from 0.6826 is seen as a corrective move. Prior break of 0.7500 key support suggests that such correction is completed at 0.8135. Deeper decline would be seen back to retest 0.6826 low. In case of another rise, we'd expect strong resistance from 38.2% retracement of 1.1079 to 0.6826 at 0.8451 to limit upside to bring long term down trend resumption eventually.