Sample Category Title
GBP/USD Short-Term Bounce Underway
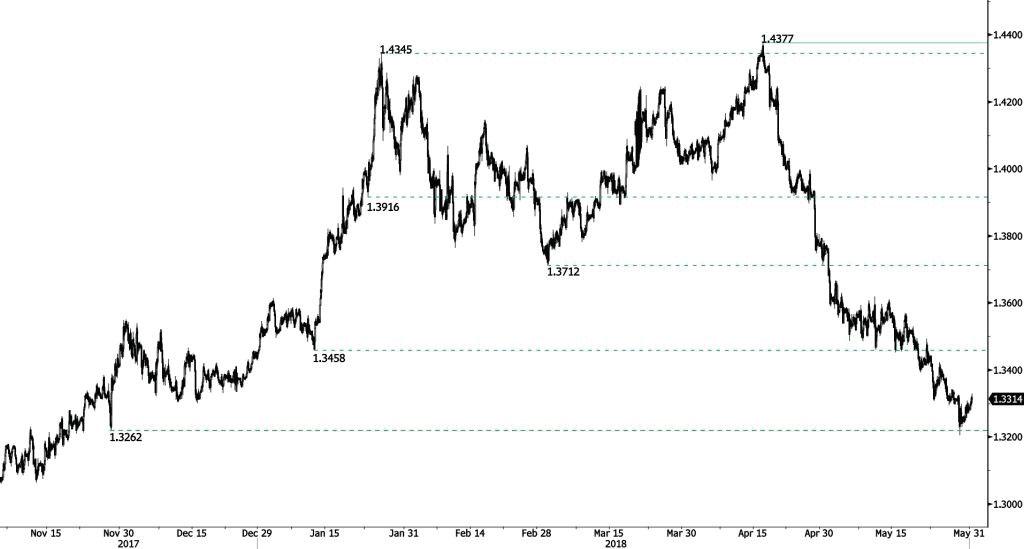
GBP/USD's moving higher. However, this strength is likely only temporary in nature. Further weakness towards the support at 1.3223 is favored. Key support and resistance are given at 1.3068 (13/11/2017 low) and 1.3458 (11/01/2017 low. The technical structure suggests further downside.
The long-term technical pattern is reversing. The Brexit vote had paved the way for further decline but the pair is moving to 2016 highs. Long-term support and resistance are given at 1.1841 (07/10/2017 low) and 1.5018 (24/06/2016 high).
EUR/USD Pickup In Buying Interest
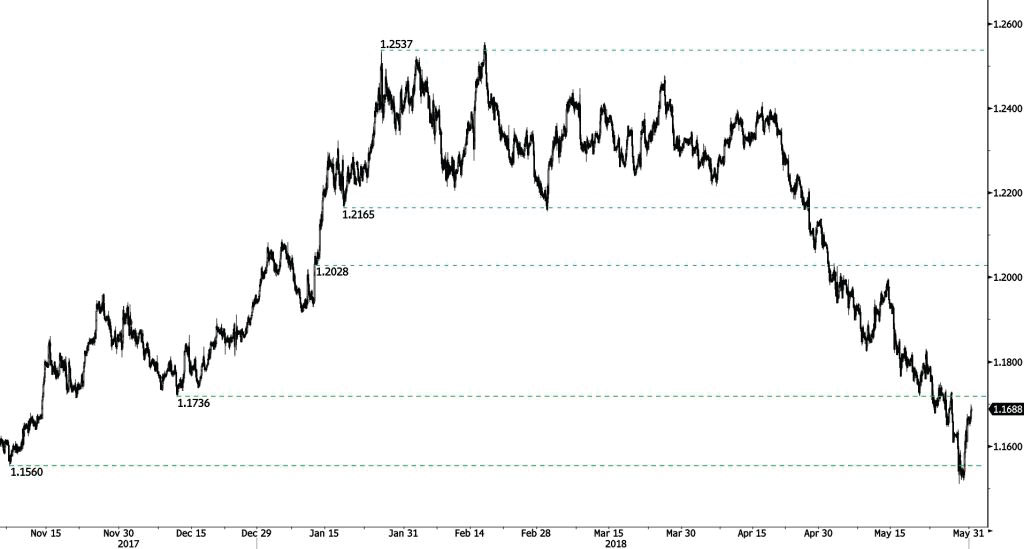
EUR/USD has experienced a pickup in buying interest near the support at 1.1560. The shortterm technical structure is negative as long as prices remain below the hourly resistance at 1.2036 (11/01/2017 low). Next key support and resistance are now given at 1.1463 (12/02/2018 low) and 1.2323 (17/01/2018 high).
In the longer term, the momentum is turning largely negative. We favor a continued bearish bias. Key resistance is holding at 1.2886 (15/10/2014 high) while strong support lies at 1.1554 (08/11/2017 low).
WTI OIL Outlook – Pauses After Strong Rally On Wednesday, EIA Crude Stocks Report Eyed For Fresh Signal
WTI oil price eased on Thursday as traders took profit on Wednesday’s strong rally when oil price rose 2.06% in a biggest one-day rally since 18 Apr.
The rally was boosted by report that OPEC will keep production cut until at least the end of the year, improving the sentiment which weakened on concerns about output increase by key world oil producers to cover oil shortages.
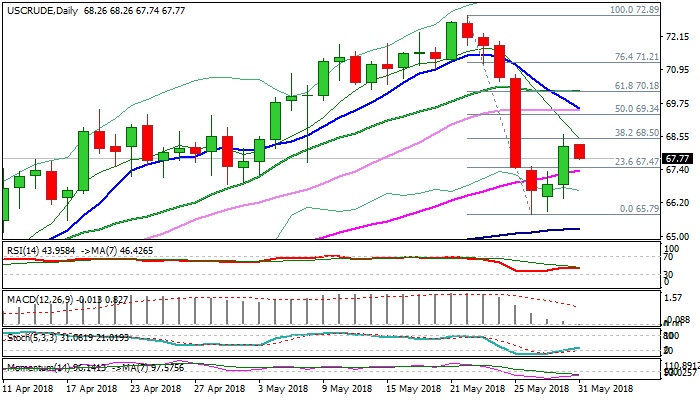
Reversal pattern was completed on daily chart after steep fall from $72.89 peak found solid ground on the top of rising daily cloud.
Subsequent bounce cracked pivotal barrier at $68.50 (Fibo 38.2% of $72.89/$65.79 fall), but so far without clear break higher which is required to generate strong bullish signal for extension of recovery rally from $65.79 (28 May low).
Strengthening momentum and north-heading slow stochastic support the notion, but fresh bulls were weakened by build of US crude stocks (API report showed build of 1 million barrels).
Focus turns on release of EIA crude stocks data, due later today and forecasted for build of 2.2 million barrels cs 5.7 million barrels build last week.
Solid numbers from EIA report (releaseat / below forecast) would be supportive for oil prices, while surprise draw in oil inventories would accelerate recovery rally for test of converged 10/30SMA’s at $69.55 and psychological $70 barrier.
Negative signal could be expected on break below rising 55SMA ($67.35) which would risk retest of daily cloud top ($66.61) and 28 May low at $65.79.
Res: 68.26, 68.65, 6955, 70.00
Sup: 67.35, 67.00, 66.61, 66.34
NZDUSD Holds Near 3-Week High Above 0.7000, Bulls Take Control
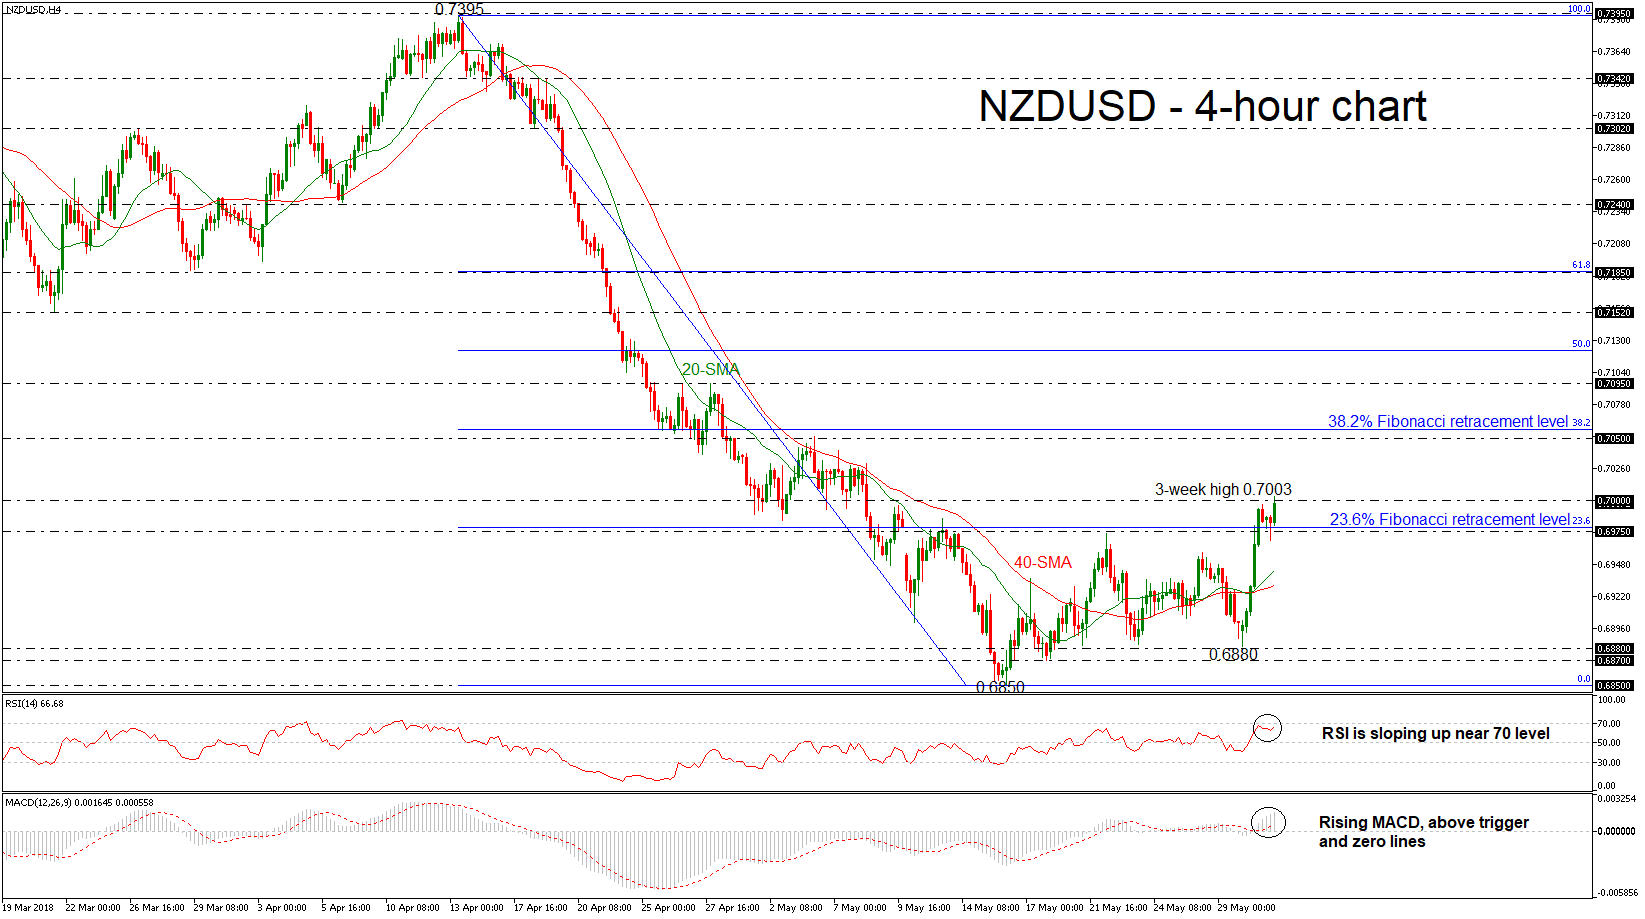
NZDUSD has surged to a new three-week high above the 0.7000 strong psychological level during today’s European session, pausing the downtrend. The technical indicators are sending bullish signals, suggesting that a bullish correction is in the process.
From the technical point of view, in the 4-hour chart, the RSI indicator is moving slightly higher, indicating that the market could strengthen in the short-term as it is approaching the overbought area. The MACD oscillator supports a bullish picture as well since the index continues to increase positive momentum above its red-trigger line.
If the market manages to pick up speed, the 0.7050 could offer nearby resistance ahead of the 38.2% Fibonacci retracement level of the downleg from 0.7395 to 0.6850, around 0.7060. A significant close above the latter would drive the pair until the 0.7095 barrier, taken from the peak on April 27.
However, should prices decline, immediate support could be found at the 23.6% Fibonacci which stands near the 0.6975 level. Then a leg below that hurdle, the pair could meet the 20- and 40-simple moving averages at 0.6940 and 0.6930 respectively. A drop below the aforementioned obstacles could open the door for the 0.6880 support, identified by the low on May 29.
Looking at the daily timeframe, it is worth mentioning that NZDUSD has jumped above the 20-day SMA signaling further gains.
Forex Analysis: USDJPY And EURAUD
USDJPY
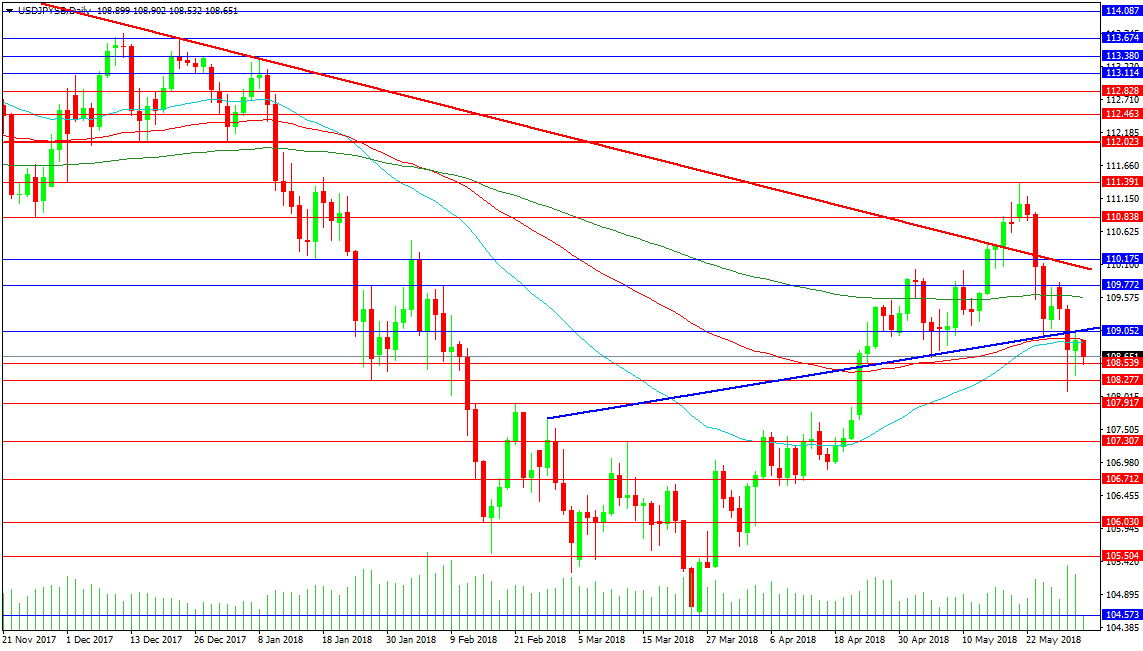
The USDJPY pair ran into resistance at 111.390 earlier this month on its attempt to reach 112.000. Price has been pushed down to 108.100 area support this week and has retested the previously supportive trend line as resistance yesterday at 109.052. Today’s low found support at the 108.539 level so far but a loss of this point could see a move to 108.000 and beyond. The bears have the advantage here and can look for targets at 106.712 and the 2018 low at 104.573.
A break above the 109.100 level is needed to give bulls some hope of correcting the down trend. The false breakout above the red trend line this month has put them at a disadvantage but another attempt may have more success. The trend line is found at the 110.000 level today and a move higher will need to surpass the May high before 112.000 can be targeted.
EURAUD
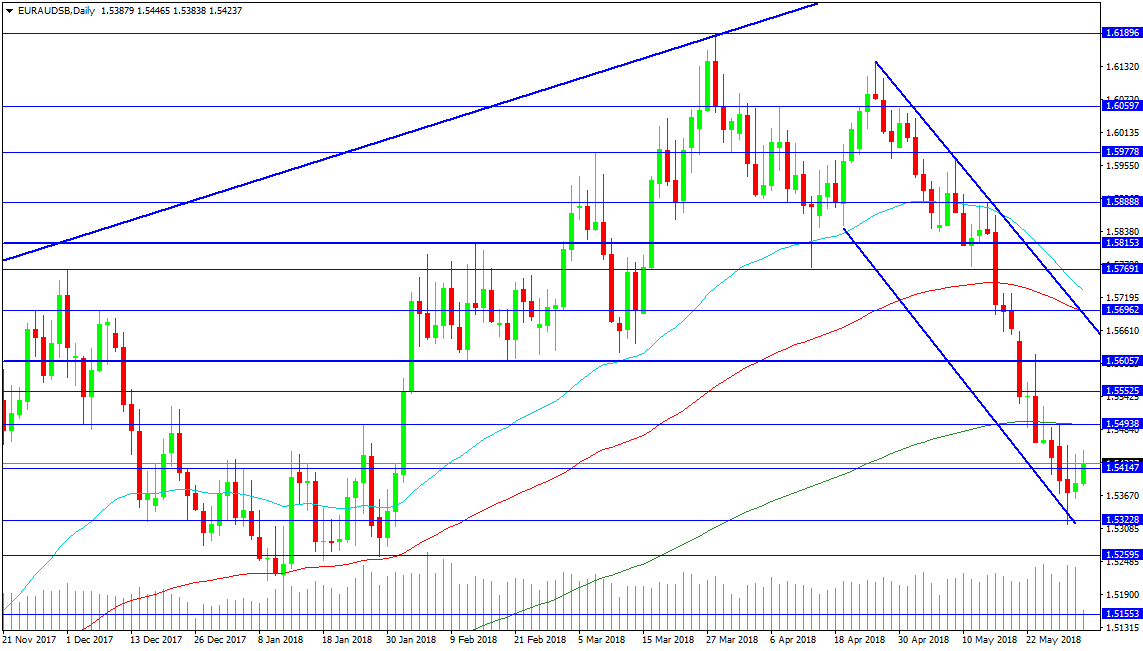
This pair has retraced its 2018 rally back to the January trading range after reaching a high of 1.61896 at trend line resistance. The price consolidated during February and stepped higher in April but support at 1.58153 was lost in May and price has dipped to a low of 1.53148. A loss of this low could push price lower in is down channel to 1.52750 today with targets in extension at 1.51000 and 1.50000. Resistance comes from the 200 DMA at 1.54938 and would support such a move since the area was tested on Monday.
The chart formed a Doji type candle on Tuesday and a move above the high of this candle at 1.54551 could see more long positions opened in the hope that a reverse in on the cards. A break above 1.55000 would force short positions to close and could lead to a rapid retest of 1.56000. The channel top is currently at the key resistance level of 1.56962 which is also hosting the 100 DMA today making it a level of extreme interest for traders in the coming 36 hours.
Euro Rebounds As Italian Risks Recede For Now, Inflation Data The Next Euro-Mover
Here are the latest developments in global markets:
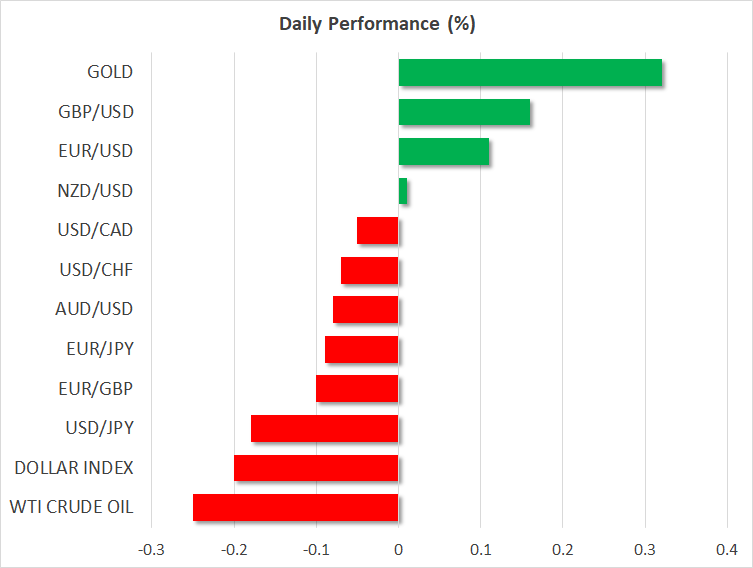
FOREX: The US dollar index – which tracks the greenback’s performance versus a basket of six major currencies – was down by 0.2% on Thursday, extending the losses it posted the previous day. The pullback was mainly owed to a rebound in the euro, the currency that holds more than 50% of the weight in the dollar index. Meanwhile, the Canadian dollar surged following some hawkish hints from the nation’s central bank.
STOCKS: US markets rebounded sharply on Wednesday, as concerns surrounding the European political saga eased somewhat. The S&P 500 and the Dow Jones climbed by 1.27% and 1.26% respectively, with the recovery in both led by the energy and financial sectors, while the tech-heavy Nasdaq Composite rose by 0.89%. That said, sentiment seems to have soured today, as futures tracking the S&P, Dow, and Nasdaq 100, are all pointing to a slightly lower open. Asia was a sea of green on Thursday, with Japan’s Nikkei 225 and Topix gaining 0.83% and 0.65% correspondingly, while in Hong Kong, the Hang Seng advanced by 0.98%. Meanwhile in Europe, futures following all the major benchmarks are well-into positive territory, signaling a notably higher open for these indices today.
COMMODITIES: Oil prices recovered notably yesterday alongside investors’ risk appetite, though the precious liquid is on the back foot again on Thursday. WTI is down by 0.25% and Brent by 0.4% today, following the release of the private API inventory data overnight that showed a build in crude stockpiles, instead of the projected drawdown. The official EIA inventory data are due out today, at 1500 GMT. In precious metals, gold is up by 0.3% today – most probably due to the pullback in the US dollar – and is currently trading near the $1,305 per ounce mark. The yellow metal is now just below its 200-day moving average, located at $1,307, and it will be crucial to see whether the bulls can break above it; price advances were rejected from that hurdle three times now over the past week.
Major movers: Loonie surges as BoC lays groundwork for July hike; euro rebounds
The Bank of Canada (BoC) remained on hold yesterday, as was widely anticipated. In the statement accompanying the decision, the Bank adopted a clearly more hawkish stance, noting that “developments since April further reinforce (the) Governing Council’s view that higher interest rates will be warranted”. Equally, or perhaps more importantly, it erased a repeated reference in prior statements that it will remain “cautious” in raising rates. Overall, policymakers maintained a relatively upbeat tone, laying the groundwork for a rate increase as soon as at their next meeting in July, which market pricing currently assigns a 64% probability to.
The loonie surged against the US dollar, with the move also aided by a rebound in oil prices. Assuming Canadian data hold up over the next weeks, and that there is no negative news on the NAFTA front or another pullback in oil prices, it wouldn’t be a surprise to see the currency continue to recover ground as investors move to fully factor in a move in July.
Turning to Europe, the common currency rebounded across the board yesterday, as the extreme moves in European bond markets retraced. Yields on Italian and other EU peripheral bonds fell back somewhat, indicating that investors were willing to hold those nations’ debt again as the risks surrounding the European political scene appeared to have eased a little, for now.
Italy’s President announced he will allow the two populist parties more time to attempt to form a government, which was likely seen as diminishing the likelihood for early elections – an event that could see the popularity of anti-establishment parties surge further. A surprisingly strong set of inflation readings across European countries probably aided the euro’s recovery, on speculation for a similar reaction in the bloc’s headline CPI rate today. That said, with the Italian situation still up in the air and the prospect of Spanish PM Rajoy facing a no-confidence vote soon, politics could remain the overarching theme for the euro over the next weeks, with price action likely to remain volatile and headline-driven.
On the trade front, reports on Wednesday suggested China is looking to line up other Asian and European nations against the US. This follows the recent announcement from the White House that it may still impose import tariffs on $50bn goods, unless China addresses the issue of alleged US intellectual properly theft.
Day ahead: Eurozone inflation, US core PCE and Canadian GDP on the agenda; politics and trade developments eyed
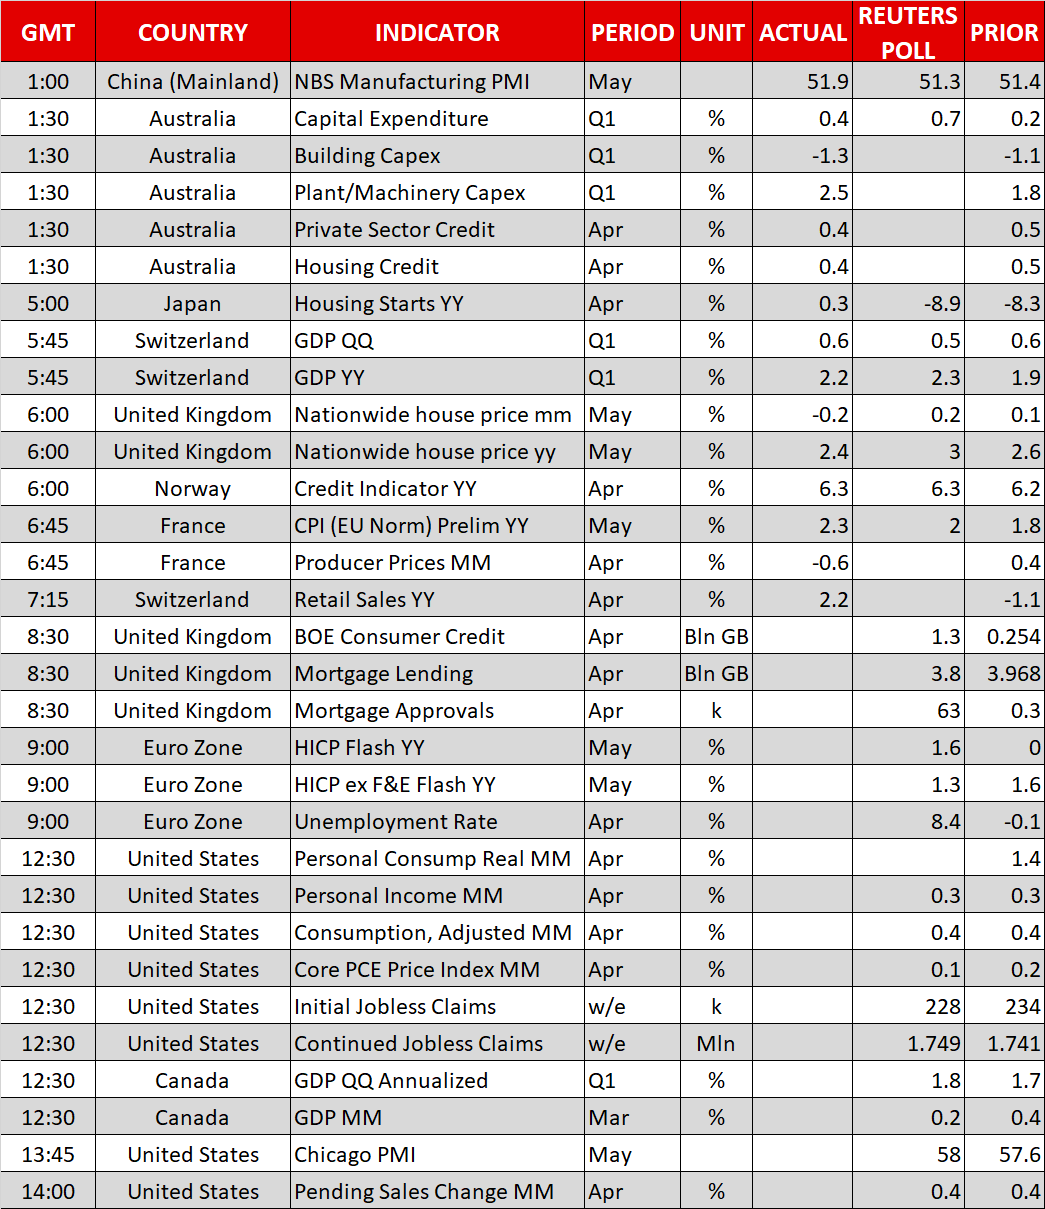
Thursday’s calendar features numerous important releases, including eurozone inflation data and US figures on personal income and consumption, as well as the core PCE inflation gauge. Beyond these, political and trade developments remain on the forefront.
At 0830 GMT, UK data on consumer credit, as well as on mortgage lending and approvals, all relating to the month of April, will be made public.
Having much greater potential to move markets though, are May’s flash inflation figures out of the eurozone due at 0900 GMT. The headline Harmonised Index of Consumer Prices (HICP) that uses a common methodology across EU countries, is forecast to accelerate to 1.6% y/y, up from April’s 1.2%. Core inflation, that excludes volatile food and energy items, is anticipated to grow by 1.3%, a higher pace relative to April’s 1.1%. A data beat might increase expectations for a faster tightening cycle by the ECB, consequently supporting the euro. April’s unemployment rate out of the eurozone will be released at the same time and it is expected to tick down to 8.4%, its lowest since late 2008.
In terms of euro trading, developments in Italy, and to a lesser extent Spain, should be kept in mind. Yesterday, concerns over Italy eased and allowed the euro to rally. In this respect though, it is interesting how quickly markets can move from one narrative – one of existential threats to the eurozone – to one projecting a rosier picture; to put it differently, markets may be running ahead of themselves.
US data on personal income and consumption, as well as the core PCE price index, all for April, will be in focus at 1230 GMT. The latter is the Federal Reserve’s preferred inflation gauge. An acceleration in the measure could push back up market expectations for more rate hikes in 2018 by the US central bank. For the record, core PCE is expected to expand by 1.8% y/y, down from March’s 1.9%. This compares to the Fed’s target for annual inflation of 2%. Weekly initial and continued jobless claims data are also due at the same time, while later in the day the US will see the release of the Chicago PMI for May (1345 GMT), and data on pending home sales for April (1400 GMT).
The loonie, which surged yesterday on what was interpreted as a hawkish message by the Bank of Canada, might prove sensitive to today’s Canadian GDP data pertaining to the month of March, as well as the first quarter of the year. The numbers are scheduled for release at 1230 GMT.
The EIA weekly report on crude oil inventories is due at 1500 GMT. Crude stocks are projected to have declined by 1.0 million barrels during the week ending May 25, after rising by around 5.8m in the previously tracked week.
Any updates on global trade are also likely to prove of significance during today’s trading. Just days before US Commerce Secretary Wilbur Ross visits Beijing for talks, the US and China appear to be getting confrontational again, while sources suggest the US will announce plans on the imposition of tariffs on steel and aluminum imported from the EU.
A G7 meeting on “Investing in Growth that Works for Everyone” that features finance ministers and central bankers will be running until June 2. Meanwhile, Bank of Canada Deputy Governor Sylvain Leduc will be giving a speech at 1635 GMT.
Technical Analysis: EURGBP looking mostly neutral in the short-term
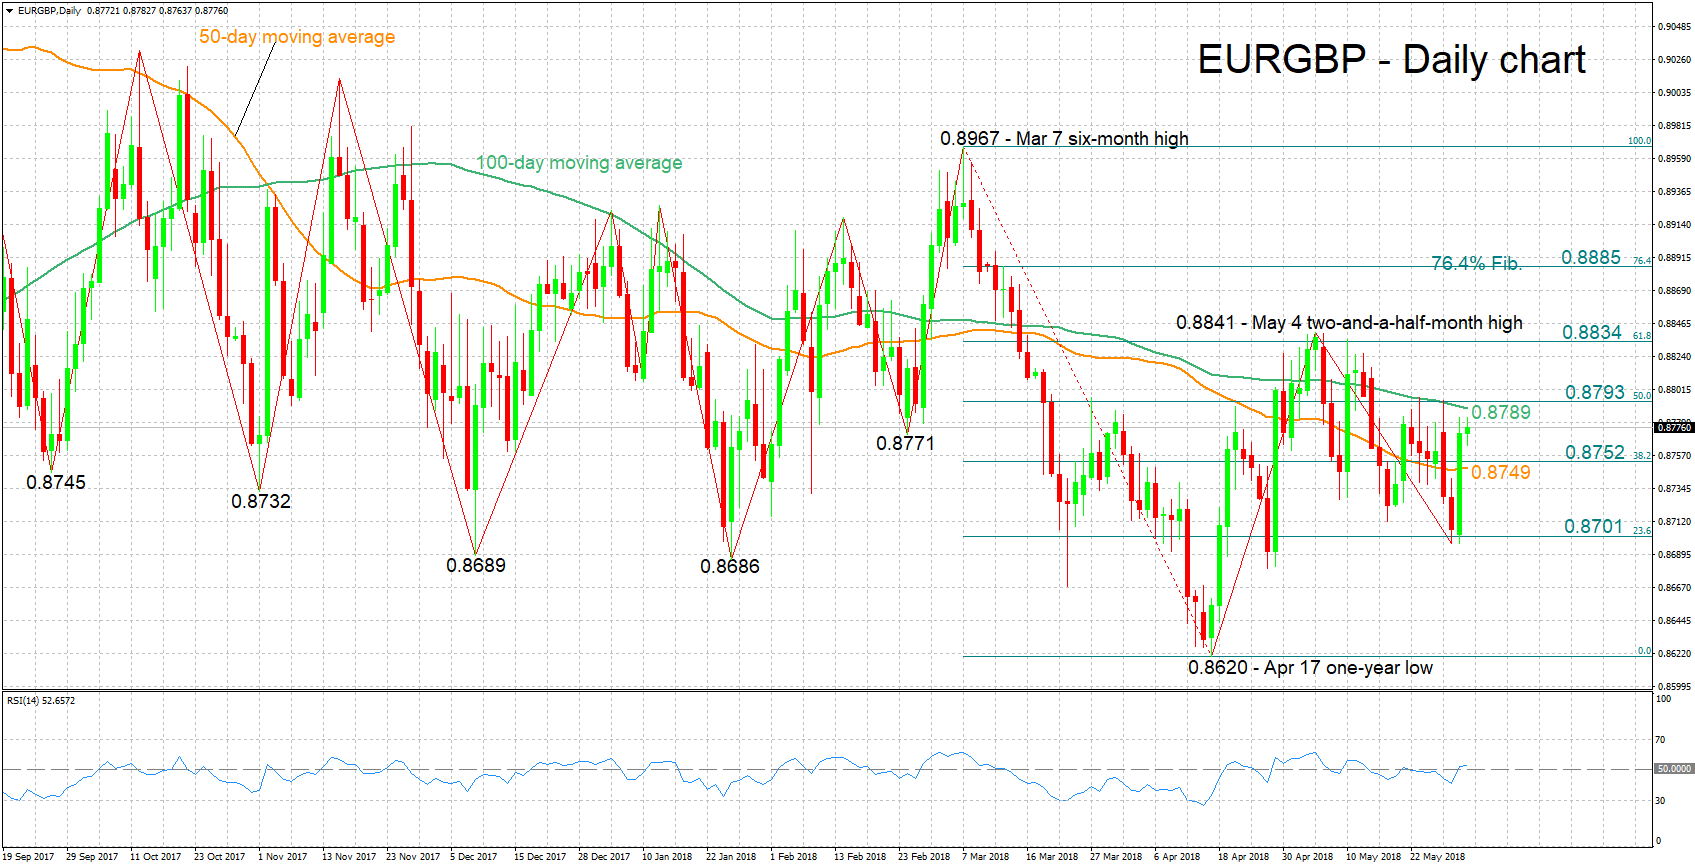
EURGBP added 0.75% on Wednesday, making up for losses from earlier in the week. The RSI has been hovering around the 50 neutral-perceived level recently, projecting a predominantly neutral short-term picture.
A data beat on the eurozone inflation front is likely to boost the pair. Immediate resistance seems to be taking place around the 50% Fibonacci retracement level of the March 7 to April 17 downleg at 0.8793; the current level of the 100-day moving average line at 0.8789 is also part of the area around this level. An upside break would turn the attention to the region around the 61.8% Fibonacci mark at 0.8834.
Weaker-than-anticipated inflation numbers, on the other hand, are expected to push EURGBP lower. Support could come around the 38.2% Fibonacci level at 0.8752 – including the 50-day MA at 0.8749 – and further below from the range around the 23.6% Fibonacci mark at 0.8701.
GBP/JPY Daily Outlook
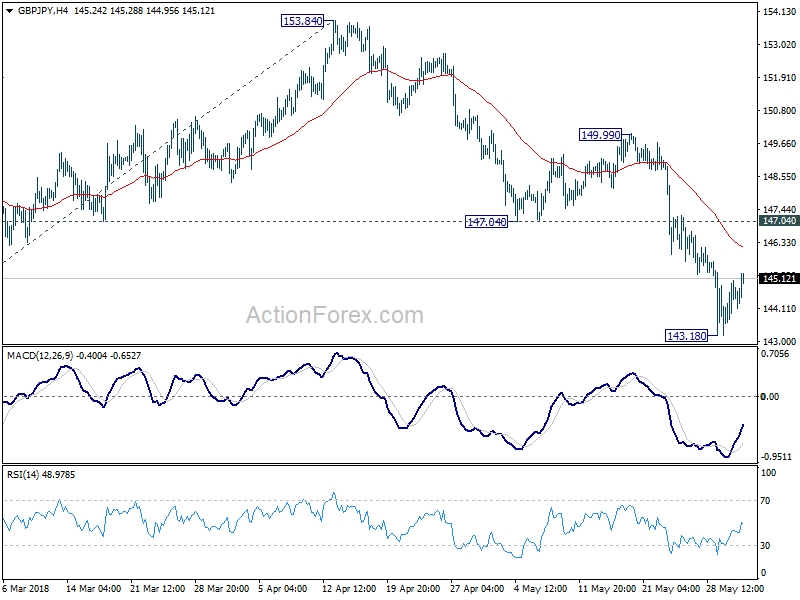
Daily Pivots: (S1) 143.80; (P) 144.44; (R1) 145.28; More...
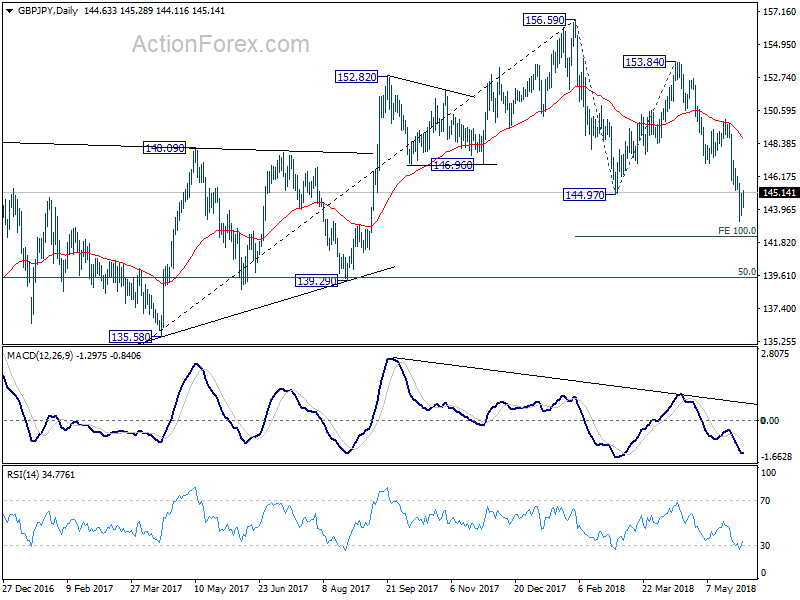
A temporary low should be in place at 143.18 with today's recovery. Intraday bias in GBP/JPY is turned neutral for consolidation. Further rise could be seen. But upside should be limited by 147.04 support turned resistance to bring decline resumption. Break of 143.18 will extend the fall from 159.59 to 100% projection of 156.59 to 144.97 from 153.84 at 142.22 next.
In the bigger picture, for now, we're treating price actions from 156.59 as a corrective move. Therefore, while deeper fall is expected, strong support should be seen above 139.29 cluster support (50% retracement of 122.36 to 156.59 at 139.47) to contain downside and bring rebound. There is still prospect of extending the rise from 122.36. However, considering that GBP/JPY failed to sustain above 55 month EMA (now at 153.94), firm break of 139.29 will confirm trend reversal and turn outlook bearish.
EUR/JPY Daily Outlook
Daily Pivots: (S1) 125.56; (P) 126.45; (R1) 127.91; More....
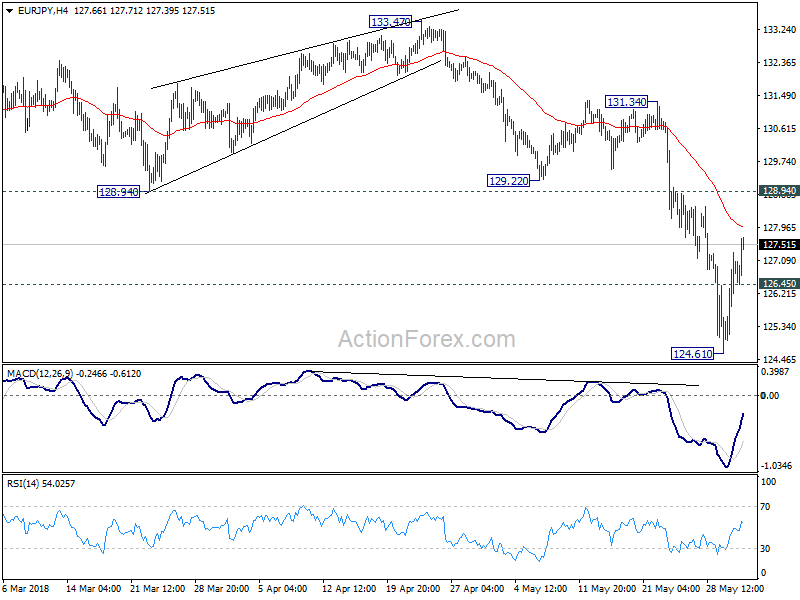
EUR/JPY's rebound from 124.61 is still in progress and further rise could be seen. But upside should be limited by 128.94 support turned resistance to bring fall resumption. On the downside, below 126.45 minor support will bring retest of 124.61 first. Break will resume whole fall from 137.49 and target next medium term fibonacci level at 119.90.
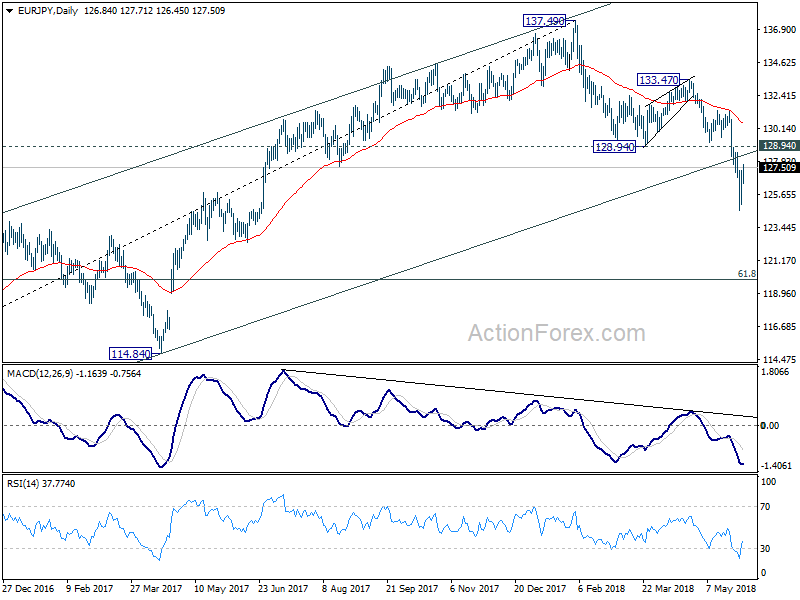
In the bigger picture, the case of medium term trend reversal continues to build up. That is rise from 109.03 (2016 low) could have completed at 137.49 already. This is supported by bearish divergence in daily MACD current downside acceleration, as well as the break of 38.2% retracement of 109.03 to 137.49 at 126.61. Deeper decline should be seen to 61.8% retracement at 119.90 and below. This will be the preferred case as long as 128.94 support turned resistance holds.
Markets Rally As Italian Worries Subside
Reports in the Washington Post today are suggesting that US President Trump plans to announce metal tariffs on Mexico, Canada and Europe set to come into force as early as tomorrow. The deadline for the EU’s relief from US tariffs expires tomorrow, June 1st. There has been a muted market reaction to the rumour but should it be officially announced volatility can spike higher as a result. USDMXN did react by selling off from 19.82115 to 19.71140.
The Italian President has told the Populist election winners that he is ready to engage with them when they are ready. This has given the Five Star Movement and League parties a second chance at attempting to form a government. The parties heavily criticised the President after he blocked their earlier cabinet nominations. Stocks were higher yesterday as Treasury yield rose with an easing in concerns when the Populist parties insisted that they have no plans to force Italy to leave the Euro or create an Italexit of the EU. EURUSD rallied from lows around 1.15000 to 1.16550 while the Italian stock market gapped higher from 21060.00 to close at 21855.00.
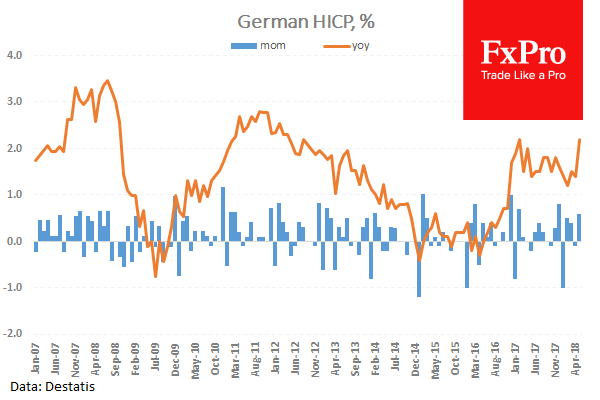
German Harmonised Index of Consumer Prices (YoY) (May) was 2.2% against an expected 1.8% from a prior reading of 1.4%. Harmonised Index of Consumer Prices (MoM) (May) was 0.6% against an expected 0.3% from a previous -0.1%. This data beat the previous reading on a yearly basis, bringing the data back in line with the high from early 2017. The beat in the monthly reading brings that data back above zero. EURGBP sold off from 0.87571 to 0.87320 following this data release.
US Gross Domestic Product Annualized (Q1) was 2.2% against an expected 2.3% from 2.3% previously. This data is holding just above 2.0% although it has slipped in the last two quarters from 3.3%. Gross Domestic Product Price Index (Q1) slipped to 1.9% against an expected 2.0% from 2.0% previously. This data has dropped back under 2% after rising above that level for the past two quarters. Personal Consumption Expenditures Prices (QoQ) (Q1) came in at 2.6% against an expected 2.7% from 2.7% previously. Core Personal Consumption Expenditures Prices (QoQ) (Q1) came in at 2.3% against an expected 2.5% from 2.5% previously. Personal consumption data has been rising steadily as Americans spend more on durable goods, consumer products and services. EURUSD moved higher from a low at 1.15940 to a high of 1.16754 as a result of this data. 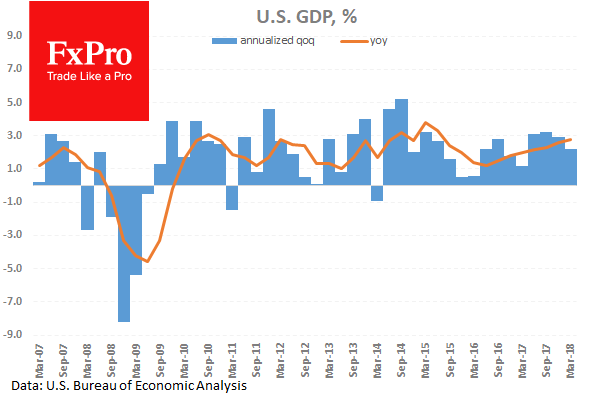
Bank of Canada Interest Rate Decision and Rate Statement were released yesterday evening. The Rate Decision was left on hold at 1.25% after the Bank hiked rates in January. The Rate Statement dropped the reference to being “cautious” on rates and on the need for “monetary policy accommodation”. It said higher rates will be needed to keep inflation near target. A gradual approach will be taken, guided by incoming data and assessment of the economy’s sensitivity to rate movements. USDCAD plunged from 1.30111 to a low of 1.28351 as a result. 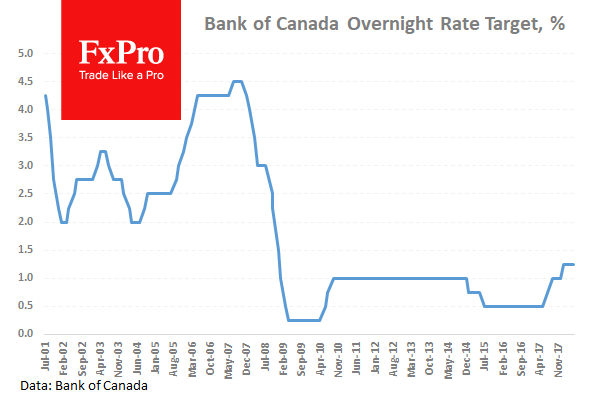
EURUSD is up 0.14% overnight, trading around 1.16778.
USDJPY is down -0.15% in the early session, trading at around 108.747
GBPUSD is up 0.18% this morning trading around 1.33076.
Gold is up 0.16% in early morning trading at around $1,303.25
WTI is down -0.25% this morning, trading around $68.06
EUR/GBP Daily Outlook
Daily Pivots: (S1) 0.8725; (P) 0.8755; (R1) 0.8813; More...
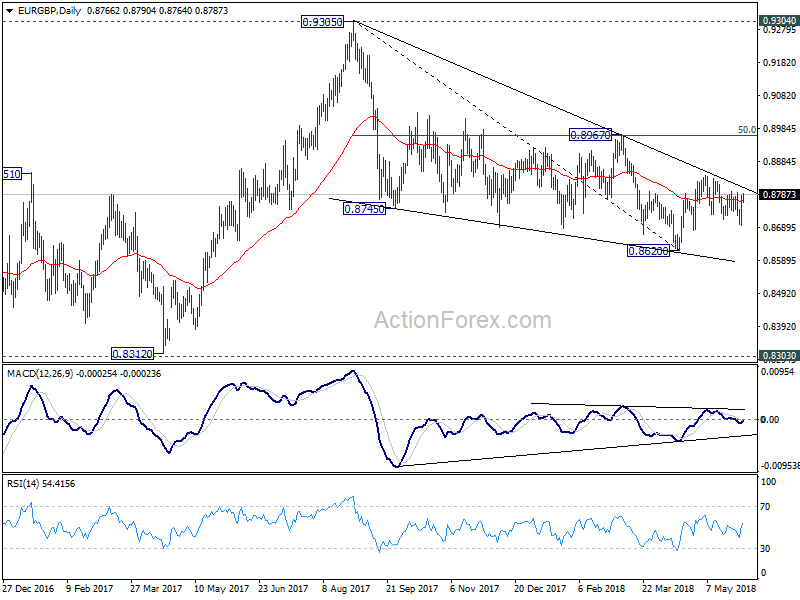
EUR/GBP rebounded after hitting 0.8693 and drew support from near term channel. But it's staying in range of 0.8679/8844. Intraday bias remains neutral first. On the upside, break of 0.8844 will resume the rebound from 0.8620. That will also revive the case of larger bullish reversal. EUR/GBP should target 0.8967 cluster resistance (50% retracement of 0.9305 to 0.8620 at 0.8963). On the downside, break of 0.8679 support will indicate completion of the rebound form 0.8620. And intraday bias will be turned back to the downside for this low.
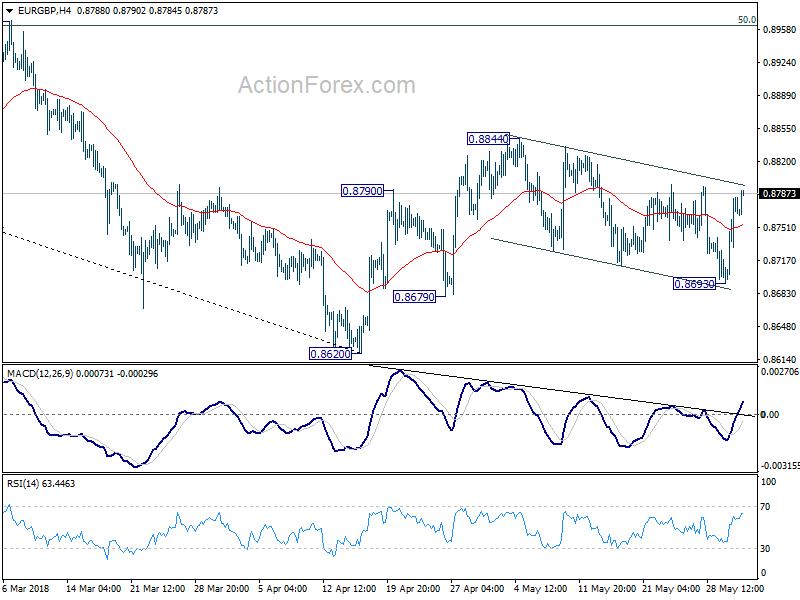
In the bigger picture, for now, the decline from 0.9305 is seen as a leg inside the long term consolidation pattern from 0.9304 (2016 high). Such consolidation pattern could extend further. Hence, in case of strong rally, we'd be cautious on strong resistance by 0.9304/5 to limit upside. Meanwhile, in another decline attempt, we'd expect strong support from 0.8116 cluster support (50% retracement of 0.6935 to 0.9304 at 0.8120) to contain downside.