Sample Category Title
EUR/CHF Daily Outlook
Daily Pivots: (S1) 1.1521; (P) 1.1576; (R1) 1.1606; More....
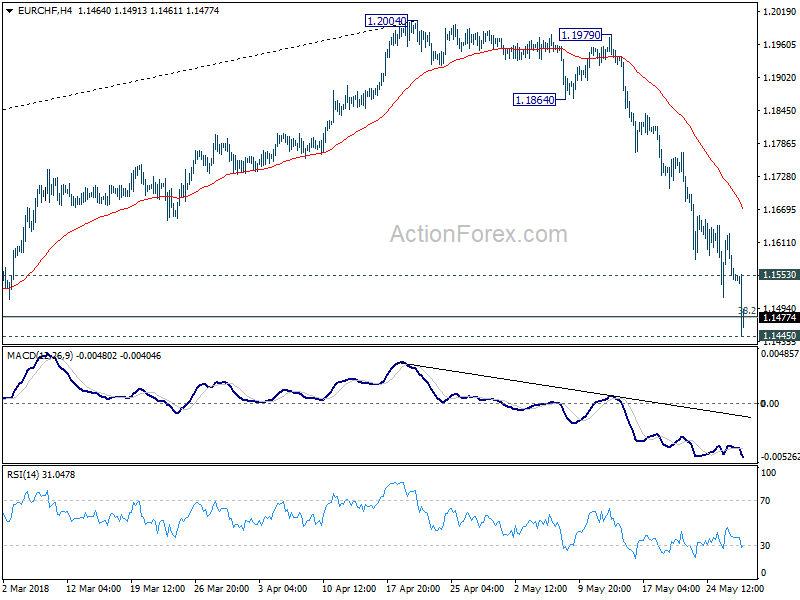
EUR/CHF"s fall resumes after brief consolidation and hits as low as 1.1445 so far. 1.1445 is seen as an important support and we'll see if it can hold. On the upside, above 1.1553 should indicate short term bottoming and turn bias back to the upside for stronger rebound. However, sustained break of 1.1445 will bring deeper decline to next key support zone between 1.11543 and 1.1198.
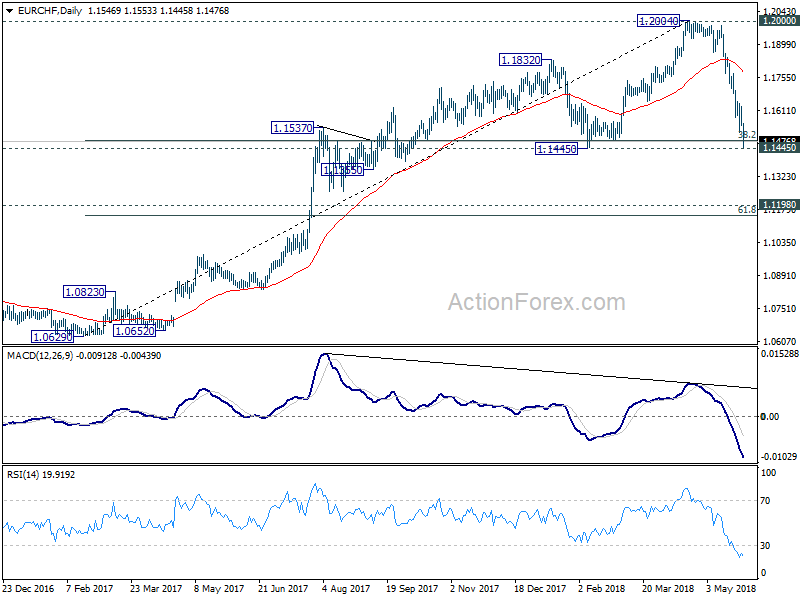
In the bigger picture, current development suggests solid rejection by prior SNB imposed floor at 1.2000. Considering bearish divergence condition in daily MACD, 1.2004 should be a medium term top. And price action from 1.2004 is correcting the up trend from 1.0629. The cross has met 1.1445 already, which is close to 38.2% retracement of 1.0629 to 1.2004 at 1.1479. We'd expect strong support from there to bring rebound to extend the medium term corrective pattern. However, sustained break of 1.1445 will target next key cluster level at 1.1198 (2016 high), 61.8% retracement of 1.0629 to 1.2004 at 1.1154.
EUR/CHF Downside Exposed
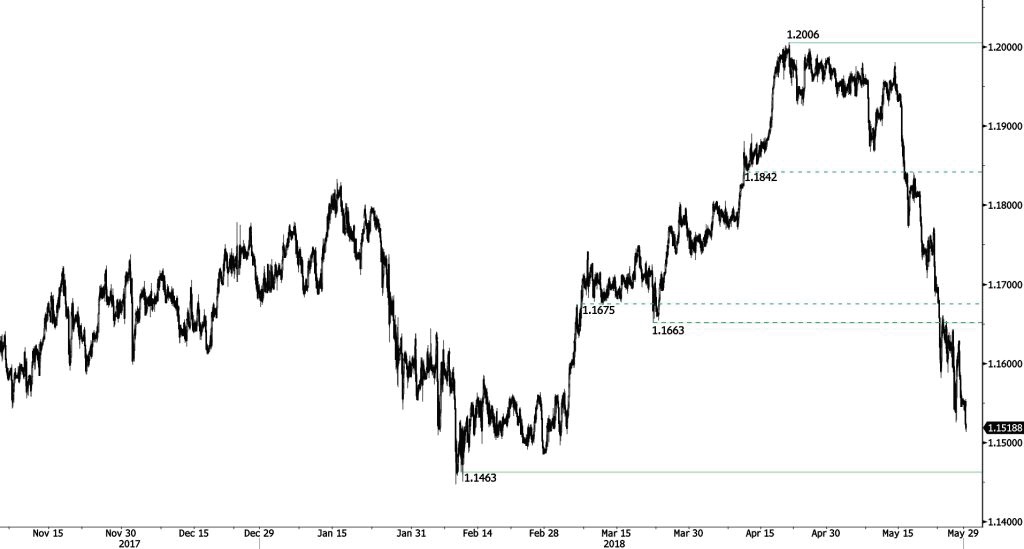
EUR/CHF has made new lows, confirming an underlying bearish trend. Break of support would suggest extension of bearish pressure to key support at 1.1463.
In the longer term, the technical structure has reversed. Strong resistance at 1.20 (level before the unpeg) is now at reach. The ECB's slowing QE program is likely to cause buying pressures on the euro, which should weigh in favour of the EUR/CHF. Support and resistance can be found at 1.0624 (24/06/2016 low) and 1.2097 (18/12/2014 high).
EUR/GBP Fall
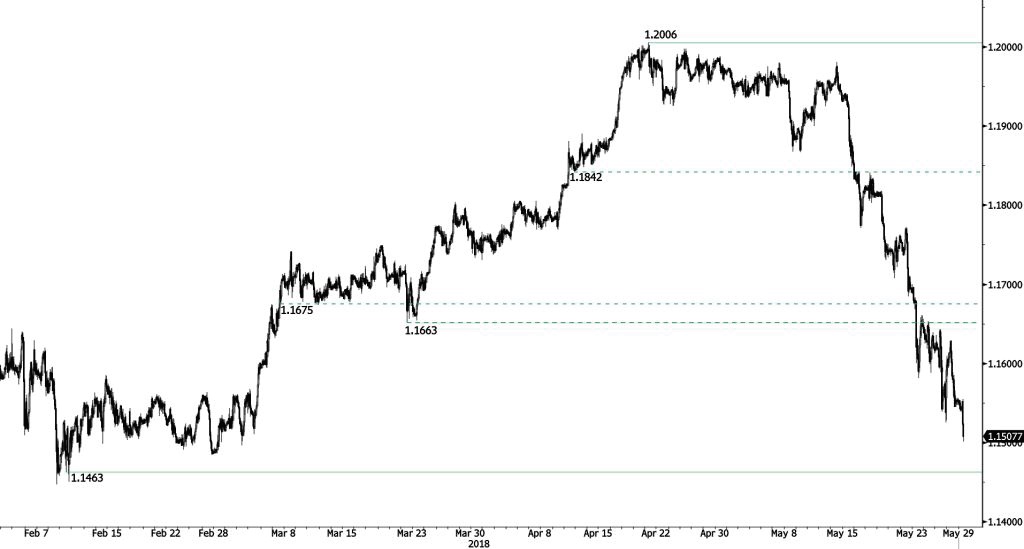
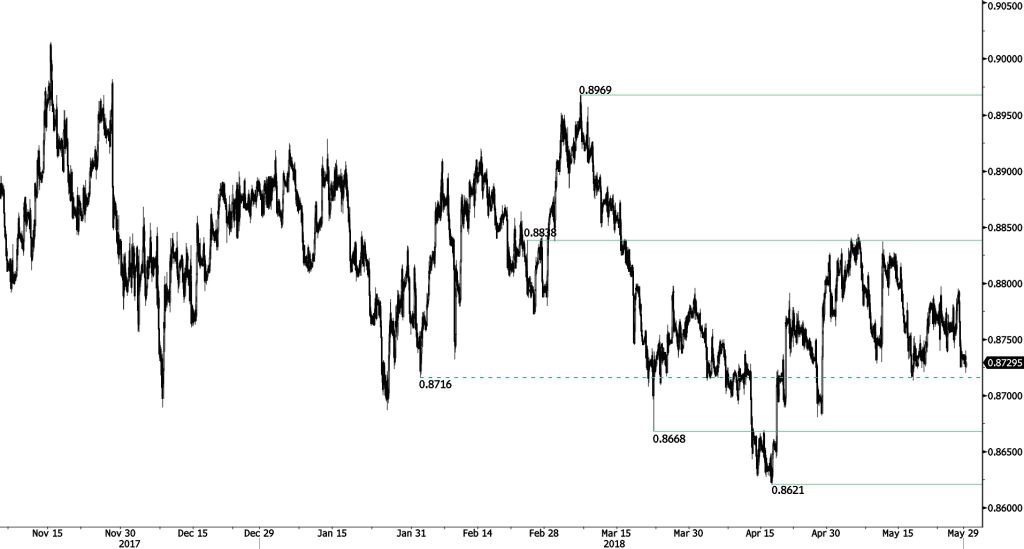
EUR/GBP is testing near downside range. Hourly support and resistance are given at 0.8668 (22/03/2018 low) and 0.8838 (23/02/2018 high). The technical structure suggests shortterm upward moves.
In the long-term, the pair has largely recovered from 2015 lows. The technical structure suggests further upside pressure. Strong resistance can be found at 0.9500 (psychological level) while support remains at 0.8304 (05/12/2016 low). The pair is trading below its 200 DMA.
AUD/USD Fading Bullish Momentum?
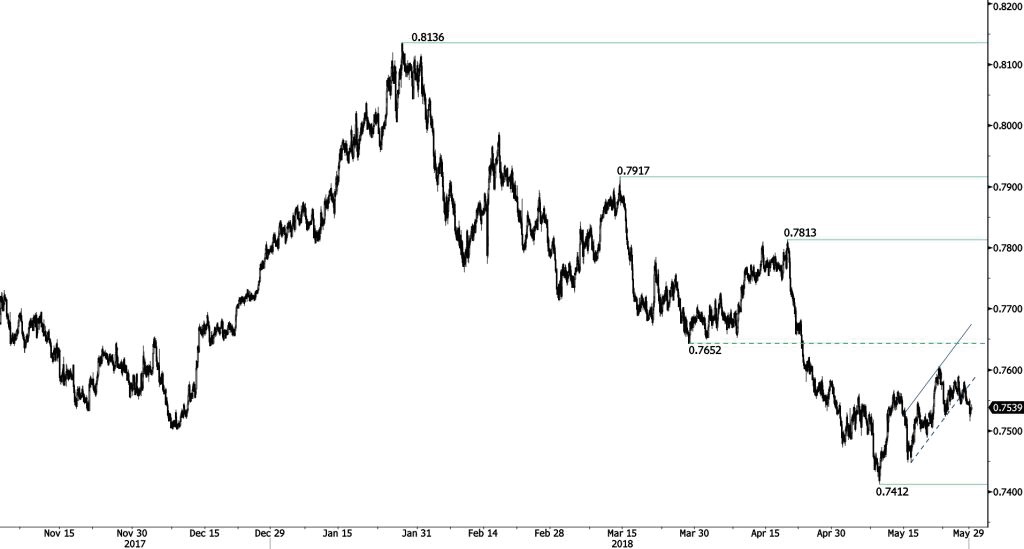
AUD/USD has recently only been able to make marginal new highs, suggesting a potential weakening momentum. Hourly support and resistance remain at 0.7412 (09/05/2018 low) and 0.7813 (19/04/2018 high). The technical structure suggests short-term increase.
In the long-term, the upward trend slows down after failing to reach key resistance at 0.8164 (14/05/2015 low). Key support stands at 0.6009 (31/10/2008 low). A break of the key resistance at 0.8164 (14/05/2015 high) is needed to invalidate our long-term bearish view.
USD/CAD Pause
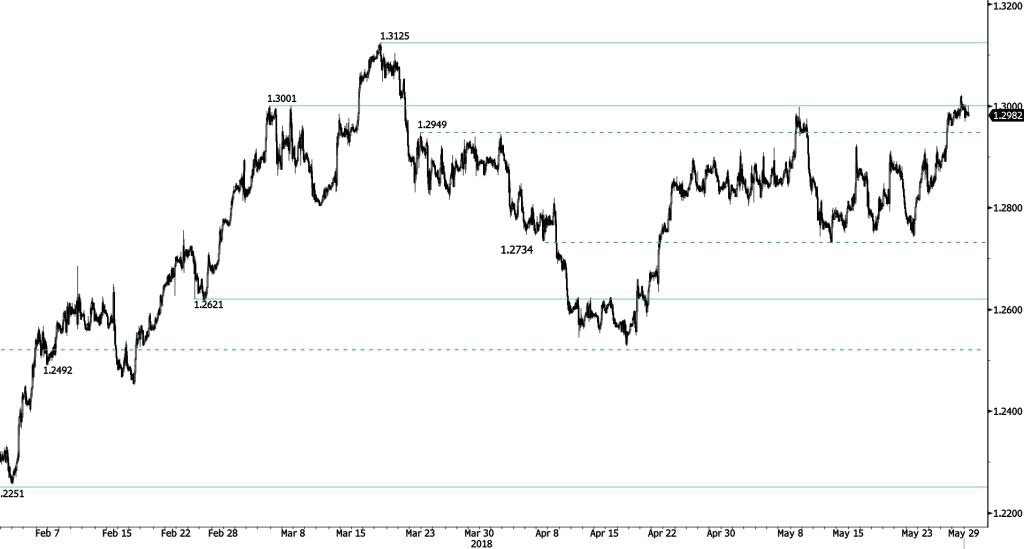
USD/CAD continues to improve as can be seen by the bullish move above minor resistance at 1.2949. Hourly support and resistance are given at 1.2621 (23/02/2018 low) and 1.3001 (05/03/2018 high). The technical structure suggests short-term upward moves.
In the longer term, the pair is trading between resistance point at 1.3805 (05/05/2017 high) and support at 1.2128 (18/06/2015 low). Strong resistance is given at 1.4690 (22/01/2016 high). The pair is likely to head lower. The pair is trading above its 200 DMA.
USD/CHF Trying To Bounce
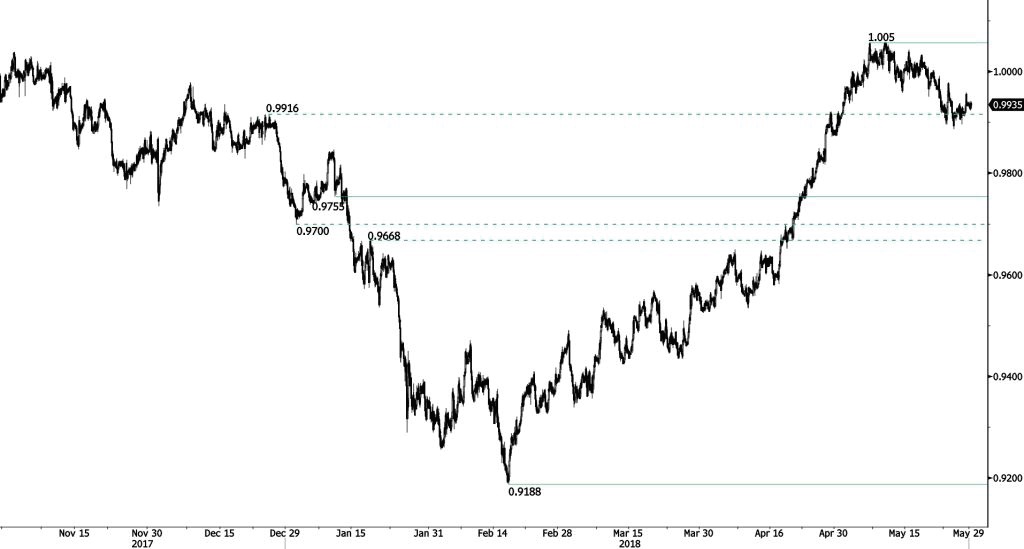
USD/CHF's has broken the support at 0.9916 (26/12/2017 high), validating a bearish reversal pattern with a downside risk at 0.9755. Key support and resistance given at 0.9755 (10/01/2018 low) and 1.0091 (09/05/2017 high) are maintained. The technical structure suggests short-term sideways trading moves.
In the long-term, the pair is still trading in range since 2011 despite some turmoil when the SNB unpegged the CHF. Key support lies at 0.9072 (07/05/2015 low) while resistance at 1.0344 (15/12/2016 high) is distanced. The technical structure favours a long term bullish bias since the unpeg in January 2015
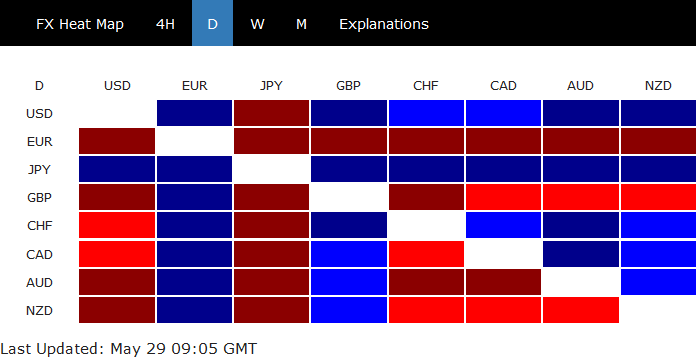
Yen extends powerful rally and German Italian yield spread hit highest since 2013
Yen extends its powerful rally in European session as the selloff in Italian bonds accelerate. Safe haven flow hammers German and US yields. The German-Italian spread has widened to the highest level since 2013.
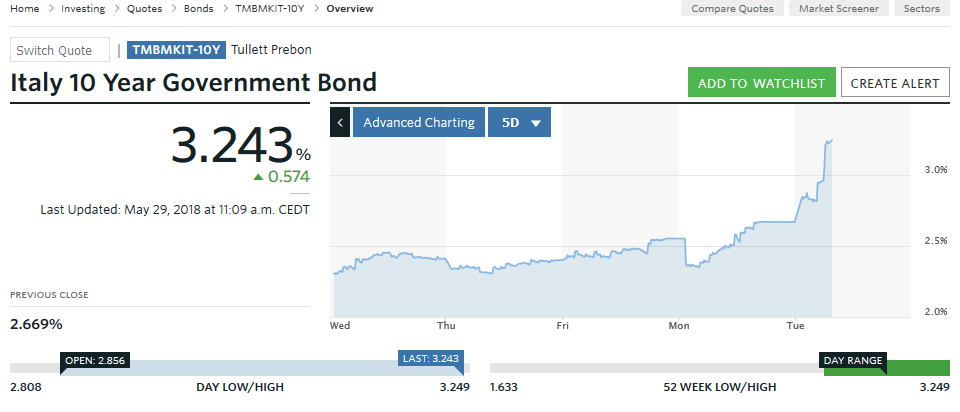
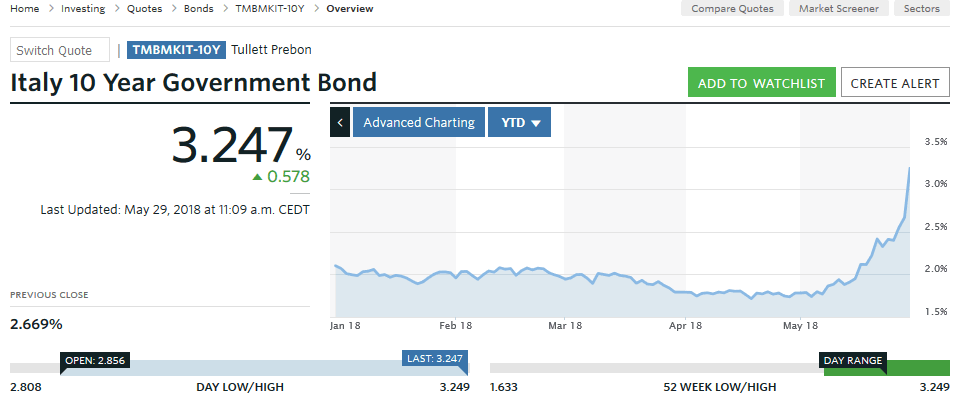
Italian 10 year government bond yield jumps to as high as 3.244 so far today, and it's currently up 0.577. It was as low as 2.386 yesterday and hit as low as 1.715 back in April. The steep acceleration shows markets are in deep worry about the political situation in Italy.
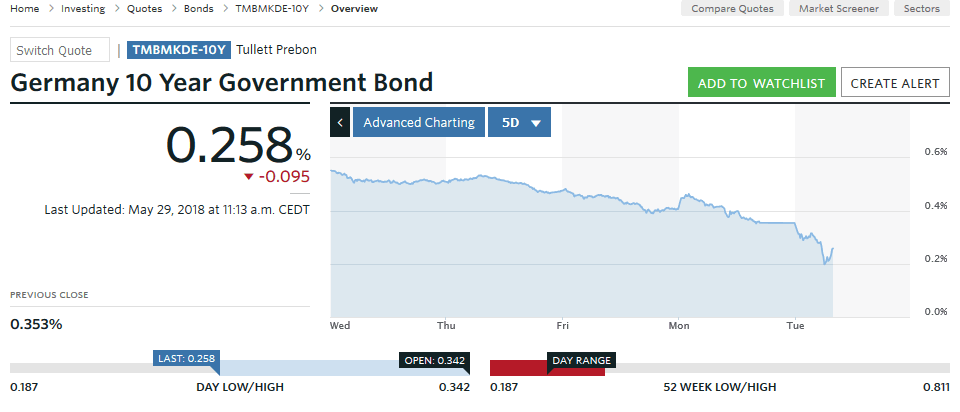
German 10 year bund yield, on the other hand, dropped to as low as 0.187 and is now down -0.095.
US 10 year yield also hit as low as 2.807 and is down -0.074.
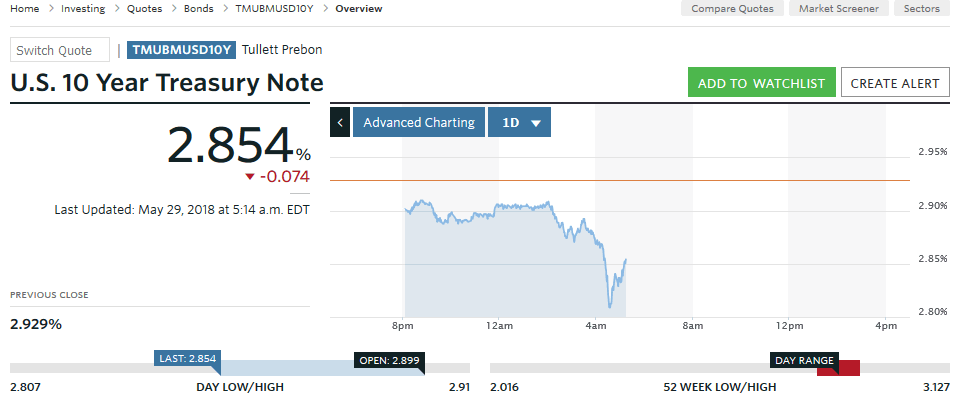 Charts taken from MarketWatch.com
USD/JPY Bearish Dip
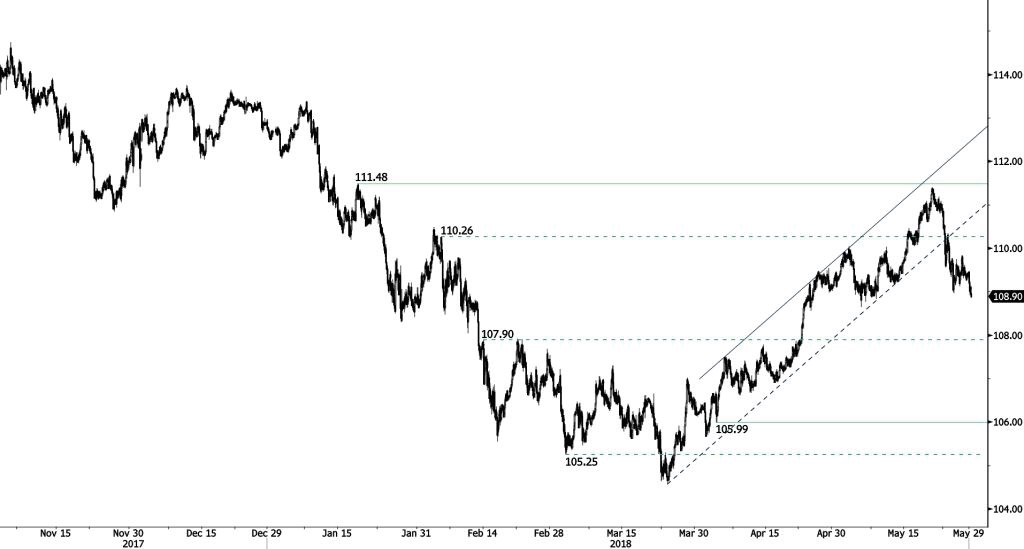
USD/JPY has breached the key uptrend support at 110.15 suggesting further downside. Strong support and resistance are located at 108.74 (25/01/2018 low) and 111.48 (18/01/2018 high). The technical structure suggests shortterm sideways trading moves.
We favor a long-term bearish bias. Support remains at 101.20 (09/11/2016 low). A gradual rise toward the major resistance at 125.86 (05/06/2015 high) seems unlikely. Expected to decline further support at 101.20 (09/11/2016 low). The pair trades slightly above its 200 DMA.
GBP/USD Breaks 200 Day MA
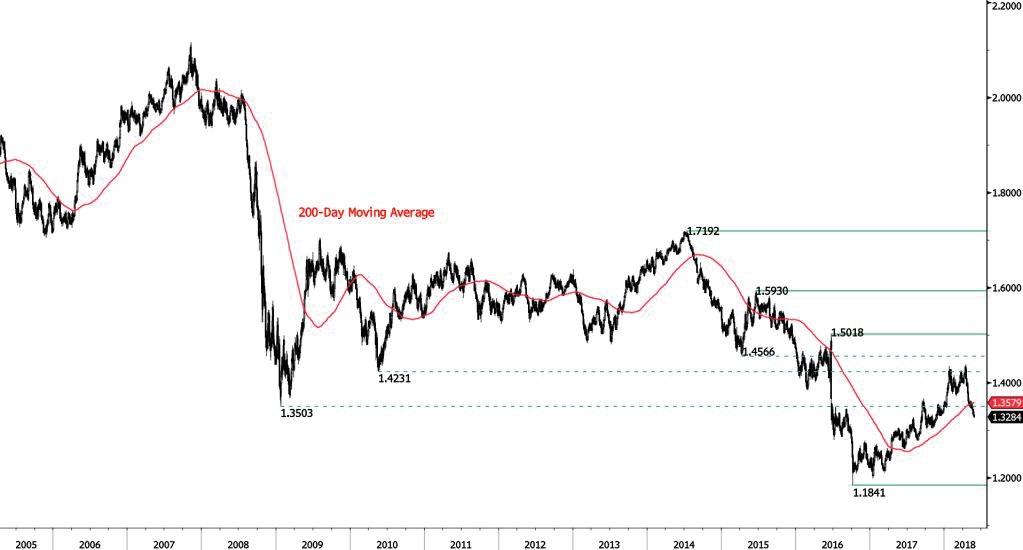
GBP/USD has broken to the downside out of the range defined by the support at 1.3503 (2008 low and 200d MA) . Further weakness towards the support at 1.3223 is favoured. Key support and resistance are given at 1.3068 (13/11/2017 low) and 1.3458 (11/01/2017 low. The technical structure suggests further downside.
The long-term technical pattern is reversing. The Brexit vote had paved the way for further decline but the pair is moving to 2016 highs. Long-term support and resistance are given at 1.1841 (07/10/2017 low) and 1.5018 (24/06/2016 high).
EUR/USD More Weakness
EUR/USD recovery bounce was short lived suggesting persistent selling pressure. The short-term technical structure is negative as long as prices remain below the hourly resistance at 1.2036 (11/01/2017 low). Next key support and resistance are now given at 1.1463 (12/02/2018 low) and 1.2323 (17/01/2018 high).
In the longer term, the momentum is turning largely negative. We favor a continued bearish bias. Key resistance is holding at 1.2886 (15/10/2014 high) while strong support lies at 1.1554 (08/11/2017 low).