Sample Category Title
WTI OIL Outlook – Consolidates Above Rising Daily Cloud But Outlook Remains Bearish On Fears Of Output Increase
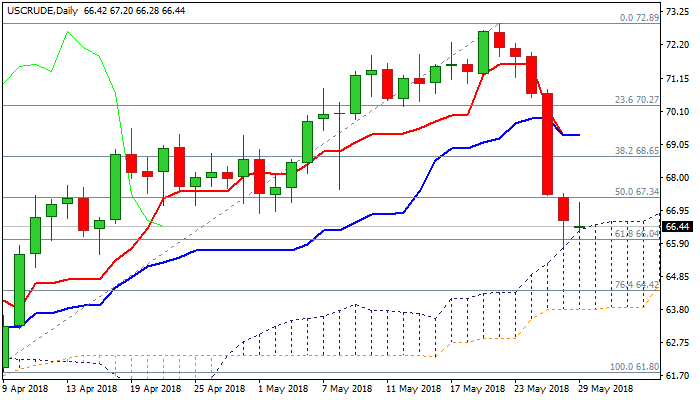
WTI oil remains in red on Tuesday and holding above six-week low at $65.76, posted last Friday, in extension of Thursday’s strong fall which marked the biggest one-day loss in one year.
Top of rising daily cloud contained fall from $72.89 (22 May peak) for now.
Concerns over increase in production by world top producers, Russia and Saudi Arabia, in order to ease potential shortage in oil market on reduced supplies from Iran and Venezuela, keep oil prices under strong pressure.
Bearish techs are boosted by strong build of bearish momentum and keep the downside in focus. Penetration of daily cloud (cloud top lies at $66.32) and close below cracked Fibo support at $66.04 (61.8% of $61.80/$72.89 ascend) would generate strong bearish signals for attack at 100SMA ($65.18) and Fibo 76.4% support at $64.42), which guards daily cloud base ($63.80).
Meanwhile, oil price may hold in extended consolidation, as slow stochastic is oversold. Broken rising 55SMA (67.08) so far capped upside attempts, but initial signal of stronger recovery could be expected on bullish close today, which could risk corrective upticks towards sideways-moving 30SMA ($69.50), before fresh push lower.
Res: 67.08, 67.49, 68.50, 69.00
Sup: 66.32, 66.04, 65.79, 65.18
CHF/JPY 4H Chart: Breakout Occurred
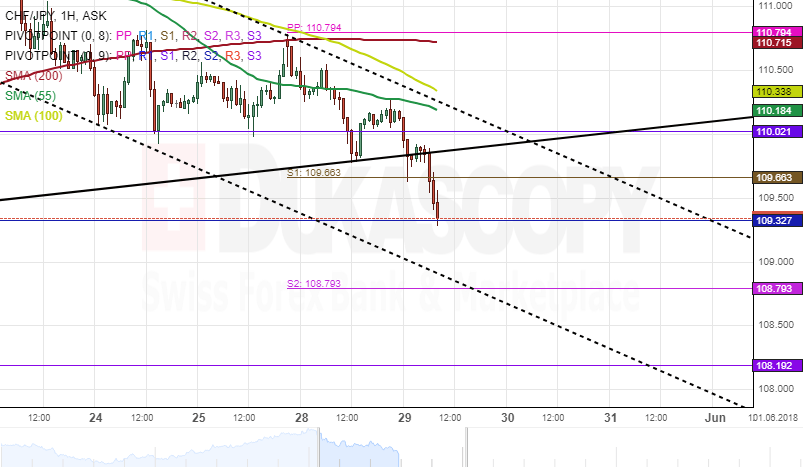
The Swiss Franc has begun to depreciate against the Japanese Yen after the currency pair tested the upper boundary of a dominant ascending channel on May 22.
After testing a resistance cluster formed by the combination of the 100– and 200– hour SMAs and the weekly pivot point at 110.79 on May 27, the exchange rate continues it bearish movement.
Given that a breakout has occurred through the lower boundary of the dominant ascending channel, the CHF/JPY currency exchange rate could be set for a long-term decline. In addition, the overall market sentiment is bearish.
GBP/JPY Daily Outlook
Daily Pivots: (S1) 145.16; (P) 145.79; (R1) 146.27; More...
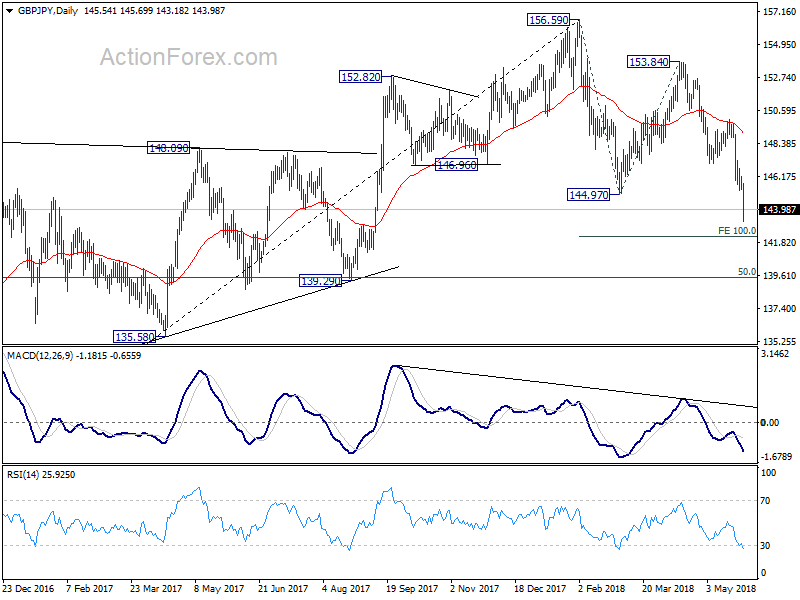
GBP/JPY drops to as low as 143.18 so far today. The solid break of 144.97 support confirms resumption of decline from 156.69. Intraday bias stays on the downside for 100% projection of 156.59 to 144.97 from 153.84 at 142.22 next. Brea there will target key cluster level at 139.29. On the upside, break of 147.04 support turned resistance is now needed to indicate short term bottoming. Otherwise, outlook will stay bearish in case of recovery.
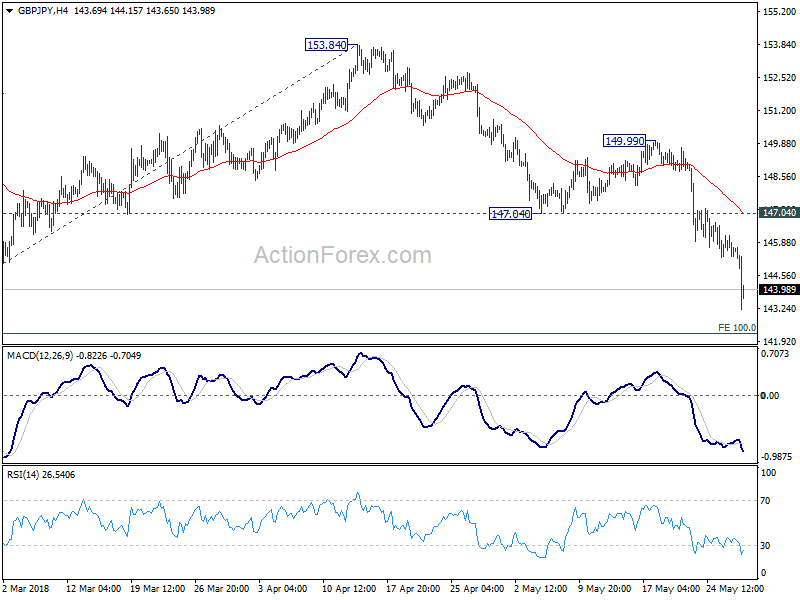
In the bigger picture, for now, we're treating price actions from 156.59 as a corrective move. Therefore, while deeper fall is expected, strong support should be seen above 139.29 cluster support (50% retracement of 122.36 to 156.59 at 139.47) to contain downside and bring rebound. There is still prospect of extending the rise from 122.36. However, considering that GBP/JPY failed to sustain above 55 month EMA (now at 153.94), firm break of 139.29 will confirm trend reversal and turn outlook bearish.
CAD/JPY 1H Chart: SMA Crossovers Signal
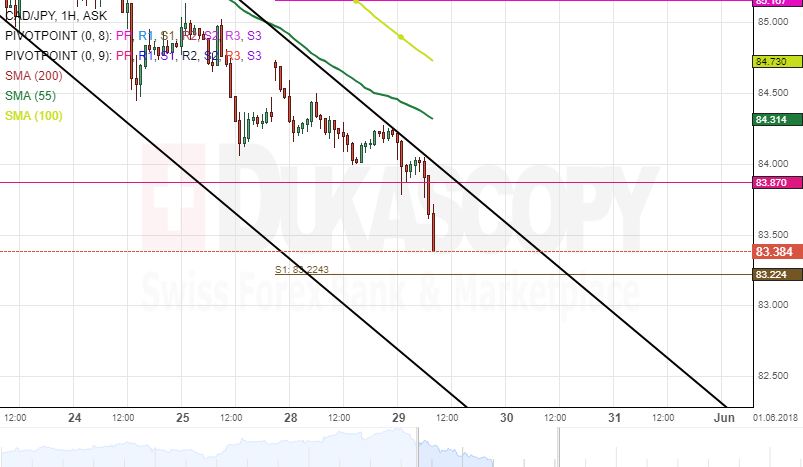
Following a reversal from the upper boundary of a dominant descending channel on May 22, the Canadian Dollar began a new move in a channel down against the Japanese Yen.
This move down could be considered to be a brief retracement. Also, the 55– hour simple moving average has been guiding the currency pair further south since the pair hit the up border of a junior pattern.
Given that the SMAs have crossed over above the price movement, this could signal a long-term decline for the CAD/JPY currency exchange rate. Meanwhile, traders should look for opportunities to trade the signals at SMA crossovers.
EUR/JPY Daily Outlook
Daily Pivots: (S1) 126.52; (P) 127.53; (R1) 128.19; More....
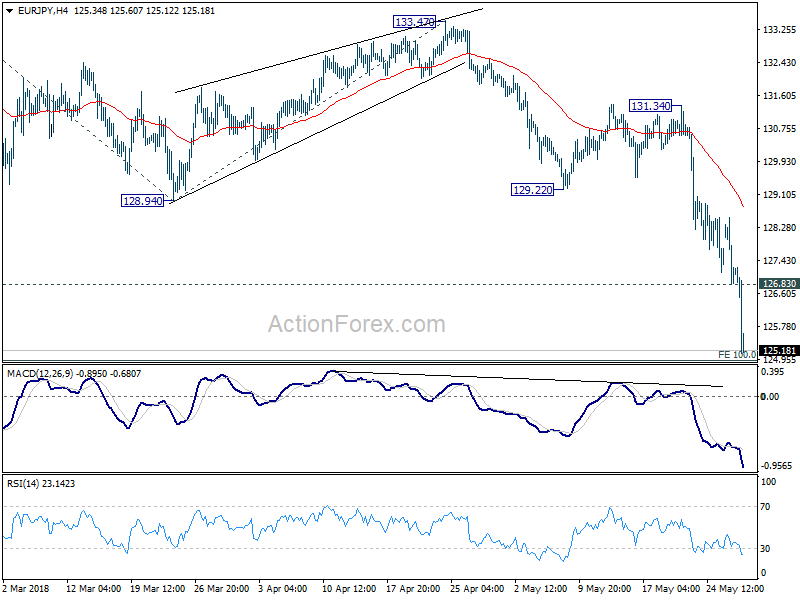
EUR/JPY's decline accelerates to as low as 125.09 so far today and takes out 126.61 medium term fibonacci level decisively. And, 100% projection of 137.49 to 128.94 from 133.47 at 124.92 is almost met without sign of bottoming. Intraday stays on the downside and break of 124.92 will target 161.8% projection at 119.63 next. On the upside, above 126.83 minor resistance will turn intraday bias neutral first.
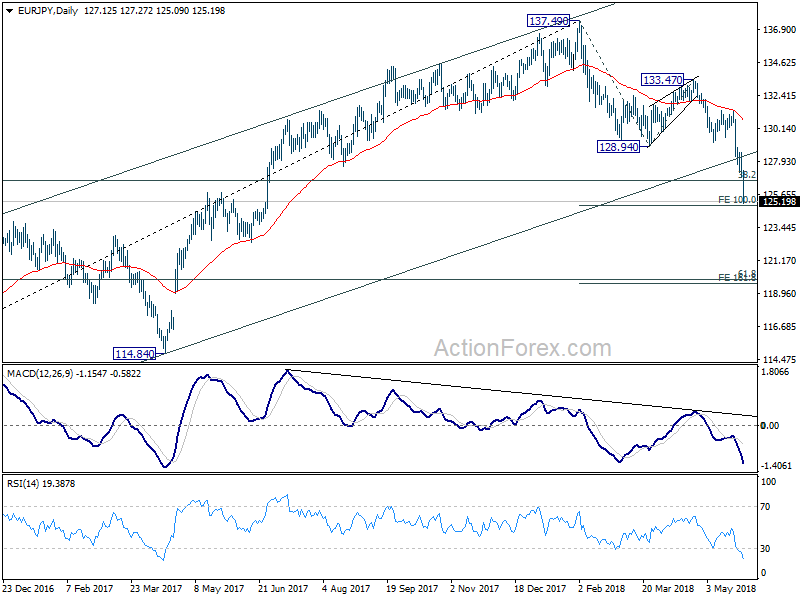
In the bigger picture, bearish divergence in daily MACD and current strong downside momentum is raising the chance of medium term trend reversal. Sustained break of 38.2% retracement of 109.03 to 137.49 at 126.61 now argues that whole up trend from 109.03 has completed at 137.49 already. And, deeper decline would be seen to 61.8% retracement at 119.90 and below. This will now be the preferred case as long as 128.94 support turned resistance holds.
Bitcoin Grinding Lower
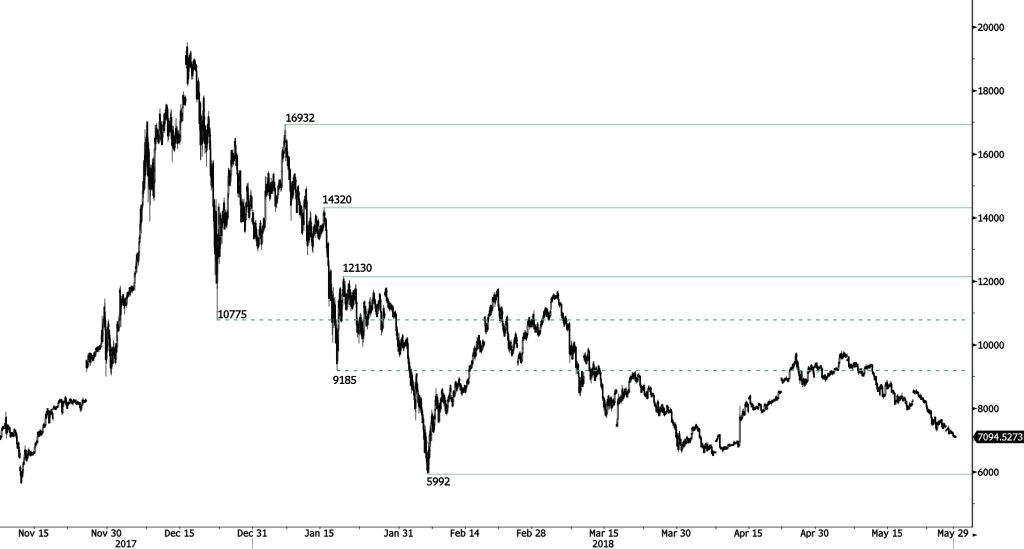
Bitcoin bullish momentum quickly faded suggesting persistent selling pressure. The pair is contained between strong support and resistance given at 6306 (13/11/2017 low) and 10232 (01/02/2018 high). The technical structure suggests short-term decrease.
In the long-term, the digital currency has had an exponential growth but also presented important downturns. There is decent likelihood that the currency could stabilize between 7'000 - 12'000 in 2018. Bitcoin is trading below its 200 DMA (8500 range).
CRUDE OIL Marginal Recovery Bounce
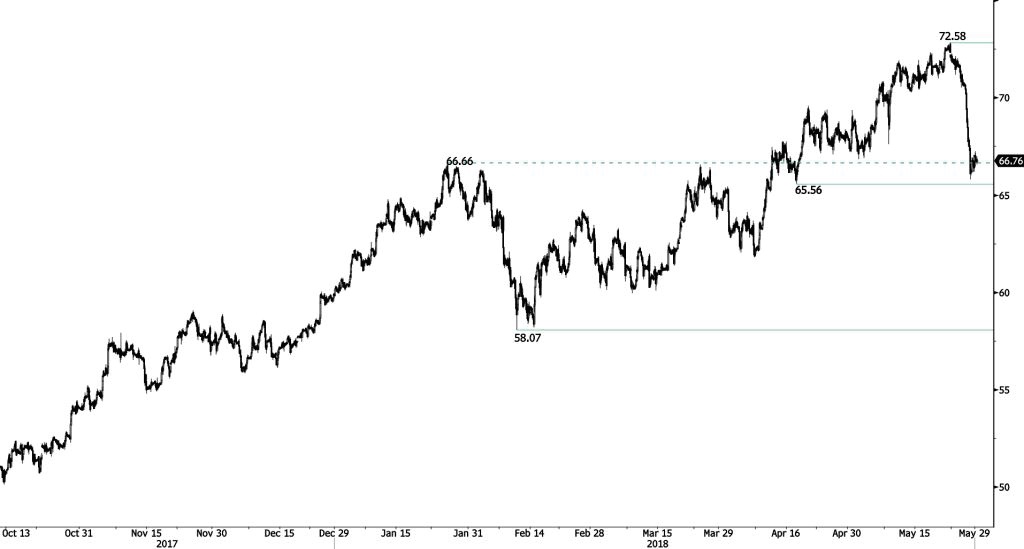
Crude oil has broken its support at 66.66 (25/01/2018 high), confirming a strong bearish momentum. Hourly support and resistance are given at 65.56 (17/04/2018 low) and 73.56 (28/11/2014 high). The technical structure suggests further short-term upward moves.
In the long-term, crude oil has recovered after its sharp decline last year. However, we consider that further weakness is very likely. For the time being, the pair lies in an upside trend since June 2017. Support lies at 42.20 (16/11/2016) while resistance is located at 77.83 (20/11/2014). Crude oil is trading largely above its 200 DMA.
SILVER Fading Demand
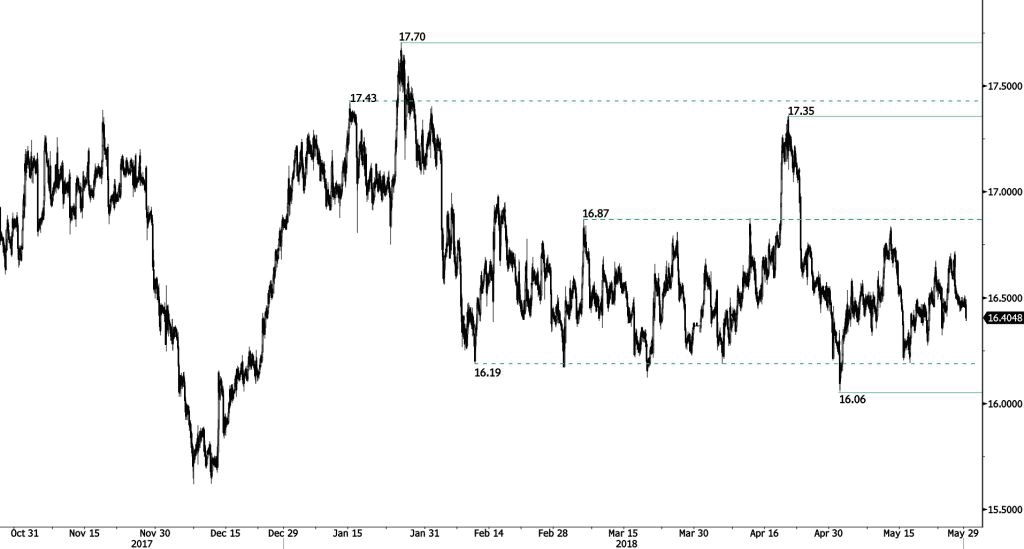
Silver is showing signs of weakness after moving below the support at 1.1754. However, the short-term succession of higher lows continues to favour a bullish bias. Hourly support and resistance are given at 16.05 (19/12/2017 low) and 16.87 (06/03/2018 high).
In the long-term, the trend remains negative/ sideways. Further downside is very likely. Resistance is located at 21.58 (10/07/2014 high). Strong support can be found at 11.75 (20/04/2009). The pair is trading below its 200 DMA.
EUR/GBP Daily Outlook
Daily Pivots: (S1) 0.8702; (P) 0.8750; (R1) 0.8779; More...
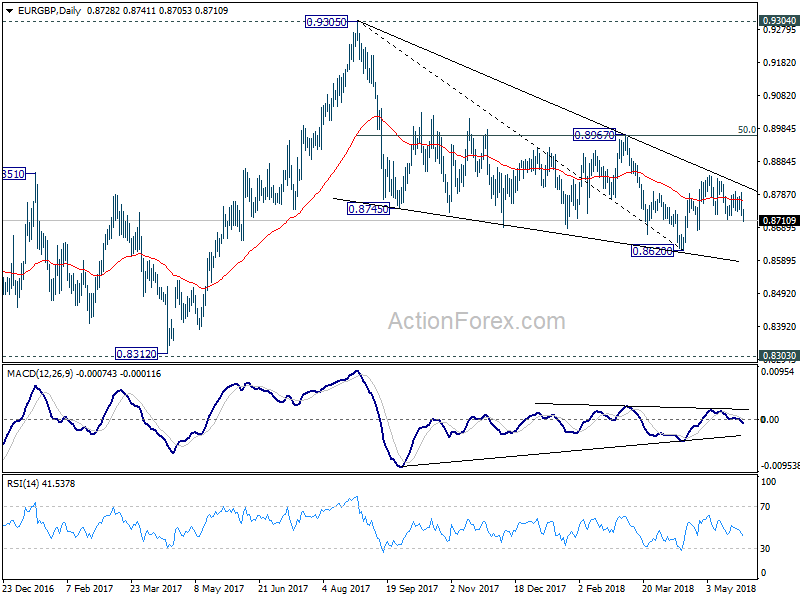
EUR/GBP's break of 0.8712 now put focus on 0.8679 support. Break there will indicate completion of the rebound form 0.8620. And intraday bias will be turned back to the downside for this support. Whole decline from 0.9305 will likely be resuming too. On the upside, break of 0.8844 will resume the rebound from 0.8620. That will also revive the case of larger bullish reversal. EUR/GBP should target 0.8967 cluster resistance (50% retracement of 0.9305 to 0.8620 at 0.8963).
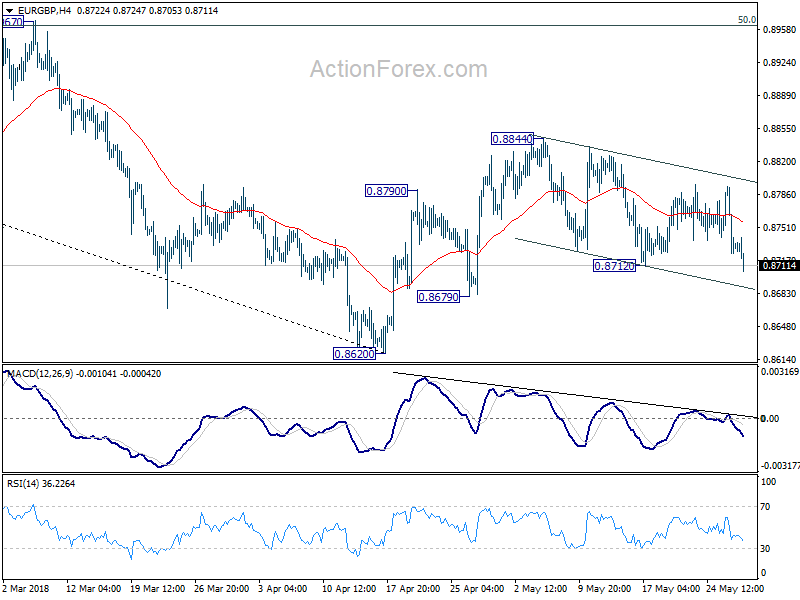
In the bigger picture, for now, the decline from 0.9305 is seen as a leg inside the long term consolidation pattern from 0.9304 (2016 high). Such consolidation pattern could extend further. Hence, in case of strong rally, we'd be cautious on strong resistance by 0.9304/5 to limit upside. Meanwhile, in another decline attempt, we'd expect strong support from 0.8116 cluster support (50% retracement of 0.6935 to 0.9304 at 0.8120) to contain downside.
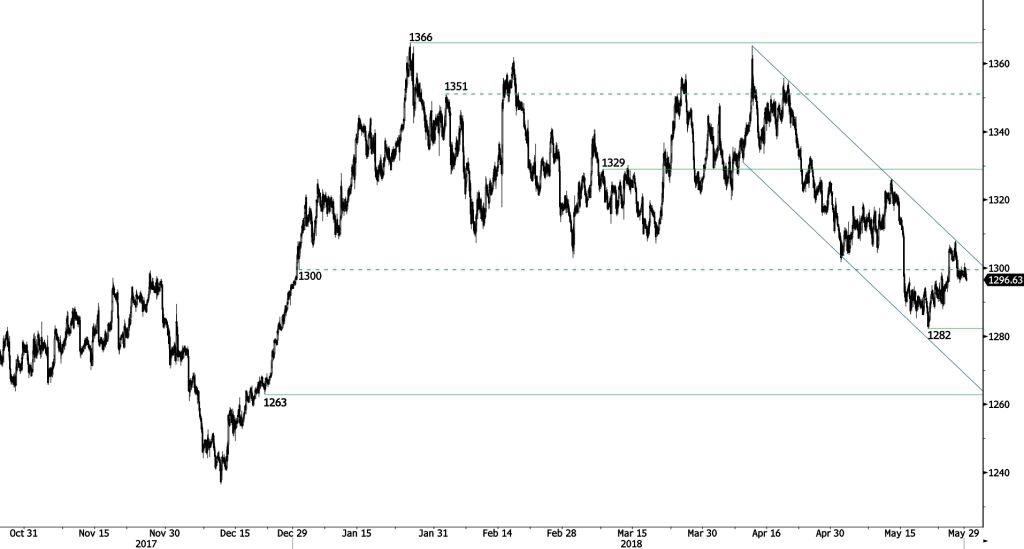
GOLD Fading Near The Key Resistance At 1255
Gold's rally was halted by downtrend resistance. at 1308. Hourly support and resistance are given at 1263 (21/12/2017 low) and 1329 (08/03/2018 high). The technical structure suggests short-term downward moves.
In the long-term, the technical structure suggests that there is a growing upside momentum. A break of 1'392 (17/03/2014) is required to confirm it. A major support can be found at 1'045 (05/02/2010 low). The pair is trading below its 200 DMA