

Sample Category Title
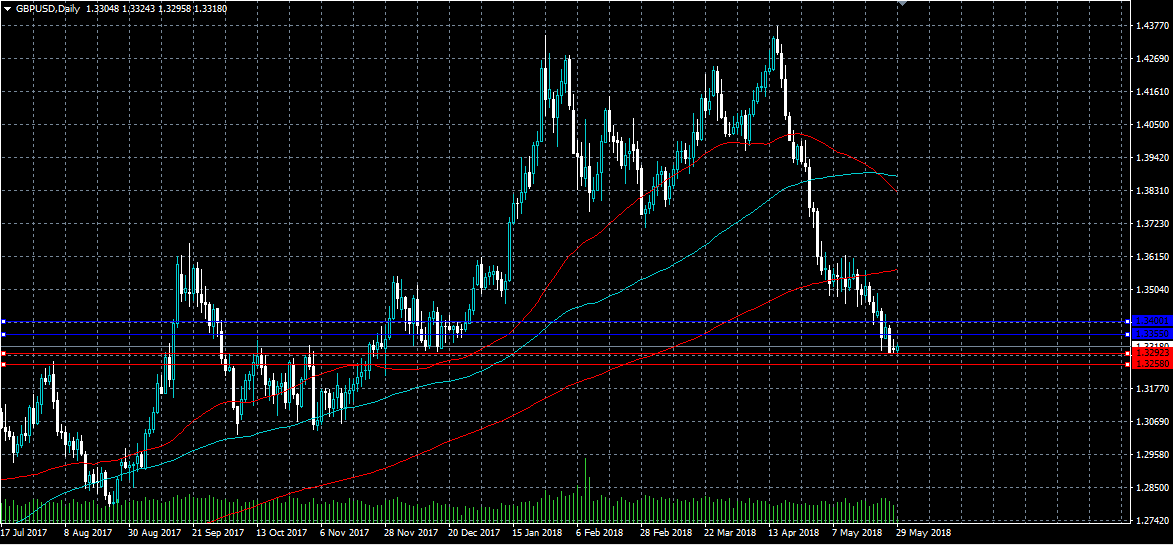
GBPUSD Downside To Extend Below 1.3292
The British pound remains under downside pressure against the US dollar, as the greenback firms above the 94.00 level and Brexit uncertainties persist. The GBPUSD pair currently trades close to the 1.3300 level, with sterling selling likely to accelerate once again if the 1.3292 support level is broken. With a lack of macroeconomic news from the United Kingdom today, the US dollar index is likely to dictate intraday moves in the pair.
The GBPUSD pair is strongly bearish while trading below the 1.3300 level, key intraday support is located at the 1.3292 and 1.3258 levels.
If the GBPUSD pair holds above the 1.3300 level, we may see price bounce towards the 1.3355 and 1.3400 resistance levels.
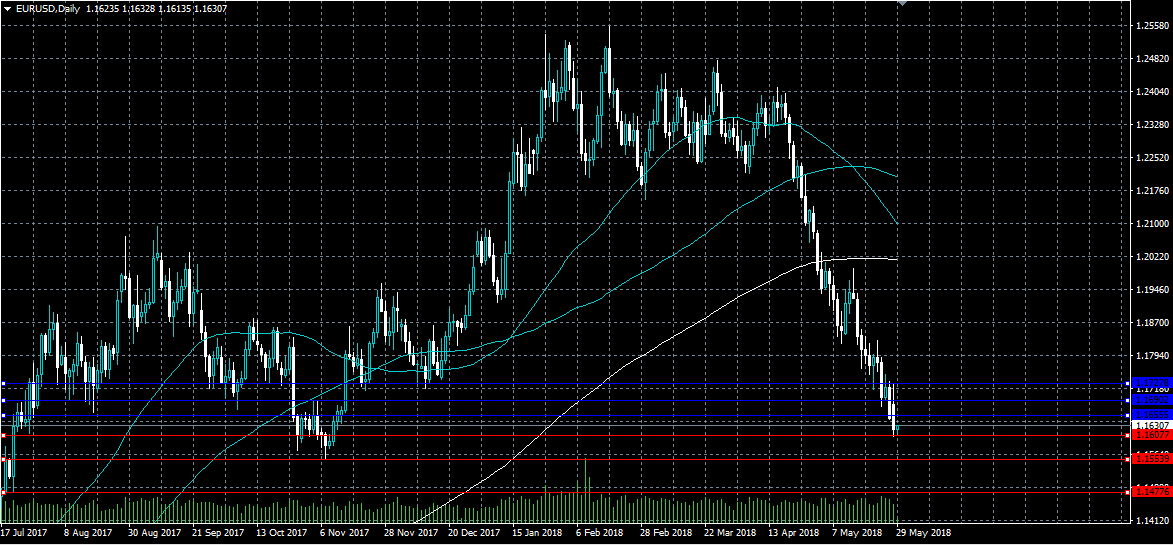
EURUSD Remains Strongly Intraday Bearish
The euro has moved to a fresh yearly-low against the US dollar, hitting 1.1607, as Italian and Spanish political concerns cause traders to move away from the single currency and into greenbacks. The EURUSD pair currently trades around the 1.1630 level, with selling likely to intensify if sellers breach the 1.1607 handle. Traders continue to remain focused on rising Italian bond yields and the intraday direction of the US dollar index.
The EURUSD pair is intraday bearish while trading below the 1.1655 level. Key support is located at the 1.1607 and 1.1553 levels.
If the EURUSD pair moves above the 1.1655 level, we may see a technical correction back towards the 1.1692 and 1.1727 levels.
Bitcoin Bears Remain In Control As Price Approaches $7,000
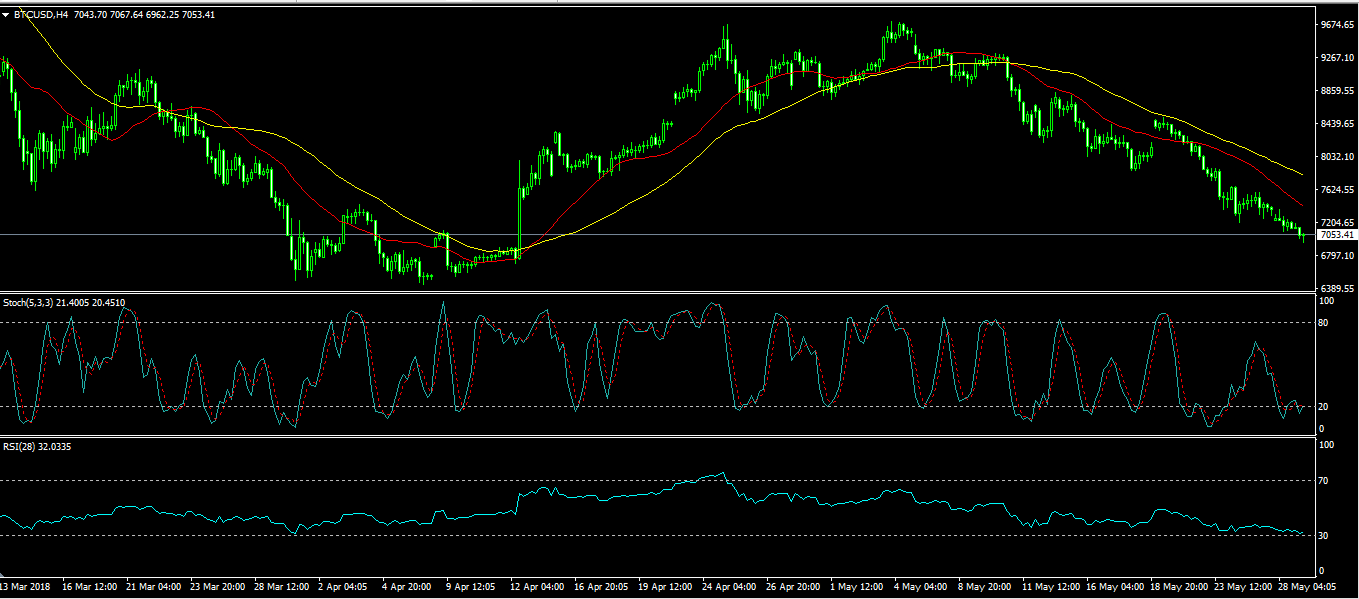
In April, the price of bitcoin rose from a low of $6,400 to a monthly high of $9,710. In May, the BTC/USD pair has lost almost 30% of its value and is currently trading at close to $7,000.
The decline had been attributed to the disappointing Consensus event in New York and an investigation launched by the United States Department of Justice (DOJ) into bitcoin price manipulation.
Investigators will look at whether bitcoin holders or exchanges have been manipulating bitcoin prices to move higher or lower and will focus on practices such as spoofing (filling the market with fake orders in a bid to encourage others to buy and sell coins) and wash trading (trading with yourself to give the impression of a high market demand). The DOJ is reportedly working alongside the Commodity Futures Trading Commission (CFTC).
Of course, manipulation within the crypto world is not new. It happens all the time. It has been reported that bitcoins are owned by very few people. This gives the holders an incentive to keep pushing the prices higher. This is in contrast to the stock markets where stock holders with a large stage are subjected to scrutiny particularly with regards to reporting. In the crypto space, there are no such rules giving holders a reason to push prices up.
The BTC/USD pair is currently trading at $7051. The pair is trading below the 25 and 50-day moving average. Its Stochastic and Relative Strength Index (RSI) are all in the oversold territory on the four-hour chart as shown below. As such, after hitting the support of $7,000, the pair could start moving up. It could also continue the downward momentum to test the $6400 support.
Data Flows Pick Up On Tuesday
After a slow start to the week, investors can expect a steady increase in economic reporting on Tuesday. US and European data releases will make headlines ahead of what's expected to be a highly active second half of the week.
The first major report is scheduled for 06:00 GMT when the Swiss government unveils its latest trade figures. Switzerland's trade surplus is forecast to rise sharply for the month of April, highlighting improved trade flows in the European region.
About 45 minutes later, France's INSEE agency will report on consumer confidence. The May index is forecast to weaken slightly from the previous month.
Shifting gears to Italy, reports on consumer and business confidence will make their way to investors at 08:00 GMT. The consumer confidence gauge is projected to fall slightly for May while business confidence likely rose.
On the monetary policy front, a pair of European Central Bank (ECB) officials will deliver speeches on Tuesday. Yves Mersch is scheduled to speak at 10:30 GMT. Later in the day, Sabine Lautenschlager will also deliver remarks.
Shifting gears to the United States, S&P and Case-Shiller will report on the monthly home price indices, which provide a snapshot of residential property values across major cities. The headline indicator is expected to show year-over-year growth of 6.4% for March after home values rose 6.8% the month before.
At 14:30 GMT, the Federal Reserve Bank of Dallas will release its manufacturing business index for the month of May. The indicator is expected to print 23.3, up from 21.8 the previous month.
The Reserve Bank of New Zealand's Financial Stability report will be released on Tuesday for traders in North America. In New Zealand time, the report falls on a Wednesday.
EUR/USD
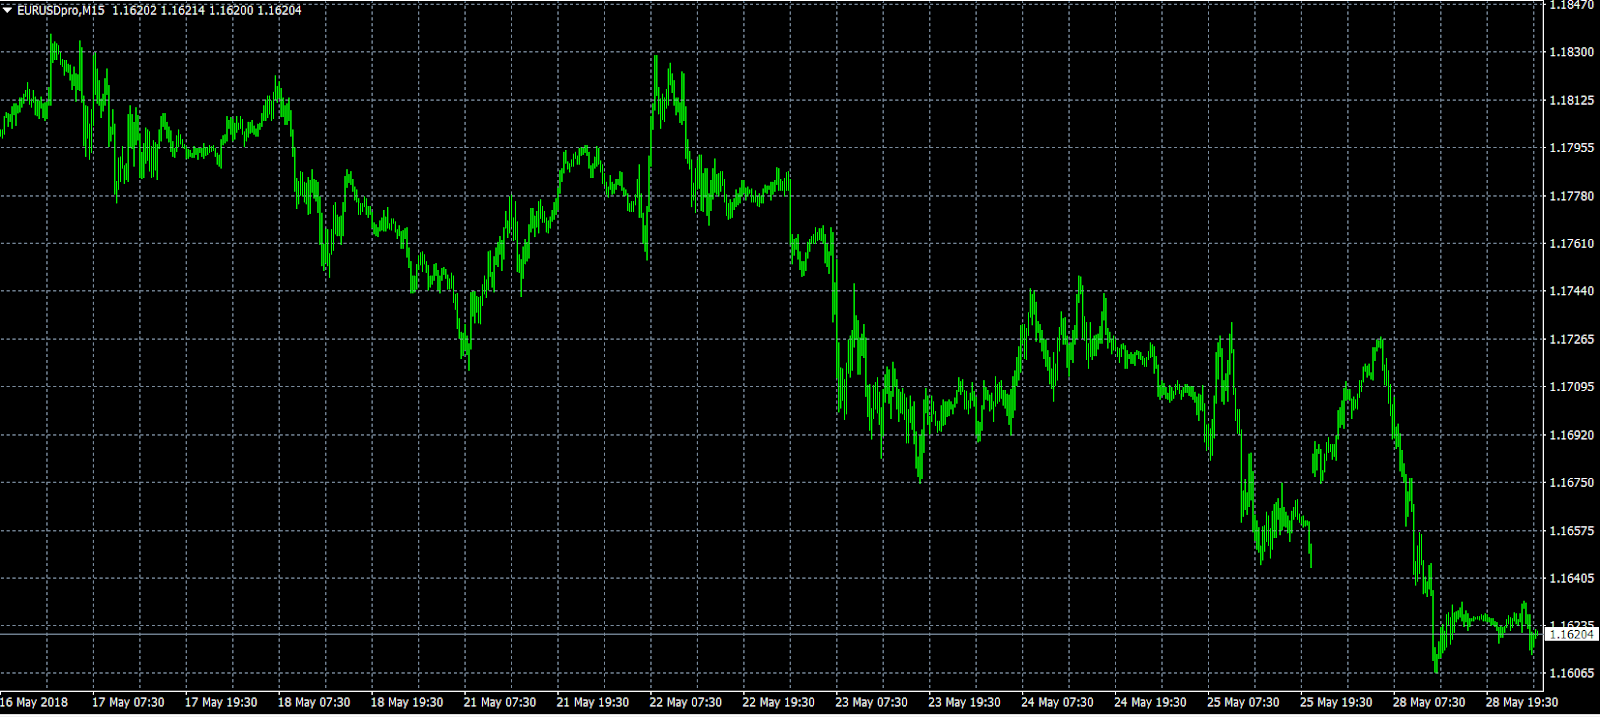
The euro's recovery attempt came up short on Monday, as prices crashed back down to new yearly lows. EUR/USD touched an intraday high of 1.1729 before plunging more than 100 pips all the way down to 1.1612. At the time of writing, the pair was trading at 1.1621. Immediate support is now located at 1.1600. Resistance is seen above 1.1700.
GBP/USD
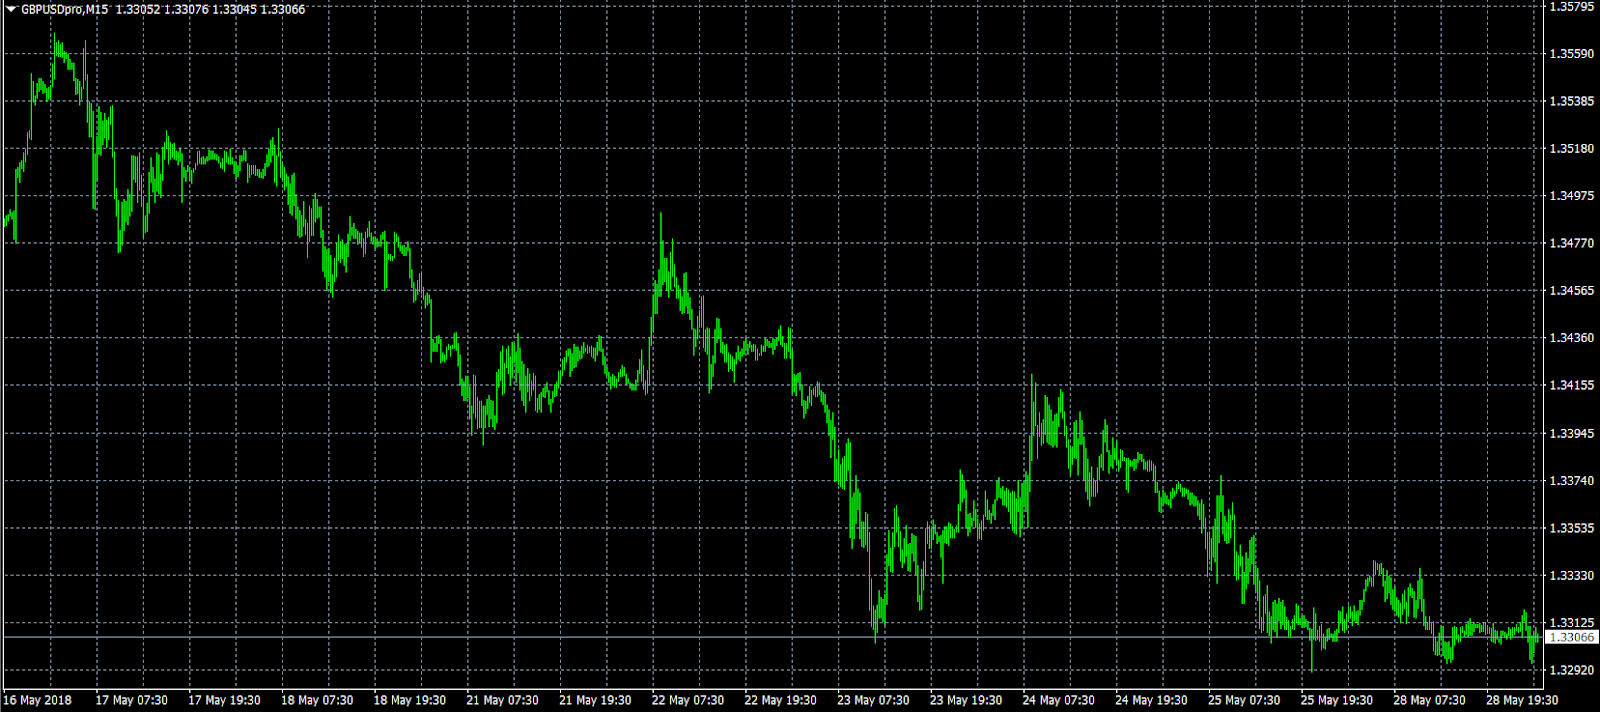
Cable also succumbed to bearish pressure at the start of the week, as prices failed to maintain intraday highs. GBP/USD was last seen trading in the low 1.3300 region, where it faces immediate support at 1.3280. Below that level, the next target is 1.3245. On the opposite side of the spectrum, resistance is likely found at 1.3340, followed by 1.3385.
NZD/USD
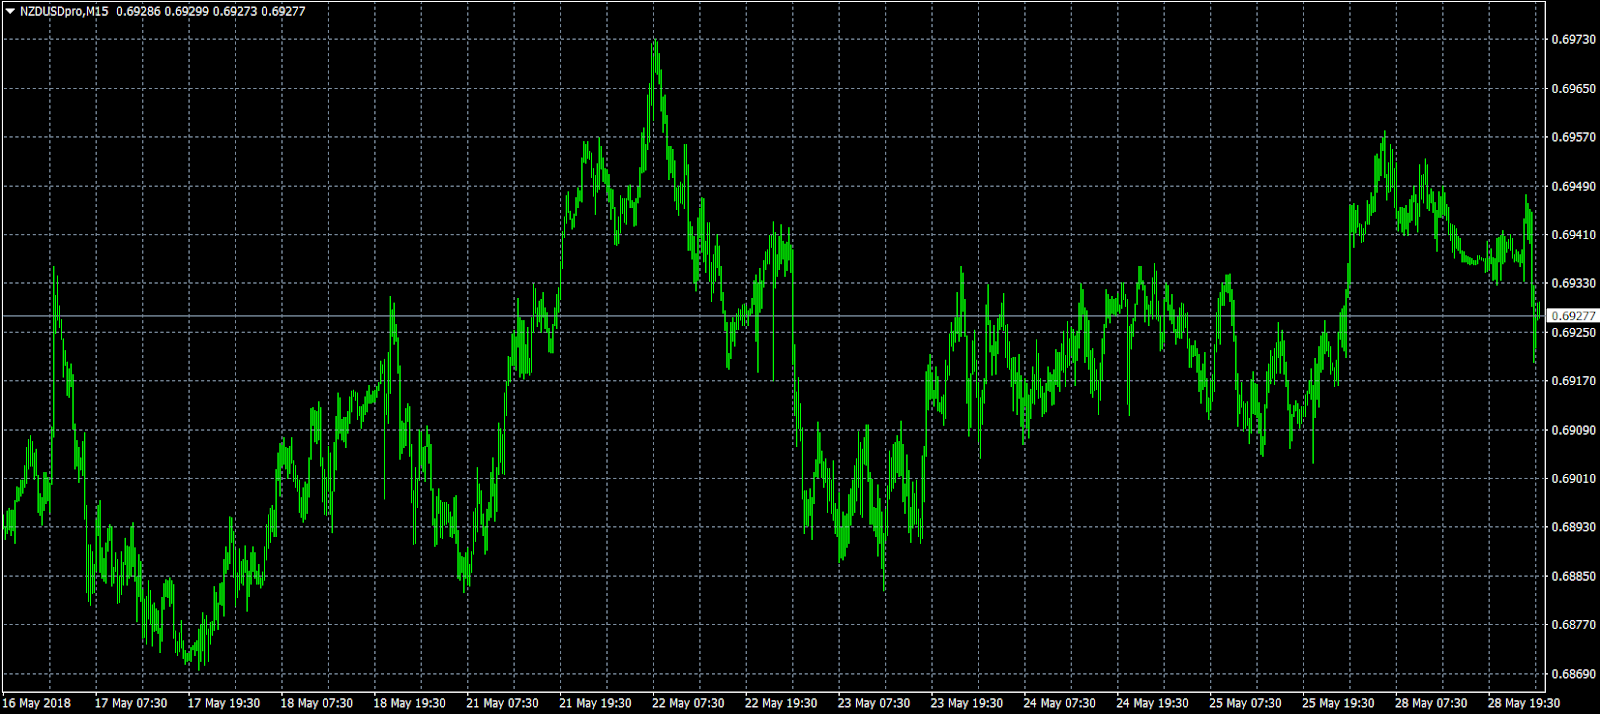
The New Zealand dollar edged lower against its US counterpart Tuesday, as prices fell 0.2% to 0.6929. Prices had reached an intraday high of 0.6960. NZD/USD faces an immediate hurdle at 0.6970. On the support side, the first target is 0.6939.
USD/JPY Bearish Breakout Challenges Key 109 Support Line
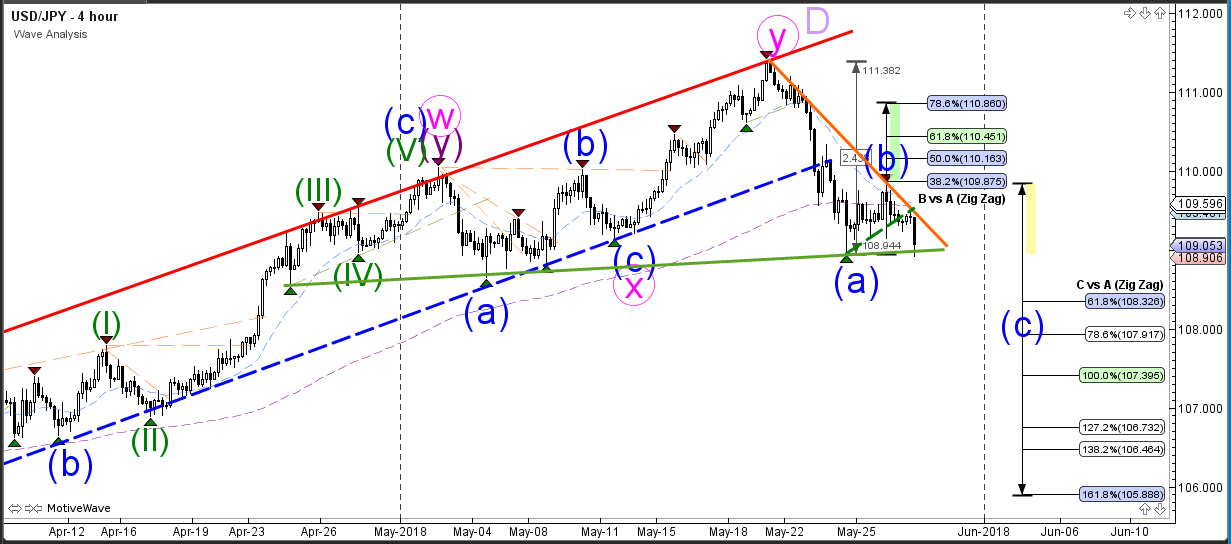
The USD/JPY broke below the support trend line (dotted green) but price still needs to break the bottom (green line) before a continuation within C (blue) becomes more likely. In that case a fall towards the Fib targets of wave C could occur whereas a bullish bounce could indicate that price could retrace deeper within wave B (blue) and move higher towards the Fibonacci retracement levels.
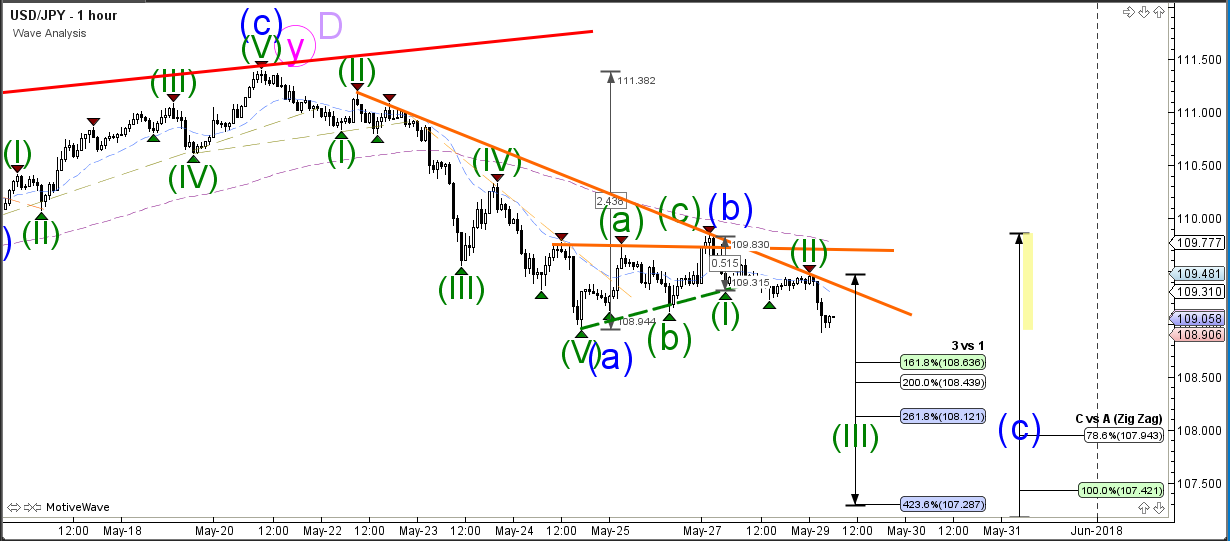
The USD/JPY seems to be building up bearish momentum as long as price stays below the resistance trend lines (orange). Price needs to break below the support trend line mentioned on the 4 hour chart before a wave 3 continuation becomes more likely.
EUR/USD Bearish Momentum Challenges 1.16 Support And Chart Patterns
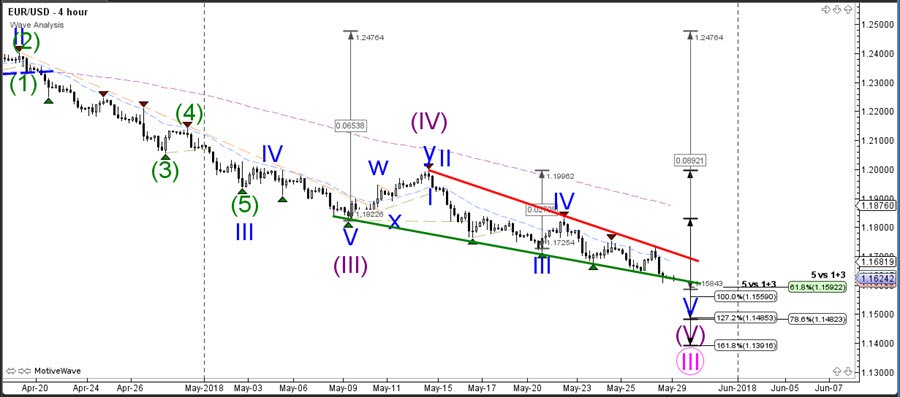
The EUR/USD bounced at the resistance trend line of the falling wedge reversal chart pattern yesterday and made a new lower low. Price now needs a bearish break below the wedge before a continuation towards 1.1450-1.1550 is possible and likely.
A strong bullish bounce could indicate the end of the wave 3 (pink) and the start of a larger wave 4correction whereas a bearish breakout could indicate the continuation of the downtrend towards the Fibonacci target levels.
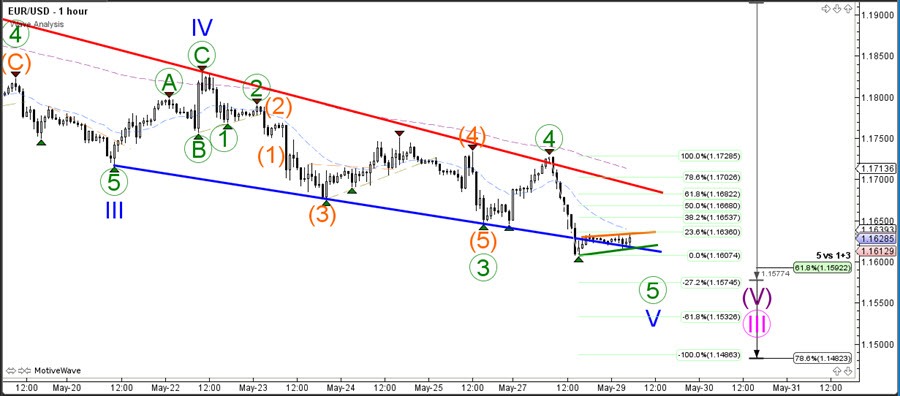
The EUR/USD needs to show strong bullish momentum otherwise bullish reversal does not seem likely at the moment. Price needs to break above the resistance trend line (red) and 61.8% Fib for instance. The current pattern on the 1 hour chart is however suggesting a bear flag and a break of that corrective pattern could see a continuation of the downtrend. In that case price is expected to fall towards the Fibonacci targets.
GBP/USD Descending Wedge Chart Pattern Favors Bearish Break
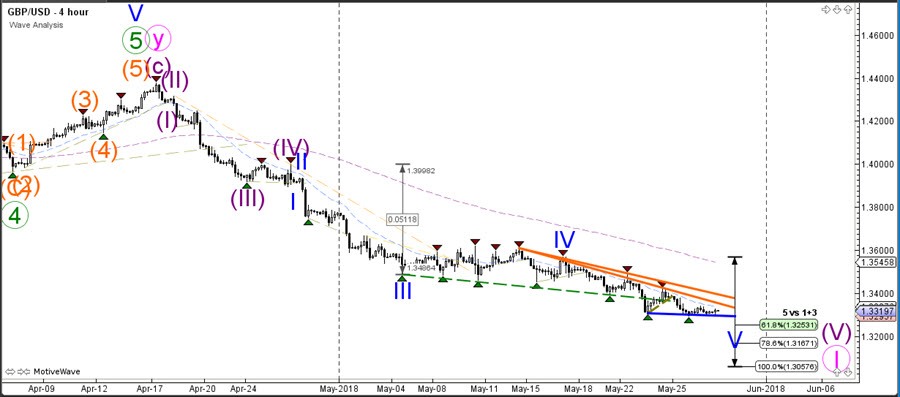
The GBP/USD is building a descending wedge chart pattern and the trend lines are key levels for a bounce or breakout. A bearish breakout could see price fall towards the Fibonacci targets of wave 5 (blue) whereas a bullish breakout indicates a larger bullish correction.
The GBP/USD downtrend is still showing the potential for continuation if price is able to break below the support trend line (blue). A bearish break below 1.3250 would probably change the current wave pattern and make it more likely that the current bearish momentum is a wave 3 rather than a wave 5.
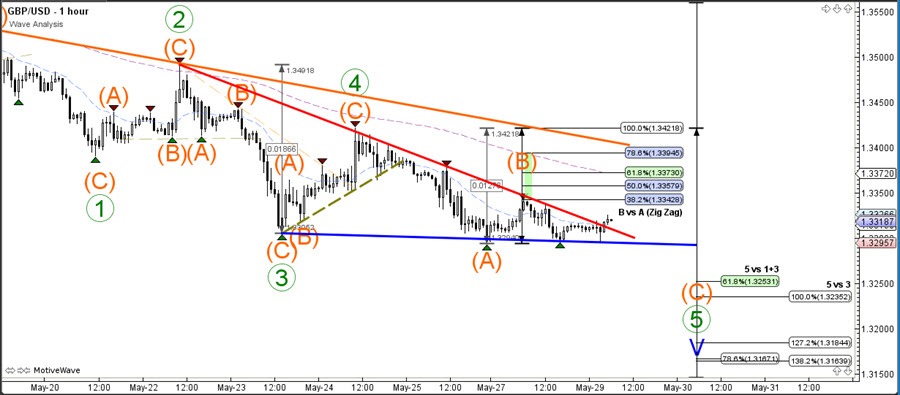
The GBP/USD seems to be building an ending diagonal pattern, which means that all 5 waves (green) are composed of a 3 wave ABC pattern. A bullish bounce could see price move up towards the Fibonacci retracement levels of wave B (orange) whereas a bearish breakout could see price fall towards the wave 5 targets. The wave 5 (green) should be the shortest wave of all 5 waves and therefore a break below the 1.3225-50 support zone invalidates it.
Currencies: How Much Bad News In Italy Is Discounted After Recent Euro Decline?
Rates: Repositioning remains ongoing
Repositioning on peripheral bond markets remains ongoing. The move might slow without fresh impetus, but don’t catch the falling knife. The German 10-yr yield closes in on 0.3% support. ECB speakers are a wildcard. Will Italian developments speed up or slow down their normalization intentions?
Currencies: How much bad news in Italy is discounted after recent euro decline?
Yesterday, an early euro relief rally was aborted. The EUR/USD downtrend continues. Uncertainty on Italy probably won’t disappear anytime soon. Even so, the euro decline shouldn’t continue at recent pace. The ECB might downplay the impact of the Italian politics on its policy approach going forward
The Sunrise Headlines
- US markets were closed for Memorial Day Holiday yesterday. Asian risk sentiment is negative overnight with China and Japan underperforming (-0.70%).
- Brussels plans to shift more than €30bn in EU funding away from central and eastern Europe, slashing Poland and Hungary’s share of “cohesion” spending while boosting support for Greece, Italy and Spain. (FT)
- The US decided to defer launching a major new sanctions push against North Korea, part of a flurry of weekend moves by both sides aimed at reviving a summit between President Trump and North Korean leader Kim Jong Un. (WSJ)
- The Japanese unemployment rate stabilized as expected in April at 2.5%, marginally above the multi decade low reached in January (2.4%). The job-to-applicant ratio stabilised at 1.59.
- British manufacturers said the government should abandon one of its main customs proposals for after Brexit. Under “maximum facilitation”, Britain and the EU would be entirely separate customs areas but would try to use technology to reduce friction and costs at the border. (Reuters)
- The UK Treasury and the Bank of England are at loggerheads over the future of City of London regulation after Brexit, with claims that relations on the issue are now “very, very bad”. (FT)
- Today’s eco calendar EMU M3 money data, US S&P house prices and consumer confidence. Several ECB members are scheduled to speak.
Currencies: How Much Bad News In Italy Is Discounted After Recent Euro Decline?
How much bad news is discounted in the euro?
Yesterday, Europe opened with a surprise relief rebound as the Italian president vetoed Eurosceptic Paolo Savona to become Finance minister. However markets soon realized that Italian political uncertainty is here to stay for an extended period of time. The risk-off trade resumed. Italian equities and bonds were sold again. The Bund rallied, raising the interest rate disadvantage against the single currency. EUR/USD dropped to the low 1.16 area. Still, USD trading was a bit distorted as US markets were closed (Memorial Day). USD/JPY traded with a slightly negative bias but held north of the 108.85/109 support area.
Overnight, Asian markets are trading with a most risk-off bias. Oil and US yields are losing further ground, weighing on USD/JPY. The pair is nearing/testing the 108.65/108.96 support. Japanese labour data were solid but had little impact on trading. The EUR/USD decline is taking a breather after recent sell-off. EUR/JPY dropped below the next big figure (currently 126.90).
Today, there are only second tier data in EMU, but several high-ranked ECB members will speak (Mersch, Lautenschlaeger, Villeroy and Coeure). Italy probably won’t be the focus of their communication. If commenting on the issue, they will likely downplay the impact of the developments in one country (Italy) on the overall ECB policy. It is far from evident that their comments will abort the EMU risk-off correction, but they probably won’t provide much arguments for the decline in core yields for the euro to accelerate further. US consumer confidence is expect to stay close the to cycle top. Italy will remain an source of volatility. Yesterday’s early short-squeeze couldn’t be sustained. So, there is no indication yet that the EUR/USD downtrend has run its course. The news flow on the US will probably also stay constructive. That said, we look for indications of a slowdown in the recent protracted EUR/USD slide. EUR/USD 1.1554 is the next high profile support on the charts. As usual, we also keep a close eye at the dynamics in EUR/JPY.
UK markets reopen after a holiday today. Yesterday, EUR/GBP followed the intraday decline of EUR/USD. There are no important UK eco data today. We don’t expect sterling to become a major beneficiary of EMU/Italian uncertainty. However, a break below 0.8713 might opt the dollar for a retest of the mid EUR/GBP 0.8650 area.
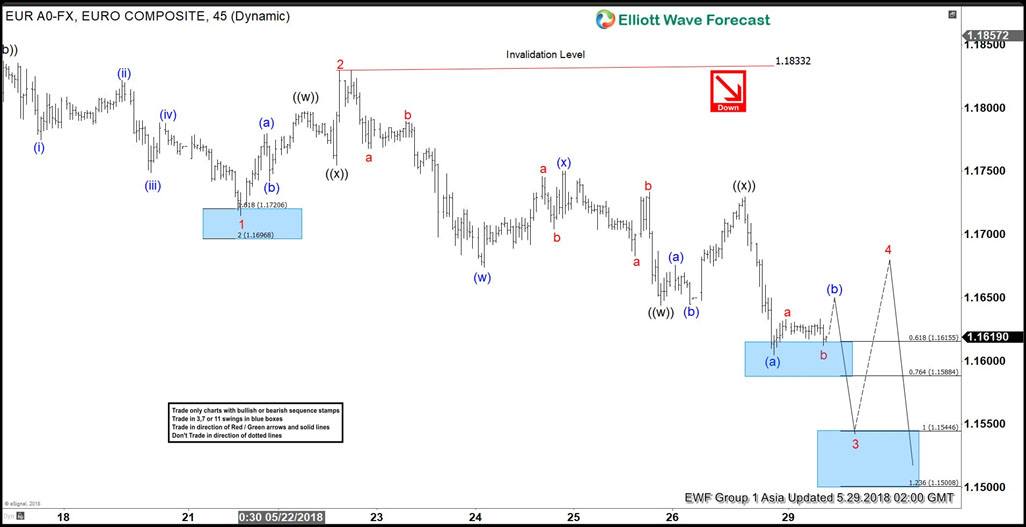
Elliott Wave View: EURUSD Bounces Are Expected To Fail
EURUSD short-term Elliott wave view suggests that the decline from ( 1.1996 ) 5/14/2018 peak is unfolding as ending diagonal structure in Intermediate wave (5) lower as mentioned in the previous post here. The internals of each of leg in ending diagonal structure is the combination of a 3 waves corrective structure i.e the internal of wave 1, 2, 3, 4 & 5 unfolds as double three, zigzag etc. Ending Diagonal usually appears in the sub-division of the wave 5 of impulse or wave C of Zigzag or Flat.
Down from 1.1996 high, the decline to 1.1715 low ended Minor wave 1 lower. Then the bounce to 1.183 high ended Minor wave 2 bounce as double three structure. Below from there, Minor wave 3 remains in progress as Elliott wave double three structure where internal Minute wave ((w)) of 3 ended at 1.1644. The bounce to 1.173 at yesterday’s high ended Minute wave ((x)) of 3. Near-term focus remains towards 1.1544-1.1500, which is 100%-123.6% Fibonacci extension area of Minute ((w))-((x)) to end the Minute wave ((y)) of 3. Afterwards, the pair is expected to do a bounce in Minor wave 4 which should then fail below 1.1833 high in 3, 7 or 11 swings for more downside. We don’t like buying it the pair.
EURUSD 1 Hour Elliott Wave Chart
Italian Politics Drag Equities, Euro Continues To Fall
Italy's political drama drove the risk-off mood felt across the globe early Tuesday as investors sold risk assets and bought the Japanese Yen and U.S. Treasuries. Most Asian markets were in the red, with the USDJPY trading at its lowest level in three weeks, hitting 108.90.
The Italian president's intervention to block populist coalition plans led to a massive selloff in Italian equities and bonds. The FTSE MIB, which gained more than 12% Year-to-Date earlier this month, fell 2% on Monday to erase all gains made in 2018. Meanwhile, yields on Italian two-year bonds rose from 0.28% to 0.88% in less than 24 hours in a clear sign of investor nervousness.
The Euro bounce on Monday was short-lived. EURUSD spiked to 1.1728 after Sergio Mattarella blocked the coalition's nomination of Paolo Savona as finance minister. His veto and assignment of Carlo Cottarelli to form a new government means another round of elections possibly taking place in August. The risk here is that a re-election will lead to a stronger populist group forming, and thus, a possible referendum on the European Union. This will eventually lead to further rating downgrades from credit rating agencies, and with outstanding debt of more than 2.3 trillion Euros, Italy's public finances will look to be in a very bad shape.
The Euro may remain out of favor this week, as traders also await the results of Spain's Prime Minister, Mariano Rajoy's vote of confidence in Parliament on Friday.
The Dollar Index hovered near 7-month highs early Tuesday while the Yen was the only major outperforming currency. With no tier-one economic data releases on the calendar today, expect politics to continue driving the currency moves.
The Turkish Lira continued to climb after its sharp recovery on Monday. The Turkish central bank's decision to make the one-week repo rate the primary policy rate was strongly welcomed by investors. This comes just a couple of days after the 300-basis points rate hike. If the central bank sends a clear message indicating its independence from the political power, this may restore confidence.