Sample Category Title
EUR/USD Recovery Bounce
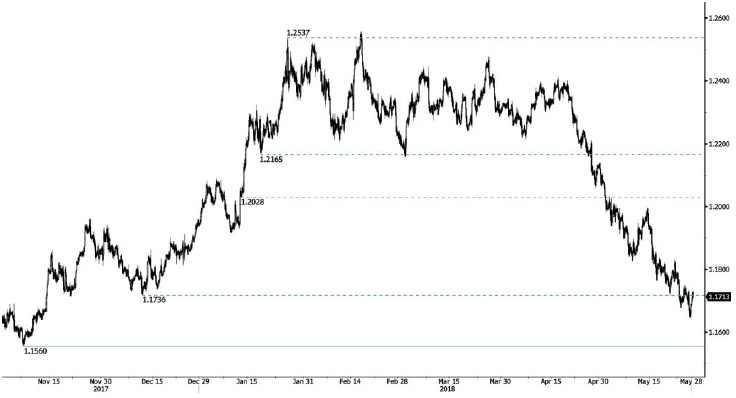
EUR/USD recovery bounce was short lived suggesting persistent selling pressure. The short-term technical structure is negative as long as prices remain below the hourly resistance at 1.2036 (11/01/2017 low). Next key support and resistance are now given at 1.1560 (07/112017 low) and 1.2323 (17/01/2018 high).
In the longer term, the momentum is turning largely negative. We favor a continued bearish bias. Key resistance is holding at 1.2886 (15/10/2014 high) while strong support lies at 1.1554 (08/11/2017 low).
EURUSD Analysis: Opens Higher This Week
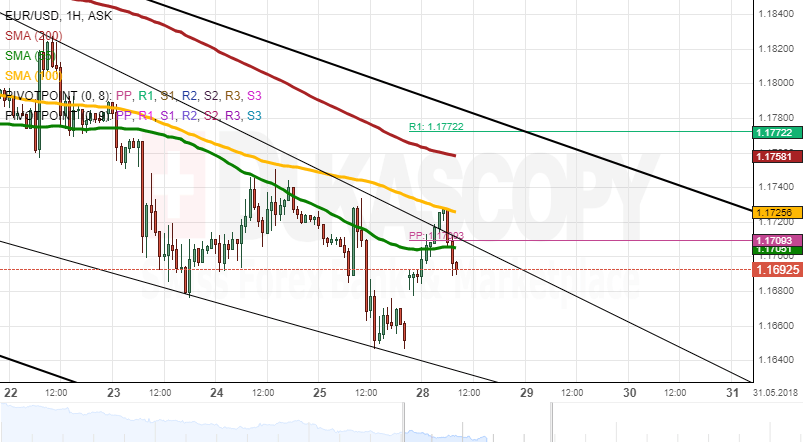
The 55-hour SMA was the main driving force for EUR/USD on Friday, thus allowing bears to continue dominating in the market. The rate reached a new six-month low of 1.650 mid-session.
Strong upside momentum for the Euro was provided by Italian politics which brought back some optimism in the given currency. At the time of this analysis, the pair had surpassed the 55-hour SMA and was testing the 100-hour SMA near 1.1730.
The pair is generally expected to recover this week, so this moving average and the nearby-located 200-hour SMA should be surpassed. Today's target is the 1.18 mark. However, it should likewise be noted that the Euro remains exposed to political developments in Italy that could have negative impact on the pair negatively, resulting in a fall down to the weekly S1 at 1.16 today.
GBPUSD Analysis: Reverses From 1.33
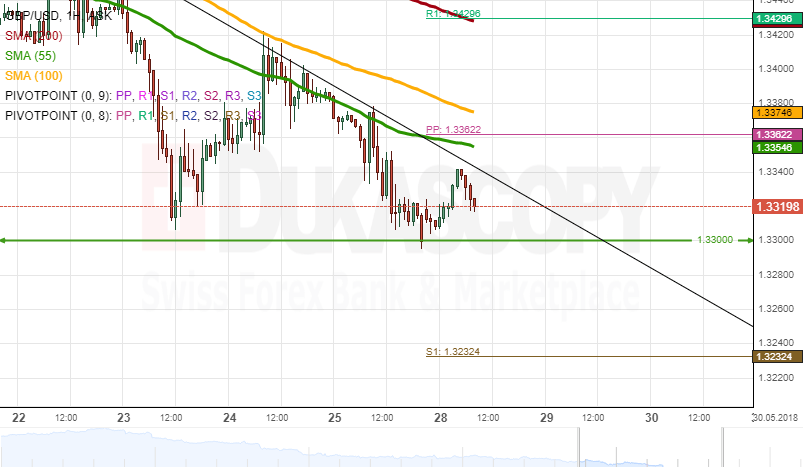
The 55-hour SMA continued to provide downward pressure for GBP/USD as a result of which the Pound fell down to a fresh six-month low at 1.33 late on Friday.
The Asian session today began with bullish momentum which pushed the rate towards the combined resistance of the 55– and 100-hour SMAs and the weekly PP near 1.3365. The rate might hinder near this resistance for a while prior surpassing it and approaching the 200-hour SMA at 1.3450.
Meanwhile, traders could be reluctant to push the rate below the psychological 1.33 mark. Given that there is a bank holiday both in the UK and the US today, the rate should not introduce large price changes.
By and large, the general direction should be northwards this week, thus allowing bulls to strengthen the Pound and thus move it away from its 2018 low.
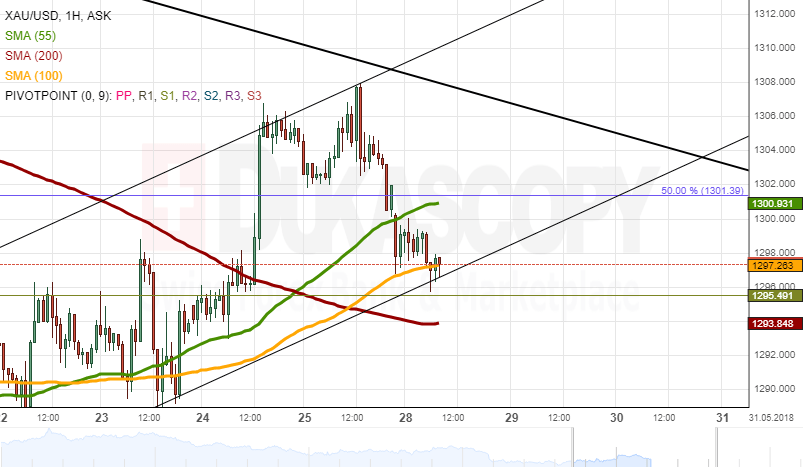
Gold Analysis: Falls To 100-Hour SMA
After reaching the upper boundary of a two-month channel down and its weekly high at 1,310.00 mid-Friday, the yellow metal began depreciating against the US Dollar as a result of which it was trading at the 100-hour SMA early this morning.
Technical indicators are generally neutral for this session. Given that there is a bank holiday in the US, big leaps either direction are unlikely. In terms of the downside, it is expected that the pair does not fall below the 200-hour SMA near 1,290.00, as this level is likewise reinforced by the 55-period SMA on the four-hour chart.
Meanwhile, bullish gains should be capped near the upper channel line at 1,307.00. This scenario is likewise supported by the six-day channel whose upper boundary is located at 1,310.00.
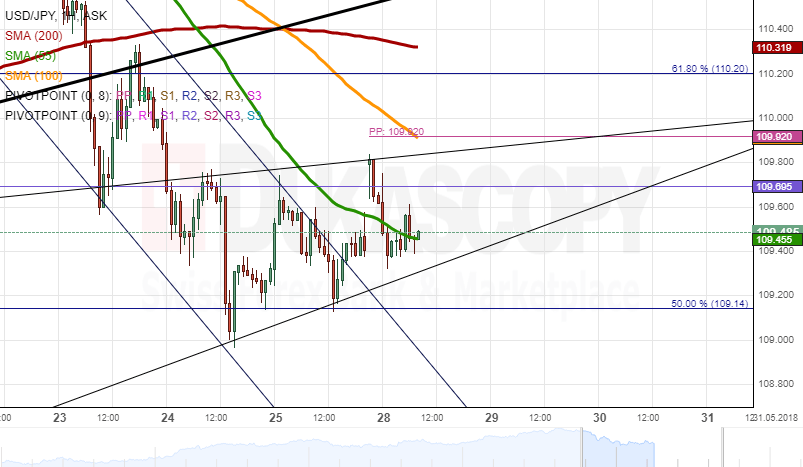
USDJPY Analysis: Bearish This Week
The US Dollar was trading sideways against the Japanese Yen on Friday. Despite breaching a four-day channel down later on the day, the pair failed to accelerate, as it was restricted by the 55-hour SMA. This moving average surrendered later in the day, but no further advances followed.
It is likely that the rate appreciates during the first part of Monday towards the 100-hour SMA and the weekly PP at 110.00. Taking into account that banks in the US are closed today, this level is unlikely to be breached, especially now when the pair is stranded between the 100– and 200-period SMAs on the four-hour chart.
Technical indicators on the daily time-frame favour a decline in price this week. The ultimate downside target should be the 100– and 55-day SMAs and the monthly PP at 108.20.
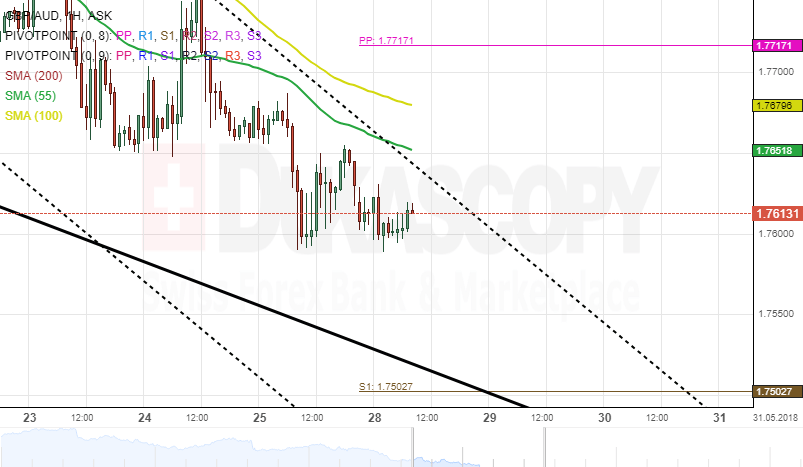
GBP/AUD 1H Chart: Sell signals
The GBP/AUD currency pair has been constrained by a long-term pattern. The most recent channel was formed in the middle of May, and it has driven the rate lower in between the line of a dominant pattern.
Following a test of the upper boundary of the junior channel and the 100– hour simple moving average late last week, The British Pound continued to depreciate towards the dominant channel at 1.7502.
Everything being equal, the currency exchange rate is likely to continue moving south until the aforementioned dominant channel is breached. Meanwhile, technical indicators flash a sell signal.
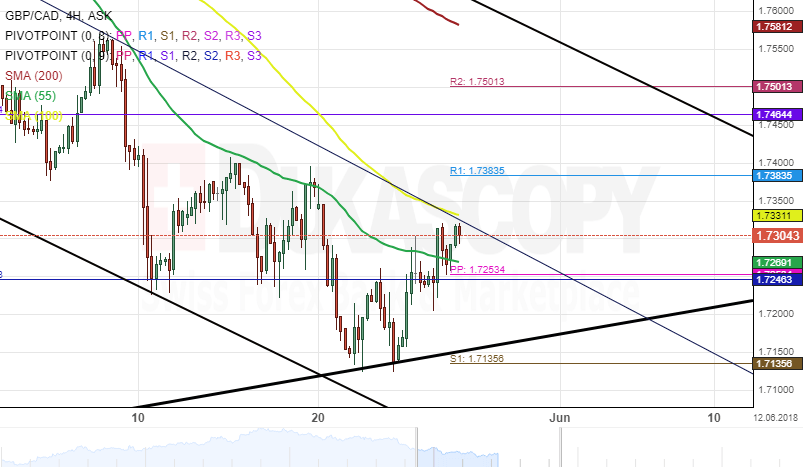
GBP/CAD 4H Chart: Stranded Between SMAs
The price movement of the GBP/CAD exchange rate has been guided by two lines descending channels for the last two months. This decline has led the Pound Sterling to a five-month low.
During the last one month, bears dominance over the currency pair has been significant. In the meantime, the rate is stranded between SMAs. The 100– hour simple moving average was providing resistance while the 55– hour SMA was providing support for the pair.
A breakout from the aforementioned SMAs is likely to occur within the next trading sessions. Meanwhile, technical indicators support bulls to come into play during this session.
Falling Crude Oil And Italian Fears
Friday saw the markets focusing on Crude Oil. Oil experienced a daily decline of 3.2% being the first weekly decline for almost two months. Early Monday trading has seen the downward pressure continue as Brent prices move close to $75 per barrel, the lowest levels since the beginning of May and 7% of the peak levels reached the last week. Similarly WTI lost 9% from recent highs.
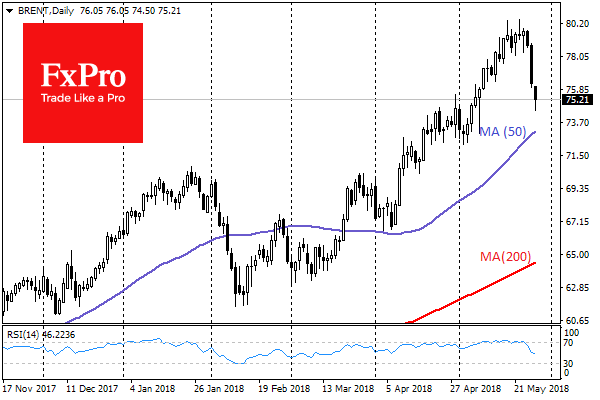
Recent comments from Russian and Saudi Arabian officials on the readiness to ease their restrictions on production as soon as next month appears to be the main factor forcing Oil prices lower. Such a stance appeared after oil reached $80 per barrel and demand outlook appeared to be strong. In addition, Saudi Arabia and Russia appear dissatisfied with the growth of production in the United States and the fact that they are actively trying to expand their market share.
However, there are great risks of repetition of the scenario that occurred in 2014, when the reluctance of OPEC to concede its share resulted in excessive growth in production and provoked the collapse of Crude Oil prices from above $100 pb to near $30 pb in a little more than a year. Previously the decline was initiated by fixing profits, after reaching an important mark of $80 per barrel by Brent, as well as a significant increase in crude oil reserves with stable production in the United States.
Other factors include the signs of a slowdown in the European economy, clear problems with growth in developing-country markets and a stronger dollar. Crude Oil can trade contrarian to this but these periods are usually short and much more likely to end with a retracement in oil prices rather than a reversal of dollar strength.
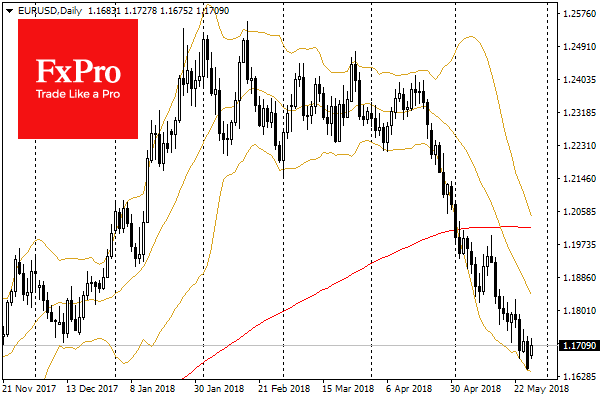
On Friday the dollar index reached its highest since November 2017 mainly because of downward pressure on the euro. The weakening of the common currency was attributed to the nomination of a Eurosceptic for an important economic post in Italy that could lead to further nationalistic undertones. As a result, EURUSD fell below 1.1650 on Friday. Early Monday trading has seen EURUSD trade higher to 1.1720 due, in part, to the Italian President not accepting the nomination. The recent weakness of EUR is likely to remain as the Italian situation could turn into a political crisis in a country where the President does not have sufficient power to make changes. Italian bonds in May displayed the highest growth yields since the end of 2011 – levels not seen since the Greek debt crisis.
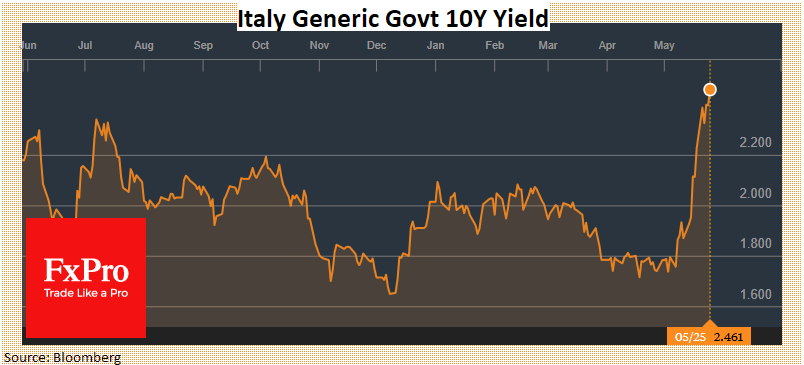
Sustained growth in bond yields in Europe may cause the ECB to leave rates low in the region for much longer, which could lead to a serious depreciation in EUR. It is worth remembering that during the Greek debt crisis EUR lost almost 20% in just over a year on the fears of a eurozone collapse, and only the assurances of Draghi “to do whatever it takes” avoided a worse outcome.
On Monday morning Asian news reports that the United States is still preparing for the North Korea Summit.
South Korean Moon: Meeting with Kim Jong-un was easy like a casual meeting
South Korean President Moon Jae-in said in a meeting with senior secretaries that the meeting with North Korean leader Kim Jong-un on Saturday was "just like a casual meeting" and that's "more important than anything".
He added that "leaders easily got in contact, easily made an appointment and easily met to discuss urgent matters, without complicated procedures and formalities, just like a casual meeting."
Moon also noted that the Saturday meeting was organized on short notice after Kim's request. And that could be a model for further contact between the two Koreas. He noted "if we could hold working-level, back-to-back talks on both sides of Panmunjom if urgently necessary in addition to formal summits, it would expedite faster advancement of inter-Korean relations,"
After Moon's effort to revive the Kim-Trump summit, US officials are now in North Korea for the details.
It's reported that Sung Kim, the former US ambassador to South Korea, was leading the American delegation to meet North Korean officials. Sung Kim was hailed by a former senior South Korean official as " capable, level-headed, cautious, and has solid grasp of the issues and knows North Koreans well." At the same time, Sung Kim has "healthy scepticism".
AUD/USD Megaphone Pattern In Uptrend
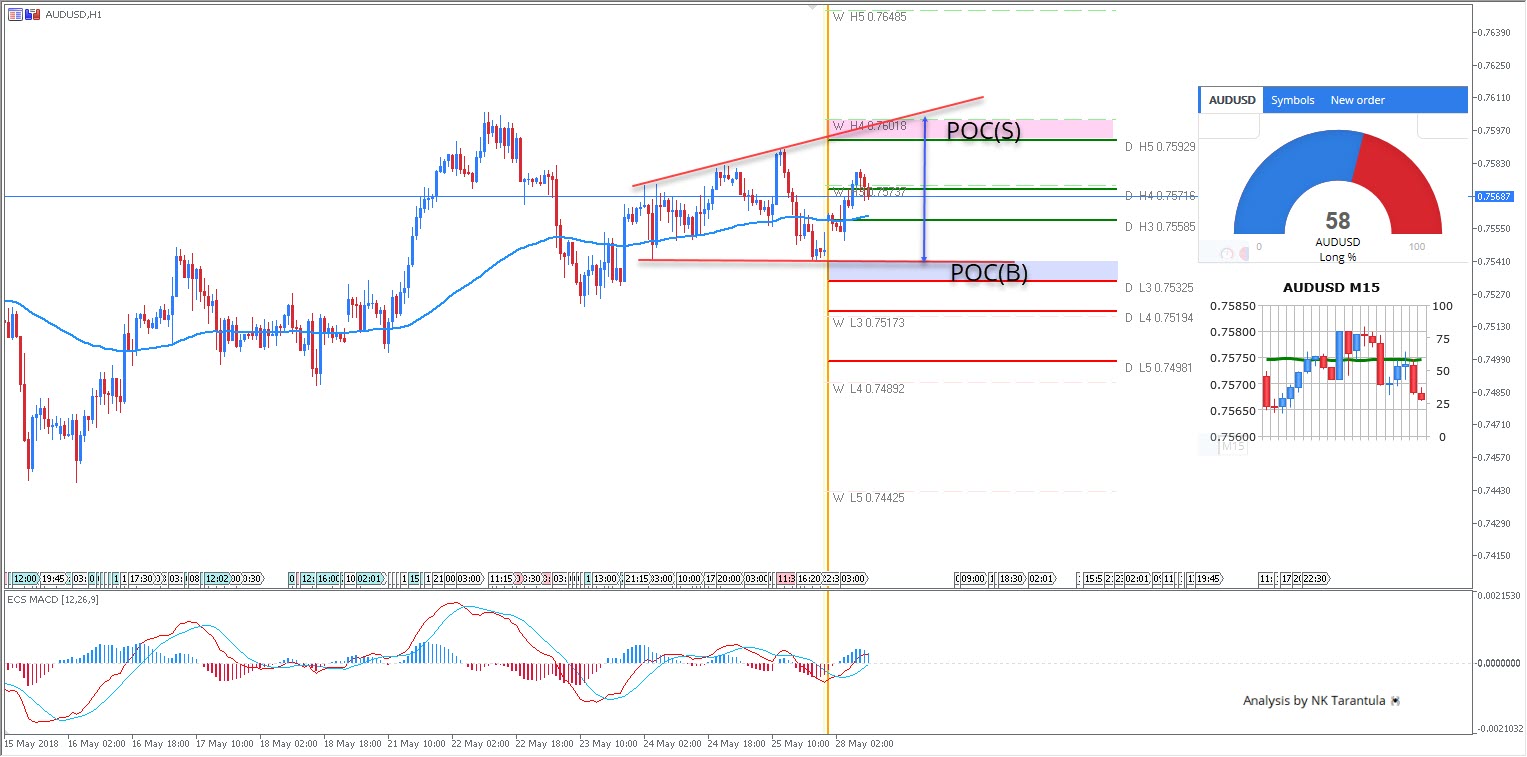
The AUD/USD has been in an uptrend but during the latest consolidation it has formed a megaphone pattern variant. The broadening top or megaphone is a pattern that shows both higher highs and lower lows In this case we can see a triple bottom and higher highs, where the next high could possibly used for short selling. POC(S) 0.7590-0.7600 is the zone for selling while POC(B) 0.7530-40 is the zone for buying. Any break of the 0.7530 to the downside will make this pattern even stronger and harder to trade.
W L3 - Weekly Camarilla Pivot (Weekly Interim Support)
W H3 - Weekly Camarilla Pivot (Weekly Interim Resistance)
W H4 - Weekly Camarilla Pivot (Strong Weekly Resistance)
D H4 - Daily Camarilla Pivot (Very Strong Daily Resistance)
D L3 – Daily Camarilla Pivot (Daily Support)
D L4 – Daily H4 Camarilla (Very Strong Daily Support)
POC - Point Of Confluence (The zone where we expect price to react aka entry zone)