Sample Category Title
EUR/USD Trading Sideways
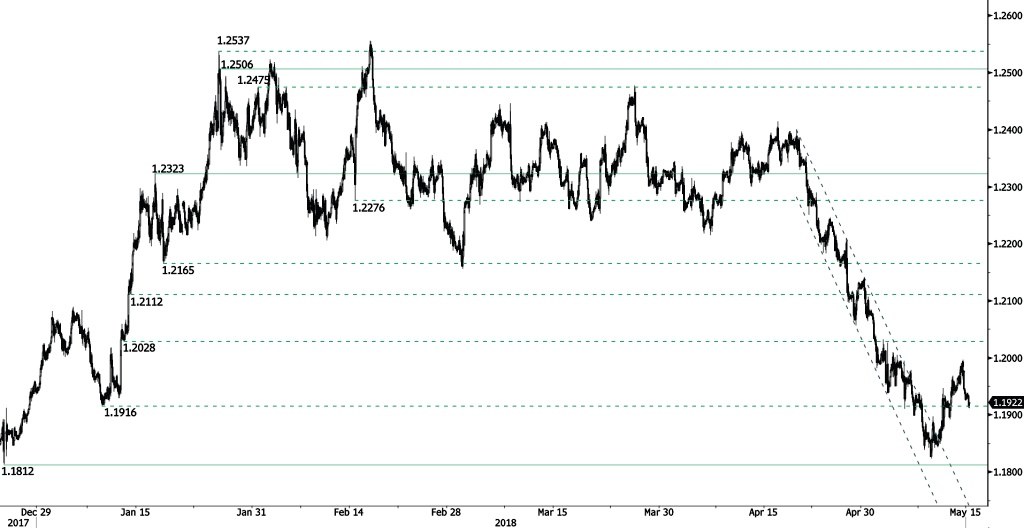
EUR/USD is starting a bearish consolidation after reaching 1.1996 high, heading along the 1.1910 range. The pair is currently trading at end-December 2017 levels. Hourly support and resistance are located at 1.1812 (25/12/2017 low) and 1.2323 (17/01/2018 high). The technical structure suggests short-term sideways trading moves.
In the longer term, the momentum is turning largely positive. We favor a continued bullish bias. Key resistance is holding at 1.2886 (15/10/2014 high) while strong support lies at 1.1554 (08/11/2017 low).
German ZEW: US withdrawal from Iran deal, trade conflicts and oil price had negative impact on economic expectations
German ZEW Economic Sentiment was unchanged at -8.2 in May, in line with expectation. German Assessment of Current Situation dropped -0.5 to 87.4, above expectation of 85.2.
Eurozone ZEW Economic Sentiment rose 0.5 to 2.4, above expectation of 2.0. Assessment of Current Situation dropped -1.6 to 56.1.
Quote from the release by ZEW President Achim Wambach:
"The effects of relatively positive values for German exports and production in March 2018 have been overshadowed in the most recent survey by uncertainty motivated by recent political events. The US decision to back out of the nuclear treaty with Iran and fears of a further escalation of the international trade conflict with the US, as well as a further rise of crude oil prices, have had an overall negative impact on economic expectations in Germany."
GBPUSD Eyes UK Data For Fresh Direction Signals
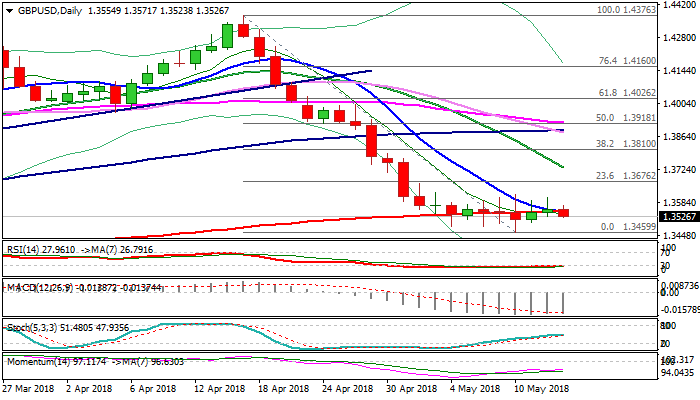
Cable remains within extended range after upside attempts on Monday stalled on approach to range top (1.3617), staying in directionless mode for the second week. Signals from technical studies are still mixed as momentum continues to strengthen, slow stochastic heads north, but 10/200SMA death-cross is forming and generating negative signal. UK data today are the key event for sterling and earnings are in focus for fresh signals. Headline earnings are forecasted at 2.7% in Mar vs 2.8% previous month, while ex-bonus earnings are expected to rise to 2.9% from 2.8% previous month. On the other side, UK jobless claims are expected to increase in Apr (13.3K f/c vs 11.6K previous month), while unemployment is expected to stay unchanged at 4.2%. Stronger than expected earnings could boost pound as upbeat figures could boost expectations for BoE rate hike in August. Bullish acceleration needs clear break above range top to generate initial signal and open way for recovery extension towards 1.3733 (falling 20SMA). Conversely, earnings miss would weaken the structure and risk break below range floor (1.3460) for test of next pivotal support at 1.3442 (Fibo 38.2% of 1.1930/1.4376 post-Brexit recovery).
Res: 1.3571, 1.3617, 1.3676, 1.3733
Sup: 1.3500, 1.3484, 1.3460, 1.3442
EURUSD At The Back Foot On Stronger Dollar, EU Data Eyed For Fresh Signals
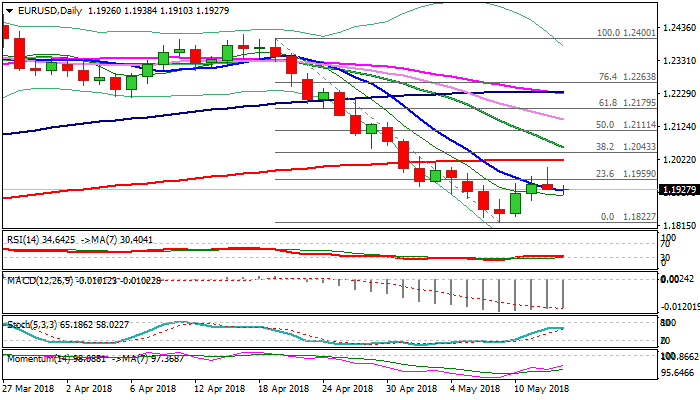
The Euro stands at the back foot on Tuesday as dollar strengthens on fresh rise on US bond yields, supported by easing in trade tensions between the US and China. The EURUSD dipped to strong support at 1.1910 (4-hr cloud base/50% retracement of 1.1822/1.1996 upleg) in early Tuesday's trading, extending weakness after strong upside rejection on Monday, when bulls stalled on approach to psychological 1.20 barrier. Subsequent pullback created red daily candle with long upper shadow, which was negative signal. Fresh weakness returned below 10SMA (1.1924), following repeated failure to close above it and generate positive signal for test of key 200SMA barrier (1.2015). Daily techs are still mixed as MA's are in full bearish setup while momentum continues to strengthen. Pullback found footstep at 1.1910 with subsequent recovery attempts expected to be limited (hourly cloud top marks initial resistance at 1.1945, while extended upticks should be capped under 4-hr cloud top at 1.1980). Stronger bearish signal could be expected on firm break below 1.1910, as falling thick 4-hr cloud would continue to weigh. Bullish signal would be generated on break above 4-hr cloud, while break through 1.20 and probe above 200SMA would signal continuation of recovery leg from 1.1822. Weaker than expected German Q1 GDP data did not show significant impact on Euro, with focus turning towards EU GDP/IP data, due later today.
Res: 1.1945, 1.1963, 1.1980, 1.1996
Sup: 1.1910, 1.1889, 1.1875, 1.1863
AUD/NZD Strong Uptrend Continues
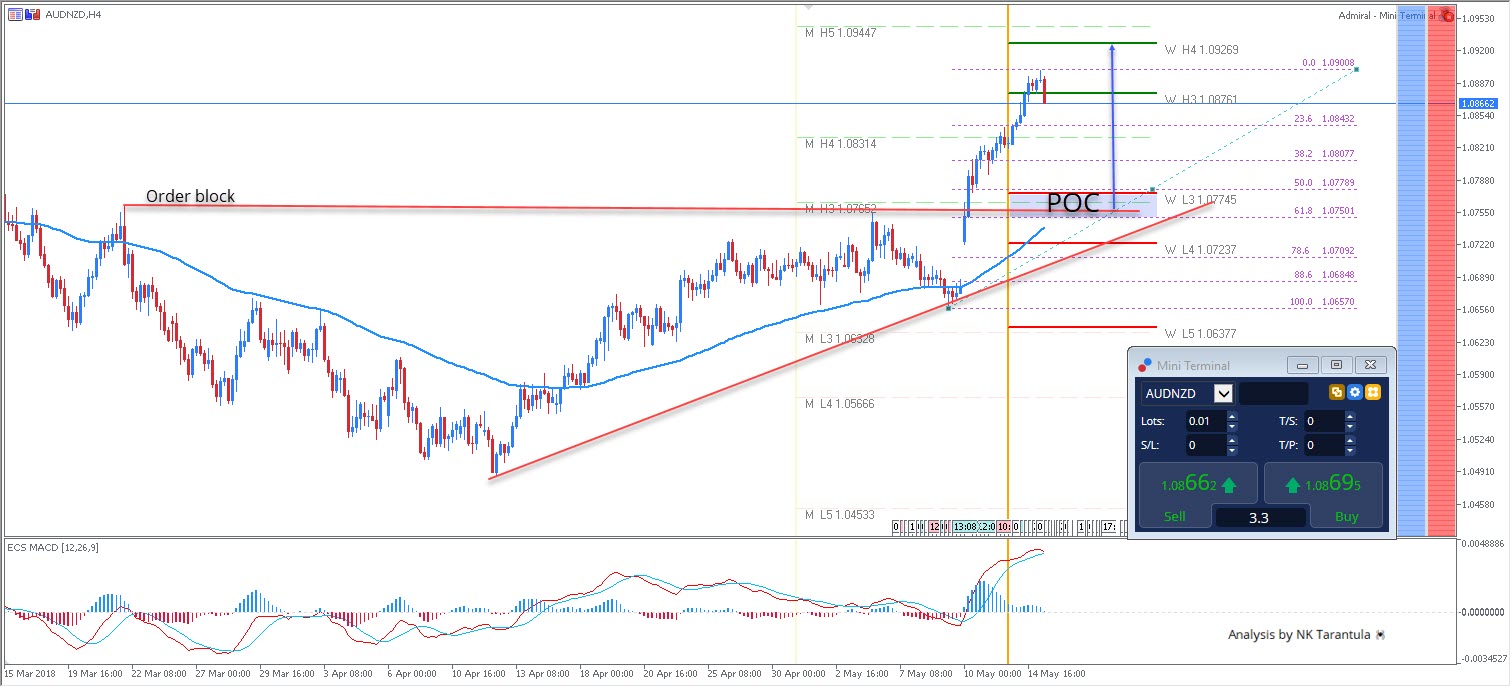
Due to diverging RBNZ and RBA monetary policies, the AUD/NZD has formed a strong uptrend breakout above the order block / MH3 confluence. Technically, if the price retraces to 1.0750-75 we should see another bounce towards 1.0876. However, another close above 1.0876 should provide a continuation towards 1.0926 and 1.0944. Around 1.0950 we might see short sellers coming as the M H5 is the strongest monthly resistance. Until then, buying the dip is the option.
W L3 - Weekly Camarilla Pivot (Weekly Interim Support)
W H3 - Weekly Camarilla Pivot (Weekly Interim Resistance)
W H4 - Weekly Camarilla Pivot (Strong Weekly Resistance)
M H4 - Monthly Camarilla Pivot (Very Strong Monthly Resistance)
M L3 – Monthly Camarilla Pivot (Monthly Support)
M L4 – Monthly H4 Camarilla (Very Strong Monthly Support)
POC - Point Of Confluence (The zone where we expect price to react aka entry zone)
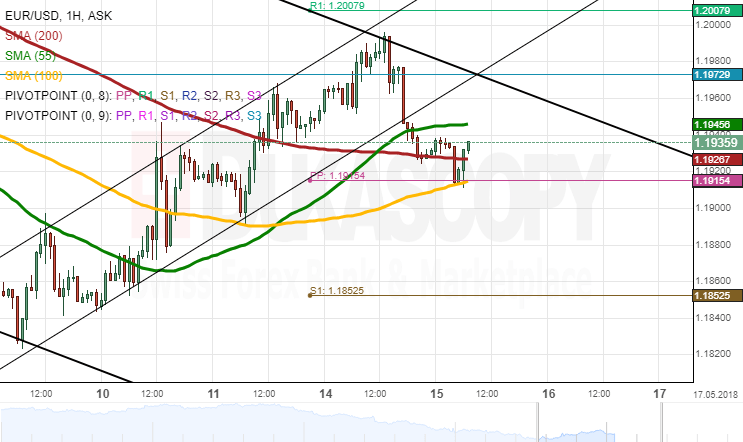
EUR/USD Analysis: Falls From 1.20
The Euro was able to appreciate against the Greenback during the first part of Monday, with gains being capped at the 1.20 mark. This psychological resistance, likewise reinforced by the weekly R1, provided an unbreakable barrier which resulted in a subsequent fall down to the 200-hour SMA near 1.1925 this morning.
It is expected that the pair pushes lower during the following hours until the US Retail Sales are published at 1230GMT; this in turn could introduce volatility in the market. In case the 100-hour SMA and the weekly PP at 1.19 are breached, the Euro is likely to target 1.1860/80.
Meanwhile, a failure to do so should result in the pair surpassing the weekly R1 at 1.20. This move might be an early indication that the expected medium-term surge is to begin soon.
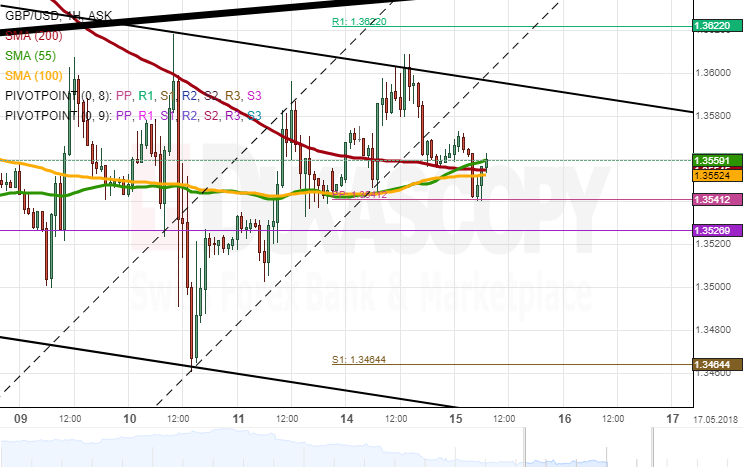
GBP/USD Analysis: Breaches Strong Support
GBP/USD continued to strengthen for the third consecutive session on Monday. This upward movement allowed the pair to reach the upper boundary of a medium-term channel at 1.36. After testing this psychological level, the pair was pressured back down to the 55-, 100– and 200-hour SMAs at 1.35550.
This strong support cluster was breached during this Asian session—a move which might actually point to further decline in this session. Daily technical indicators likewise support this scenario.
From technical point of view, this bearish sentiment should result in a test of the bottom channel line circa 1.34. However, it is unlikely that the pair falls this low, as technical indicators on the 4H and 1D time-frames favour a soon recovery. The pair is expected to remain in the 1.3450/1.3650 territory today.
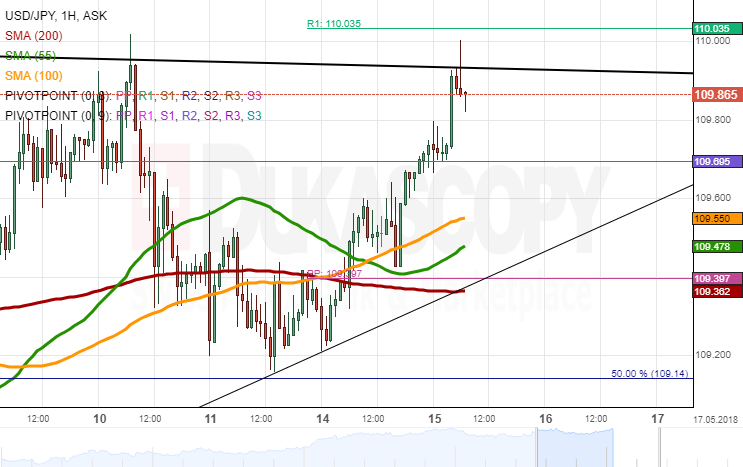
USD/JPY Analysis: Tests Trend-Line
Despite facing strong resistance of the 55-, 100– and 200-hour SMAs near 109.40, bulls managed to gather enough strength to push USD/JPY above this level on Monday. This breakout provided additional bullish momentum, as the US Dollar subsequently surged as high as the 109.90 mark where a two-week trend-line is located.
The following hours will be important to determine the pair's further direction. A successful breakout of this level should result in further appreciation up to the 110.20/40 area where the 61.80% Fibonacci retracement is located.
On the other hand, a bearish reversal is expected to result in a test of the aforementioned SMAs and the weekly PP near 109.50. A decline below this area is not expected to follow.
UK unemployment rate unchanged at 4.2%, earnings grew 2.6%
UK unemployment stayed unchanged at 4.2% in March, at the lowest level since 1975.
Average weekly earnings rose 2.9% 3moy excluding bonuses
Average weekly earnings rose 2.6% 3moy including bonus, met expectations.
Claimant count rose 31.2k in April versus expectation of 13.3k.
Sterling is a touch higher after the release.
XAU/USD Analysis: Points To Recovery
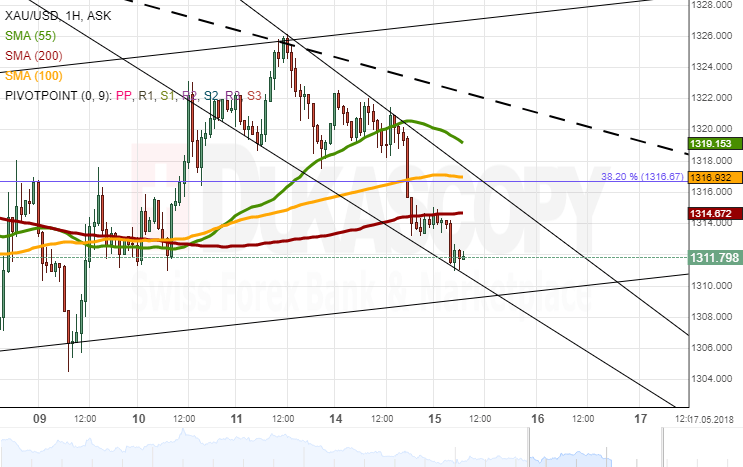
Gold remained stable against the Greenback during the most session on Monday, as it was restricted by the 55-hour SMA from below. This lack of movement changed when the pair fell 0.42% and consequently dashed through the 55-, 100– and 200-hour SMAs.
Technical indicators are located in the oversold territory; thus, a recovery is expected in this session. Upside potential, however, is likely to be limited due to the aforementioned SMAs being located in the 1,314.00/1,320.00 area. The 38.20% Fibo retracement and a five-week trend-line are also situated nearby.
If looking at downside potential, the yellow metal has no support until the senior channel and the 50.0% Fibo at 1,310.00. Thus, the pair might fall considerably if the junior channel at 1,310.00 is breached.