Sample Category Title
EUR/USD Trades At 1.1850
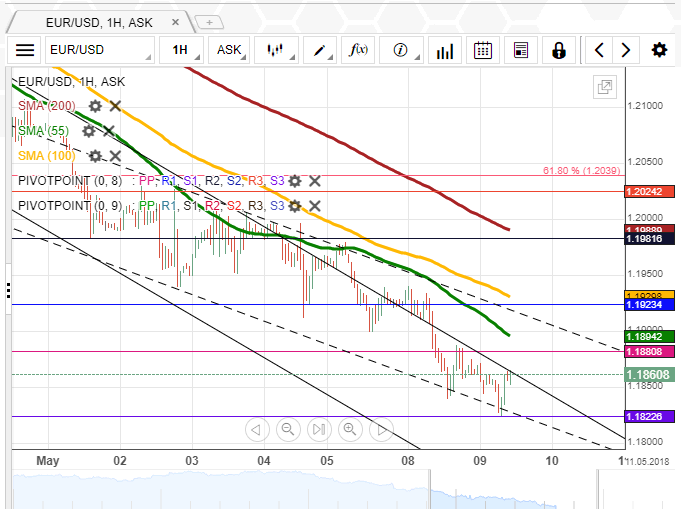
The common European currency was not able to surpass the strong resistance of the 55-hour SMA on Tuesday morning as a result of which bears saw an opportunity to push the rate lower. This fall was limited by the weekly S1, thus leaving the rate floating slightly above the 1.1850 mark this morning.
The Euro should return near the 55– and 100-hour moving averages during the following hours. The upper boundary of a five-day descending channel is likewise located in this area.
It is likely that pair lacks the necessary momentum in this session, thus remaining trading along the 55-hour SMA. The expected bullish reversal, however, should occur later this week.
Today's upside potential is until the 200-hour SMA at 1.20, while a fall should not surpass the 1.1775 level.
Pounds Stable Against US Dollar
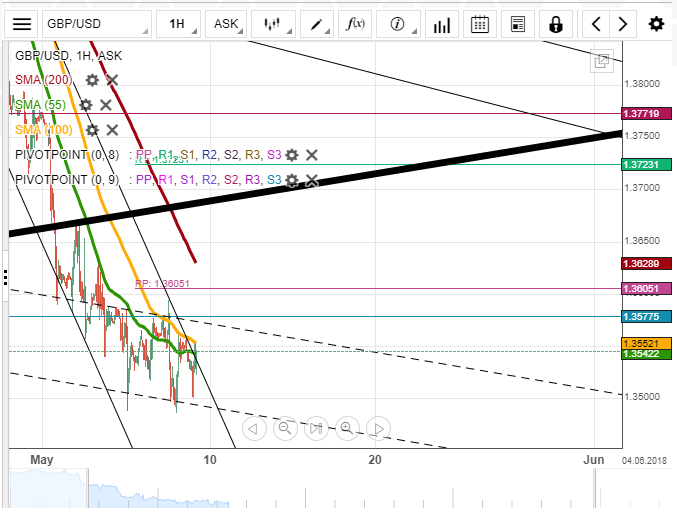
If looking from an intraday perspective, the Pound remained stable against the US Dollar on Tuesday. The pair did introduce some volatility mid-session, but it ended soon, thus leaving the rate near its Tuesday-morning level.
The 100-hour SMA is once again providing strong support for the Pound today. In case this line is surpassed, the most likely scenario would see the pair accelerating and trying to reach the 200-hour SMA at 1.3660.
On the other hand, a failure to do so is expected to result in a decline. Even though the nearest support is the distant weekly S1 at 1.3417, the Sterling might not fall this low, given its recent attempts surpass the aforementioned SMAs.
Technical indicators still remain bearish, while the pair's potential during the following days is to the upside.
USD/JPY Surges On Wednesday Morning
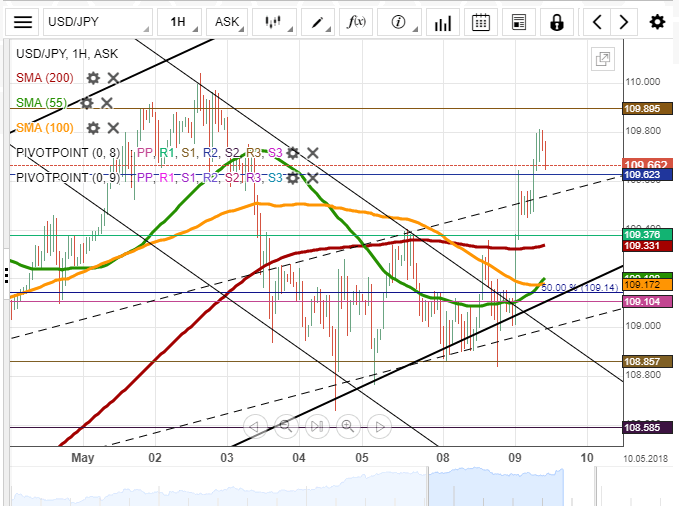
Tuesday's trading session was spent in a calm manner for the USD/JPY exchange rate, as it remained pressured to the downside by the 200-hour SMA. Meanwhile, support was provided by the lower boundary of a seven-week channel.
This lack of movement shifted dramatically during the Asian session when the pair shot up 51 pips within two hours, thus instantly breaching the 55-, 100– and 200-hour SMAs and the weekly PP. This move stopped near the short-term channel circa 109.80. It is expected that this surge leaves the rate stable for a couple of hours.
Meanwhile, given the strong support cluster formed by the breached moving averages, the US Dollar should maintain its northern direction in this session. In case the weekly R1 at 110.00 is surpassed, the next resistance is set by the 51.80% Fibo at 110.20.
XAU/USD Shows Two Scenarios
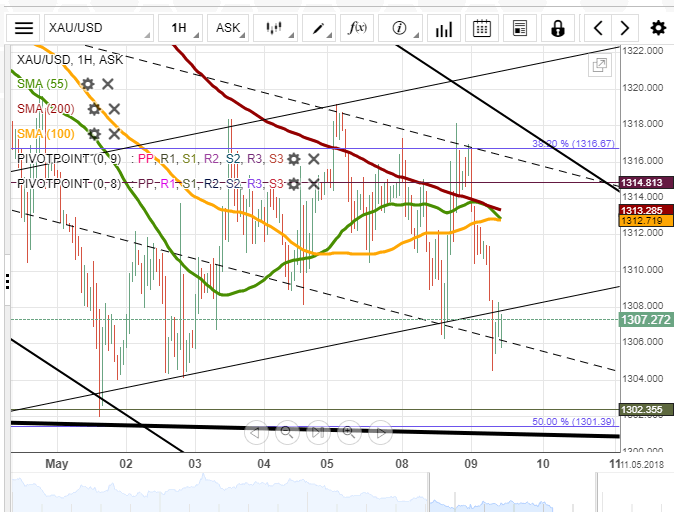
The yellow metal remained tangled around the 55-, 100– and 200-hour SMAs for the third consecutive session on Tuesday. As a result, the pair was not able to form a distinctive move either direction and thus remained trading in the 1,307.00/1,317.00 range.
Two new and opposing channels were drawn on the chart to track the pair's short-term movement. Thus, traders should observe which pattern Gold follows during this trading session. In case the pair respects the more senior one and thus reverses to the upside at 1,308.00, a surge up to 1,330.00 is likely to follow.
On the other hand, a breakout of the 1,308.00 level should result in further decline down to the senior channel and the 50.0% Fibonacci retracement at 1,300.00.
Forex Analysis: GBPUSD And US 30 Index
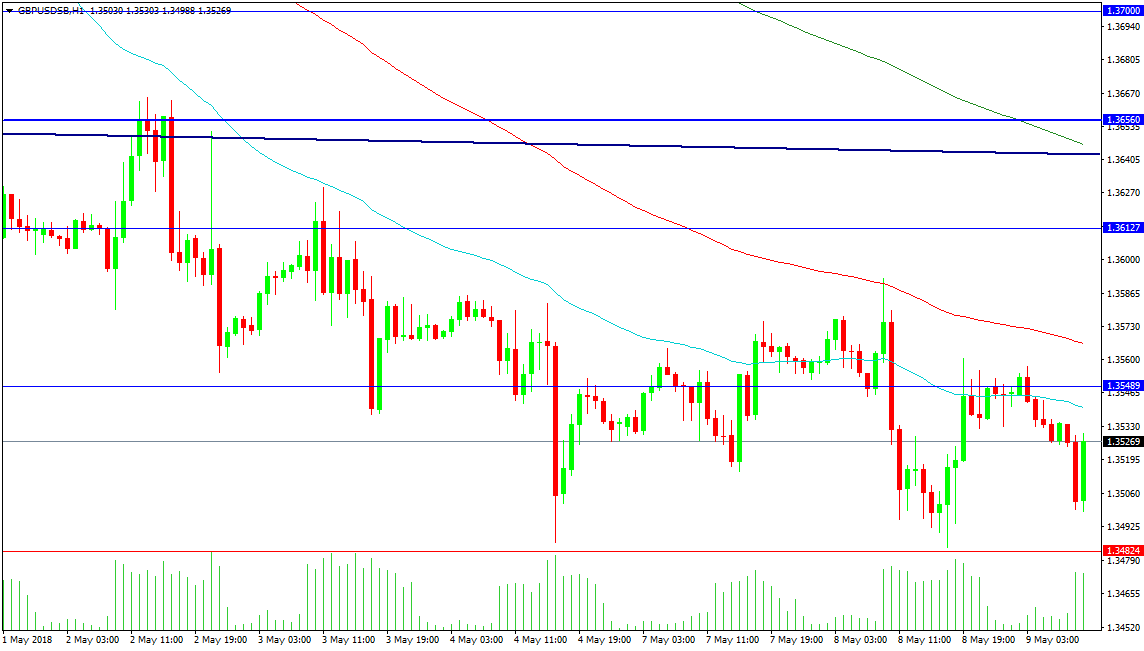
The GBPUSD pair has managed to hold above its support at 1.34824 over the last few trading sessions and has formed a trading range up to 1.35926. The sequence of lower highs is still intact and for a reversal of the down trend started in mid-April at 1.43760 to take place, the price needs to set a high above yesterday’s high at 1.35926. At this point, a look towards the resistance level of 1.36127 as a possible target area becomes appropriate. If the price was to rally from current levels, this would create a double bottom with a target of 1.37000. However, resistance at the falling trend line at 1.36428 and the 1.36560 level is strengthened by the 200-Hour MA at 1.36452.
Should a retest of this area fail and resistance hold, a move back to test the support of the double bottom would be logical. This would mean a break back under the 100-Hour MA, currently at 1.35656, which was used as resistance to form yesterday’s high. Support below comes in at 1.34300, followed by the 134000 level. Further support can be found at 1.33000.
US 30 Index
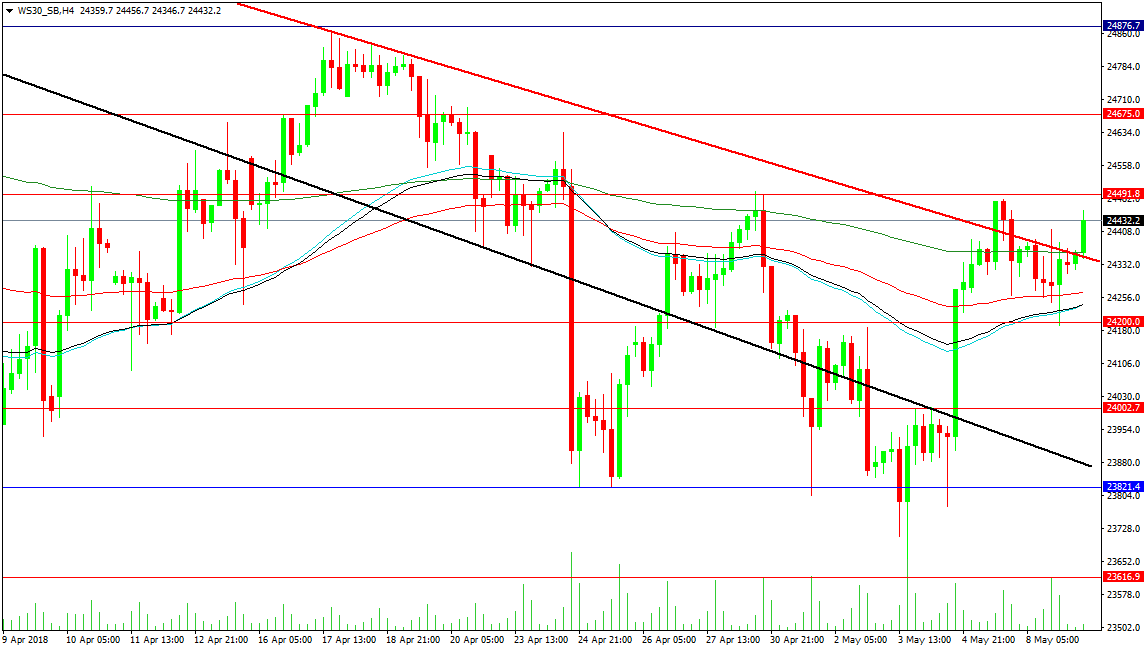
The US 30 Index reacted to the US termination of their involvement in the Iran Deal with an initial whipsaw price action, as traders positioned their portfolios. The 4-Hour moving averages were all tested and the resultant move this morning is a break higher above trend line resistance at 24350.00. This leaves a strong support zone down to 24200.00, which was yesterday’s low. A break out higher needs to clear 24500.00, at which point the April high of 24860.00 becomes a target. Above this level, 25000.00 is followed by 25500.00.
A break lower from a failed rally becomes bearish under 24200.00, with support at 24000.00. The falling black trend line at 23880.00 is approaching a support zone starting at 23820.00 and extending down to 23775.00. From there, support is found at 23530.00 and the rising blue trend line connecting the lows of 2018 at 23478.00, with 23250.00 as support in extension.
US CPI Growth Expected To Tick Higher, Fed Hike Outlook Eyed
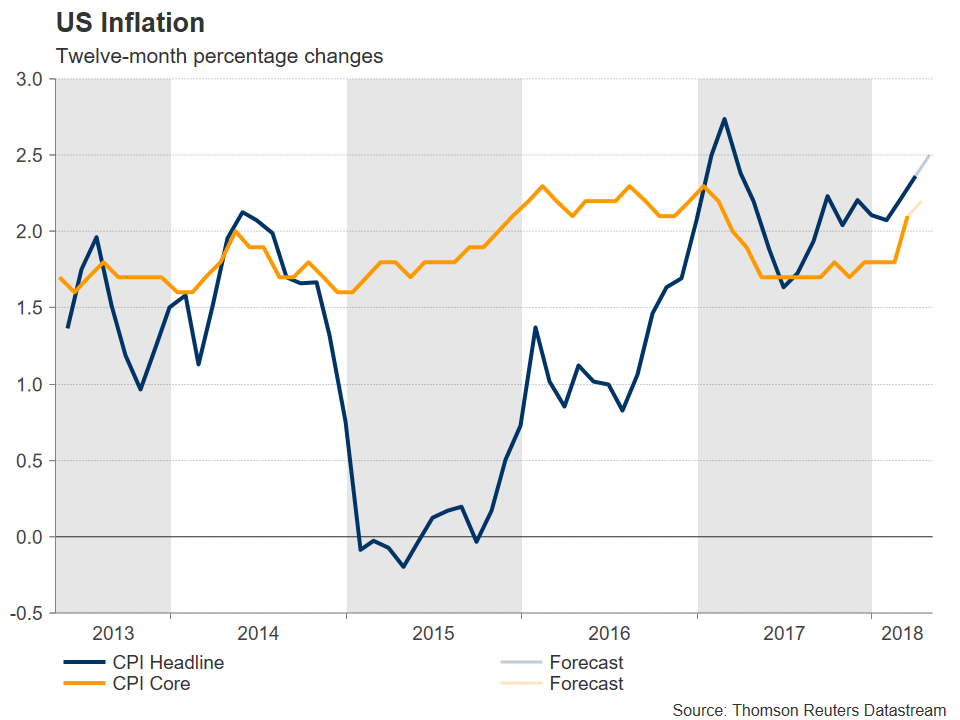
The US will see the release of inflation figures on Thursday at 1230 GMT. Price pressures are forecast to have accelerated in April, with headline CPI projected to touch its highest since February 2017 on an annual basis. The numbers do not pertain to the Federal Reserve’s preferred inflation measure, but still they will be closely watched by market participants; a beat could stoke market expectations for the delivery of four interest rate increases in total by the US central bank in 2018, providing support to the greenback.
Headline inflation is expected to expand by 0.3% m/m, after contracting by 0.1% in March, and grow by 2.5% y/y, above March’s 2.4% and at its highest in fourteen months. Rising oil prices are anticipated to be a factor contributing to the uptick in headline CPI. Meanwhile, core CPI, the measure that excludes volatile food and energy items, is projected to grow by 2.2% – a feat last achieved in February of last year – following March’s 2.1%.
FOMC policymakers might be willing to accept inflation overshooting past their annual target without steepening their interest rate outlook, or at least this was the market’s interpretation upon completion of last week’s meeting by the Fed; something which was also echoed by Atlanta Fed President Raphael Bostic (a voting member within the FOMC in 2018) in remarks made on Monday. This development led market participants to scale down their expectations for three additional 25bps interest rate increases during the year, something which would put the total number of moves in 2018 at four. However, the odds for a third additional increase are back on the rise according to Fed fund futures, currently standing at 30%. Stronger-than-forecasted readings out on Thursday could well push that probability even higher, consequently boosting the US currency.
Focusing on dollar/yen, resistance to advances in the event of a positive surprise in the numbers might come around the 110 handle, given that first the area around the 50% Fibonacci retracement level of the November 6 to March 26 downleg at 109.63 is more conclusively broken. The region around 110 includes the current level of the 200-day moving average at 110.19, as well as last week’s three-month high of 110.02. Further above, the range around the 61.8% Fibonacci mark at 110.84 would be eyed next. Conversely, a data miss would likely exert selling pressure in USDJPY. Support to declines could come around the 109 round figure and, in case of sharper losses, from the area around the 38.2% Fibonacci level at 108.43.
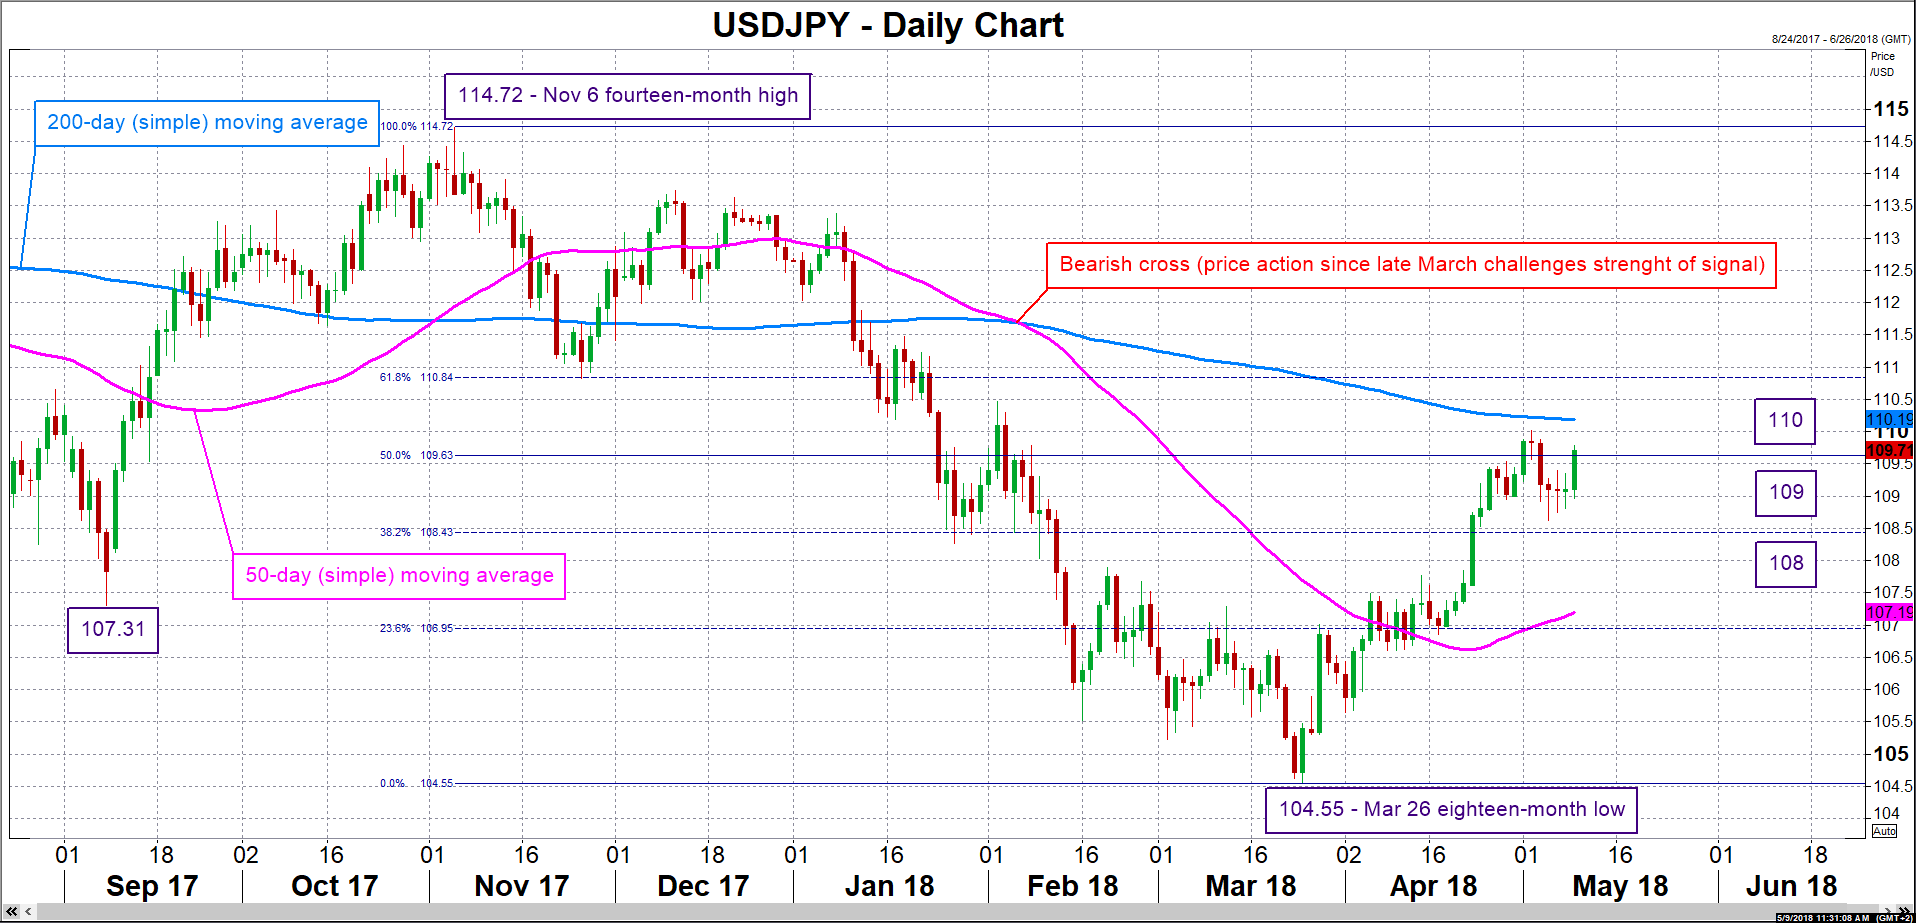
Prints on April factory price inflation, as gauged by the producer price index (PPI), will be made public on Wednesday (1230 GMT). These too can spur positioning on dollar pairs, including of course the aforementioned (USDJPY). Important data out of Japan, will include March’s current account balance due during Thursday’s Asian session. However, it should be kept in mind that developments on the geopolitical front might turn out to be another driver of movements in the dollar/yen pair this week, especially in light of the Japanese currency’s safe-haven status. In this respect, yesterday, President Trump decided to withdraw the US from the 2015 nuclear deal with Iran.
Sterling Bulls Hoping For Hawkish Hold By BoE After Rate Hike U-Turn
The pound has plunged by about 6% versus the dollar in the past three weeks as expectations that the Bank of England will raise interest rates on May 10 have diminished sharply. After a series of negative surprises in economic data, the Bank is now expected to keep rates unchanged at 0.50% on Thursday. However, the battered pound could get some respite if policymakers hint that future hikes remain on the table.
At the start of April, futures markets were indicating that there was a more than 90% probability that the BoE will raise rates by 25 basis points at the May meeting. Those expectations were fuelled by encouraging figures on the economy as well as Monetary Policy Committee (MPC) members strongly flagging a rate increase. However, since the middle of April, the BoE has been wrong-footed by poor GDP growth numbers for the first quarter and a faster-than-expected deceleration in inflation.
Mark Carney, the Governor of the Bank, was quick to suggest after the disappointing data releases that the May meeting is not the only option to raise rates. While his remarks may have killed rate hike bets, this is not the first time Carney has done a U-turn on monetary policy and the latest embarrassment doesn’t do the BoE’s reputation any favours.
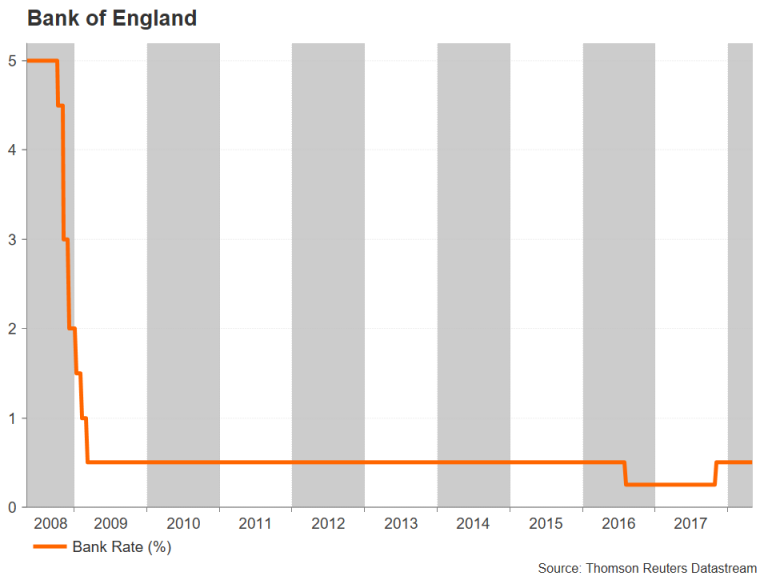
The Bank will likely try to salvage some credibility when it announces its decision at 11:00 GMT on Thursday by maintaining its outlook that further withdrawal of monetary stimulus will be necessary over the coming months. A delayed rate rise could come as early as August, with market odds currently running just under 60%. A move in November is looking even more certain, with a more than 95% probability that rates will be raised by 25bps before the year end.
The pound should find some support, helping it stabilize, if the Bank reaffirms its view that some tightening will be needed later this year. However, for the pound to attract the bulls back into the market, traders will want to see more convincing hawkish signals from policymakers. Such a signal could come from the MPC vote. If as expected, only the two hawkish members vote for a rate hike on Thursday, this is unlikely to be enough to generate significant positive momentum for pound/dollar.
If on the other hand, three or four MPC members dissent, this would boost expectations of a rate rise in August, helping sterling recover from four-month lows. Pound/dollar could attempt to reclaim the $1.36 level, with possible resistance at $1.3612. A sharper reversal could push the pair to the next resistance at $1.3710, taken from the March 1 low.
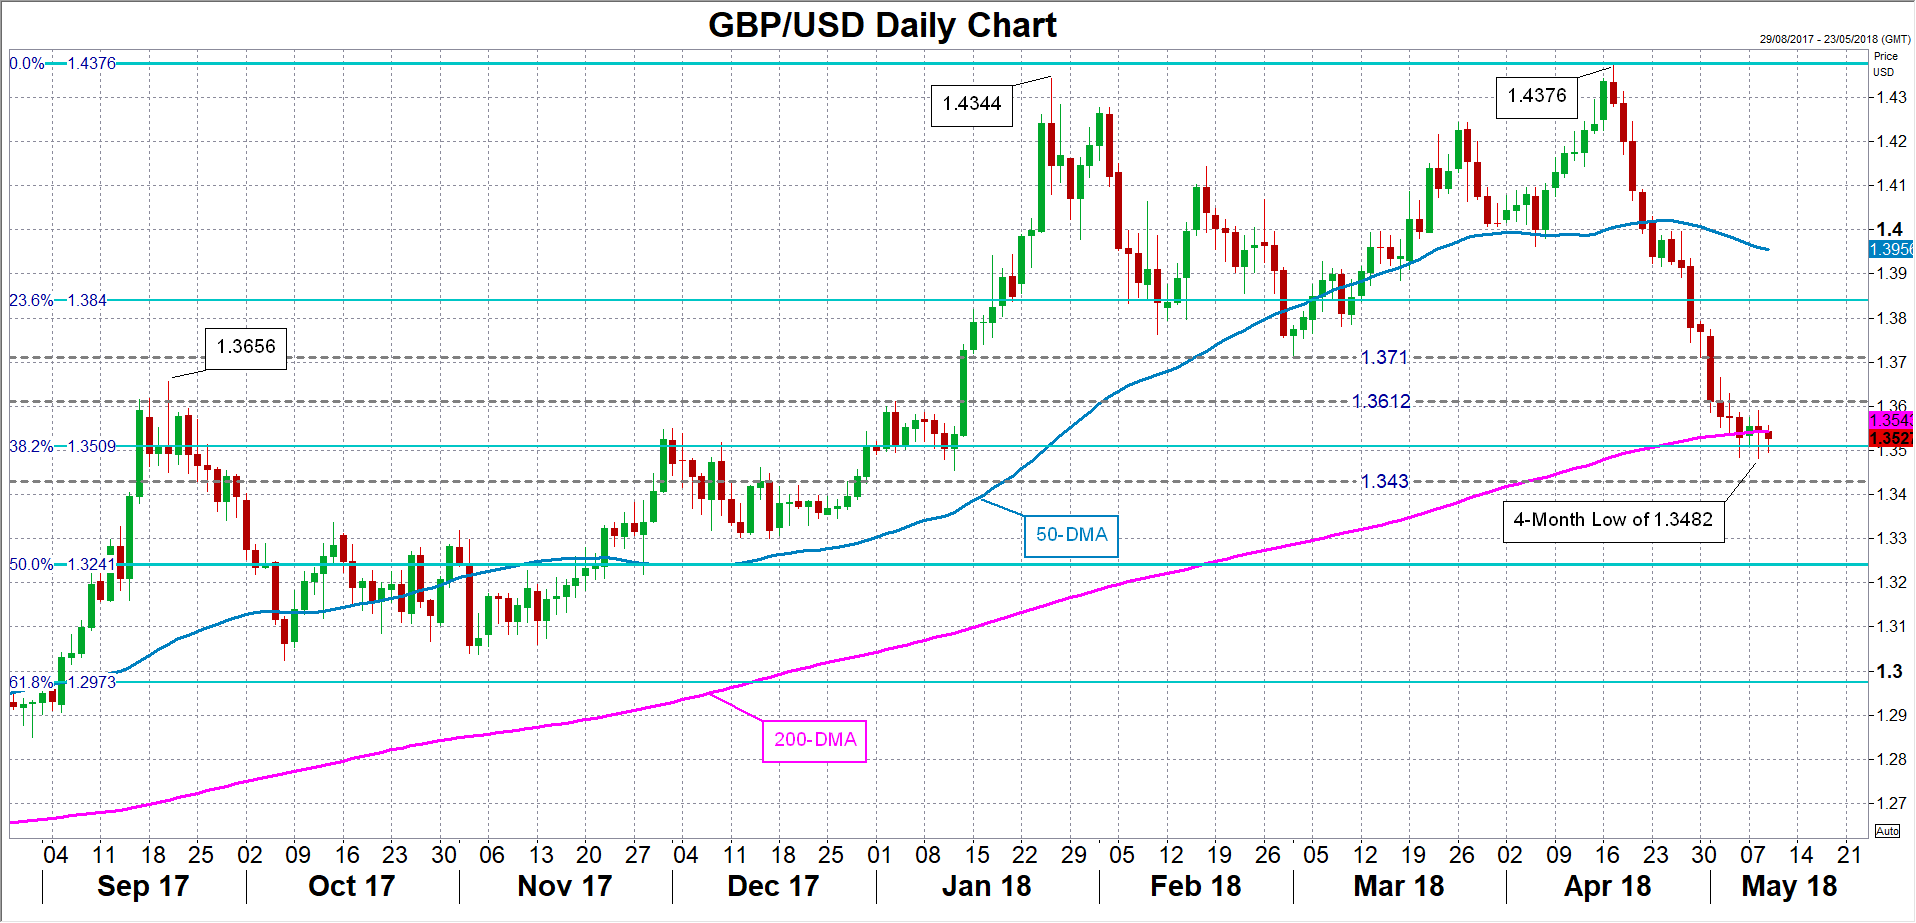
The worst outcome for cable would be if the Bank lowers its growth and inflation forecasts in its quarterly inflation report and strikes a much more cautious tone regarding the outlook, casting doubt about whether rates would go up at all in 2018. Sterling would lose its key support around the $1.35 level in such a scenario, bringing into view $1.3430 as the next support region. Should the pair suffer a sharper sell-off, the $1.3240 (the 50% Fibonacci retracement of the March 2017-April 2018 uptrend) would be the next target on the downside.
EURJPY Rebounds On 6-Week Low, Bullish Correction Is Expected
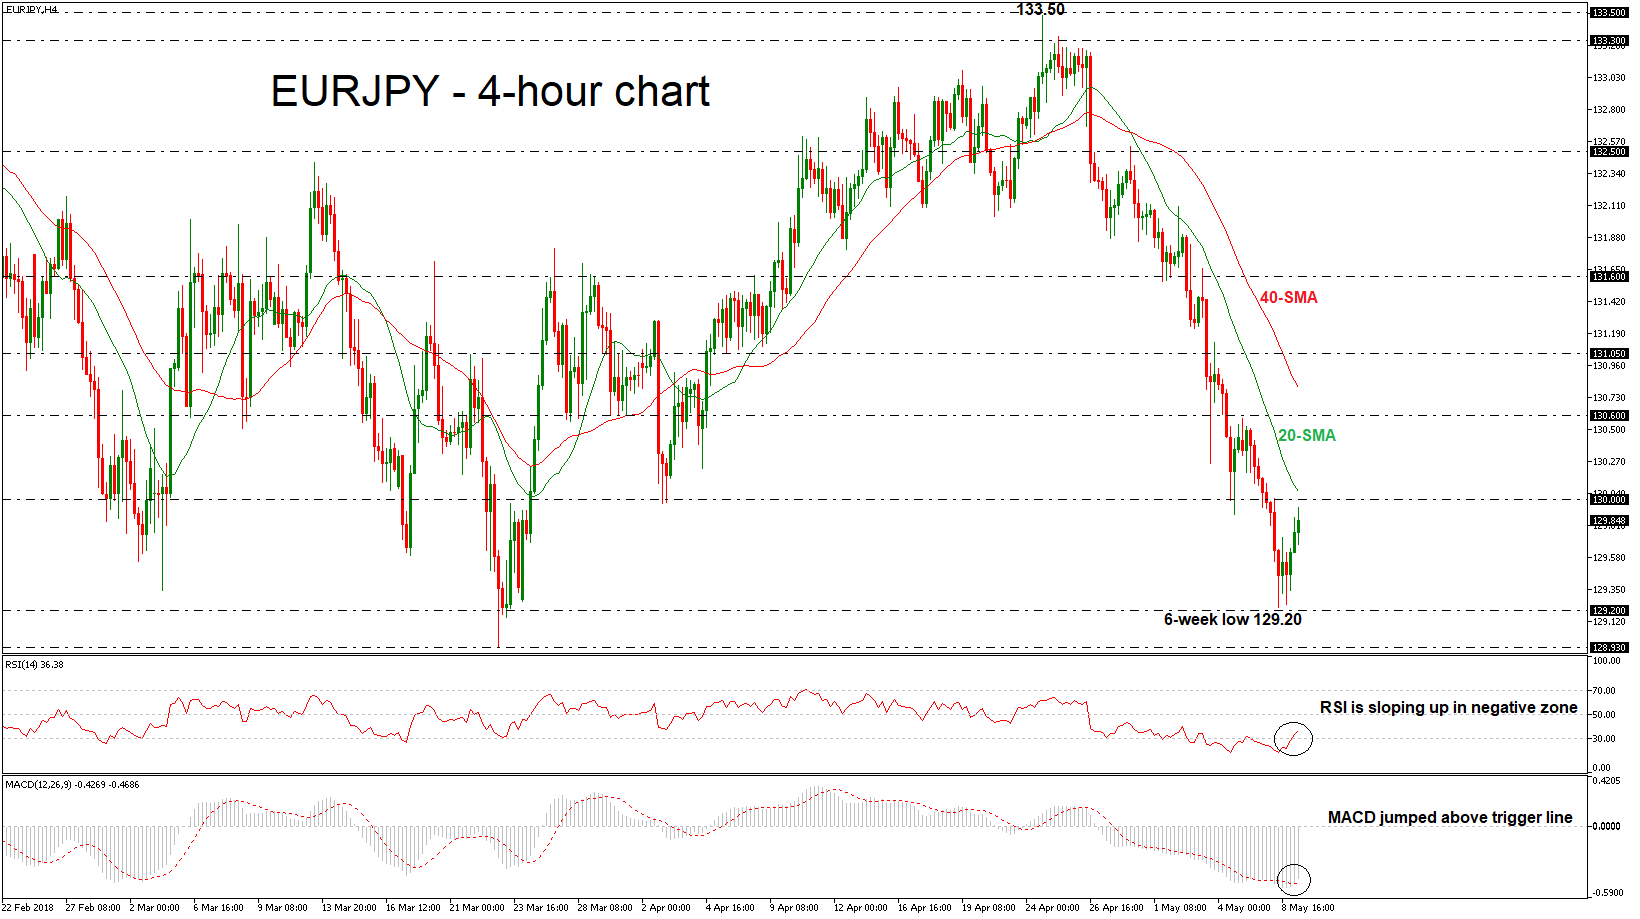
EURJPY is trying to snap the ten consecutive negative daily trading sessions after it created a six-week low near 129.20 on Tuesday. A bullish pullback in the short-term is expected further supported by the technical indicators.
Short-term momentum indicators are also pointing up for a creation of a bullish bias. The RSI indicator is turning positive in the negative zone, while the MACD oscillator recorded a positive cross with the trigger line in the bearish area as well.
The price is ready to touch the 20-simple moving average near 130.00 in the 4-hour chart following the gains over the past few hours. However, a climb above this obstacle could extend gains towards the 130.60 resistance level before re-challenging the 40-SMA of 130.80. A break above these barriers would shift the short-term bearish mode to a more bullish one as it would take the pair towards the 131.05 resistance.
Conversely, a resumption of the bearish correction in the 4-hour chart could drive the price below the 129.20 low until the 128.93 bottom, taken from the bottom on March 23. Further losses should see the August 2018 low of 127.50 come into view.
WTI Oil Surges To New 3 ½ Highs After US Decision To Pull Out Of Iran Nuclear Deal
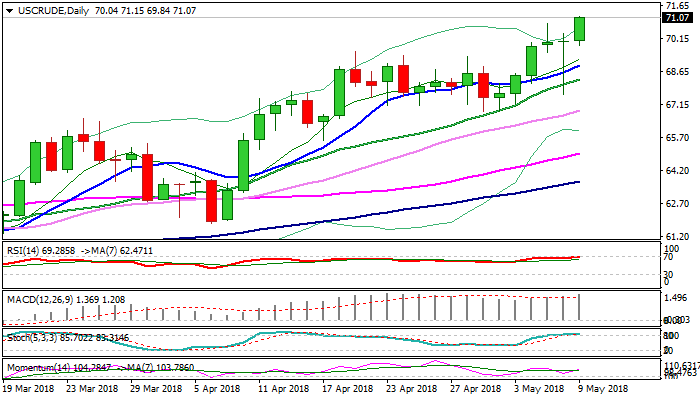
WTI oil cracked $71 barrier on Wednesday, hitting new 3 ½ year highs, on strong bullish acceleration following decision of the US to pull out from international nuclear deal with Iran.
Market reaction on such scenario was expected as new sanctions on Iran, the major oil producer in the Middle East, could increase uncertainty over global oil supplies and raise tensions in the region.
The decision would also lead to further tightening in the global oil market which would result in rising oil price.
Bullish techs reinforce positive sentiment for further gains as fresh bullish acceleration approaches initial target at $71.61 (Fibo 161.8% projection of the upleg from $66.84 trough).
Break higher would expose $72.24 (Fibo 200% projection), with bulls capable of travelling to next key barrier at $76.35 (Fibo 61.8% of 107.45/$26.04 Jun 2014 / Jan 2016 fall).
Rallies could be interrupted by corrective dips on overbought conditions which are expected to provide better buying opportunities.
Rising 10SMA (currently at $68.92) is expected to contain extended dips and keep bullish structure intact.
Res: 71.21, 71.61, 72.24, 73.00
Sup: 70.81, 70.00, 69.84, 68.92
Spot Gold Falls Back To 200SMA As Dollar Rallies
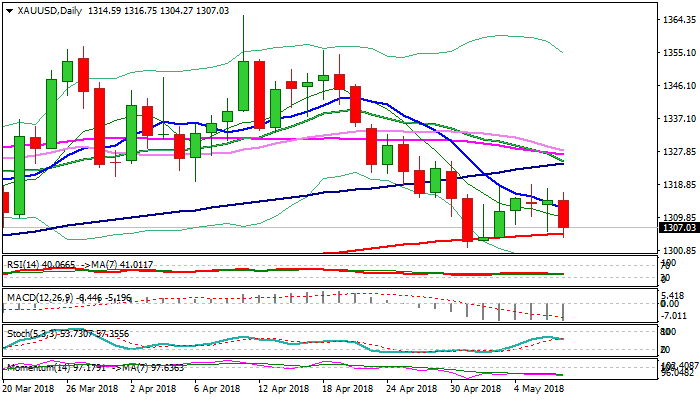
Gold price was sharply lower on Wednesday, as dollar rose on US decision to exit international nuclear deal with Iran.
The yellow metal spiked to one week low at $1304 and cracked key support provided by rising 200SMA which contained larger downtrend from $1355 last week.
Near term focus turns lower again as recovery phase stalled at $1318 (double-Doji on Mon-Tue) and subsequent bearish acceleration retraced over 76.4% of $1301/$1318 recovery leg, signaling an end of recovery phase.
Daily tech weakened and support attempts to eventually break below 200SMA ($1305) and generate strong bearish signal for extension towards $1286 (Fibo 61.8% of $1236/$1366) on break and close below pivotal supports at $1305/01.
Falling 10SMA which capped recovery attempts maintains bearish pressure and marks solid resistance at $1312, where corrective upticks should be limited.
Res: 1308, 1312, 1316, 1318
Sup: 1305, 1301, 1295, 1286