Sample Category Title
USD/JPY Bullish Breakout
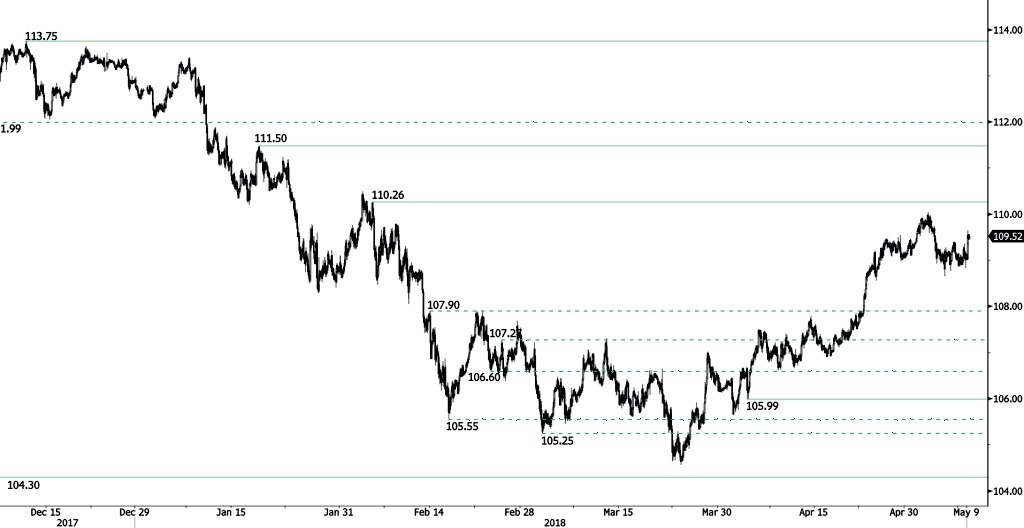
USD/JPY is bouncing off from 109 low following recent sideways price action, heading along the 109.75 range. The bearish pattern started in January 2018 is weakening. Hourly support and resistance are given at 105.99 (04/04/2018 high) and 110.26 (05/02/2018 low). The short-term technical structure suggests short-term upward moves.
We favor a long-term bearish bias. Support remains at 101.20 (09/11/2016 low). A gradual rise toward the major resistance at 125.86 (05/06/2015 high) seems unlikely. Expected to decline further support at 101.20 (09/11/2016 low). The pair trades below its 200 DMA.
GBP/USD Heading Lower
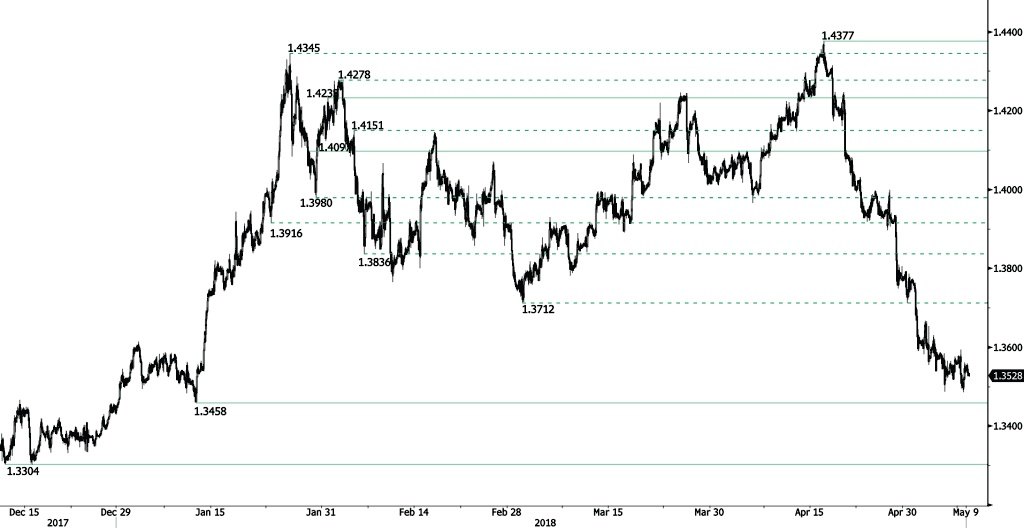
GBP/USD is decreasing, trading below 1.36 and heading along the 1.3500 range. The pair is currently trading at mid-January 2018 levels. Hourly support and resistance are given at 1.3458 (11/01/2018 low) and 1.4097 (29/01/2018 high). The technical structure suggests shortterm decrease.
The long-term technical pattern is reversing. The Brexit vote had paved the way for further decline but the pair is moving to 2016 highs. Long-term support and resistance are given at 1.1841 (07/10/2017 low) and 1.5018 (24/06/2016 high).
EUR/USD Continued Pressures
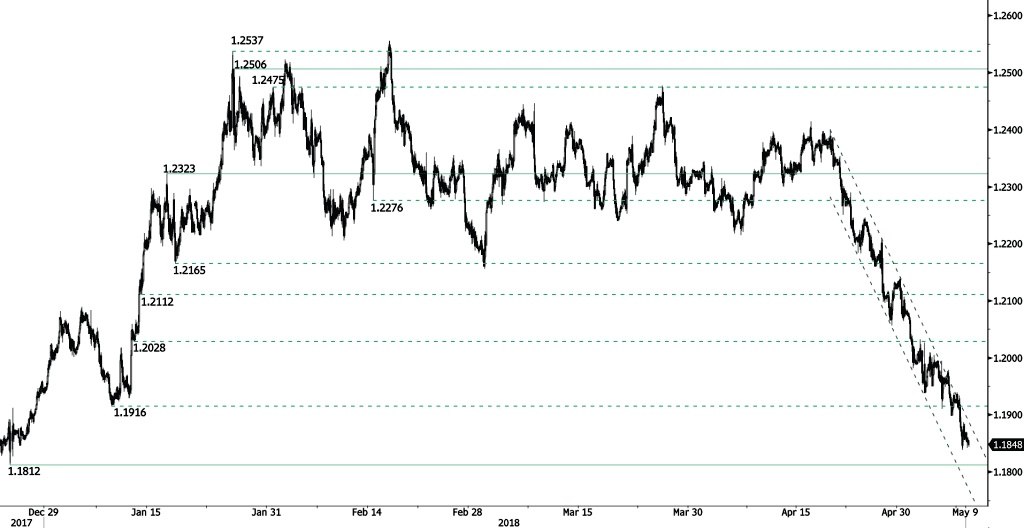
EUR/USD bearish pattern started from 1.24 (19/04/2018 high) continues, currently trading at 1.1850 and heading along the 1.1840 range. The pair is currently trading at December 2017 levels. Hourly support and resistance are given at 1.1812 (25/12/2017 low) and 1.2323 (17/01/2018 high). The technical structure suggests shortterm downward moves.
In the longer term, the momentum is turning largely positive. We favor a continued bullish bias. Key resistance is holding at 1.2886 (15/10/2014 high) while strong support lies at 1.1554 (08/11/2017 low).
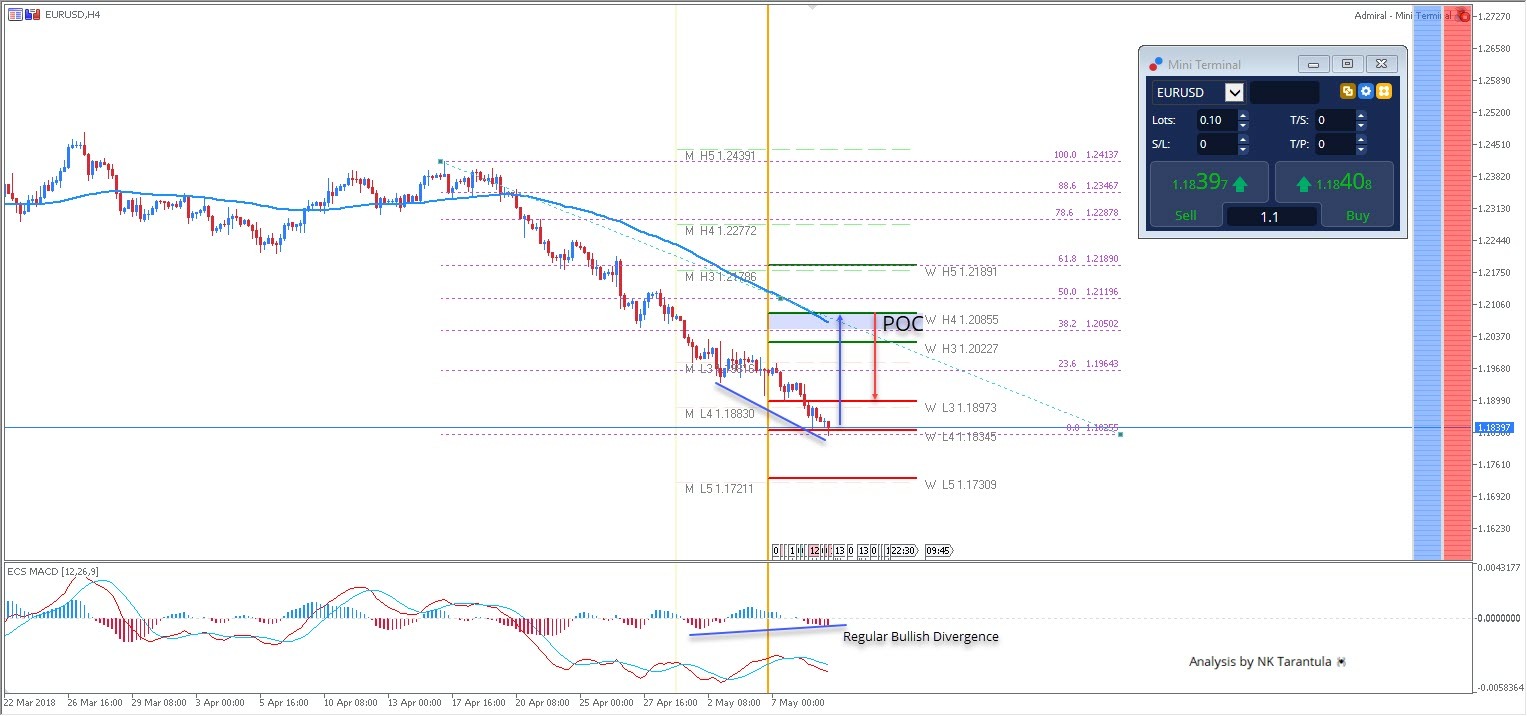
EUR/USD Regular Bullish Divergence In 4h Timeframe
The EUR/USD has reached W L4 support and we can see that the price has established a bullish divergence. If the 4h candle doesn't close below the W L4 – 1.1834 we might see a bounce to the upside possibly targeting W H3-1.2022 and W H4 – 1.2085. However 1.2050-85 is the zone for short sellers. If the price rejects from the zone, targets should be 1.2022, 1.1964 and 1.1897 that would complete a W L3 retest.
W L3 - Weekly Camarilla Pivot (Weekly Interim Support)
W H3 - Weekly Camarilla Pivot (Weekly Interim Resistance)
W H4 - Weekly Camarilla Pivot (Strong Weekly Resistance)
M H4 - Monthly Camarilla Pivot (Very Strong Monthly Resistance)
M L3 – Monthly Camarilla Pivot (Monthly Support)
M L4 – Monthly H4 Camarilla (Very Strong Monthly Support)
POC - Point Of Confluence (The zone where we expect price to react aka entry zone)
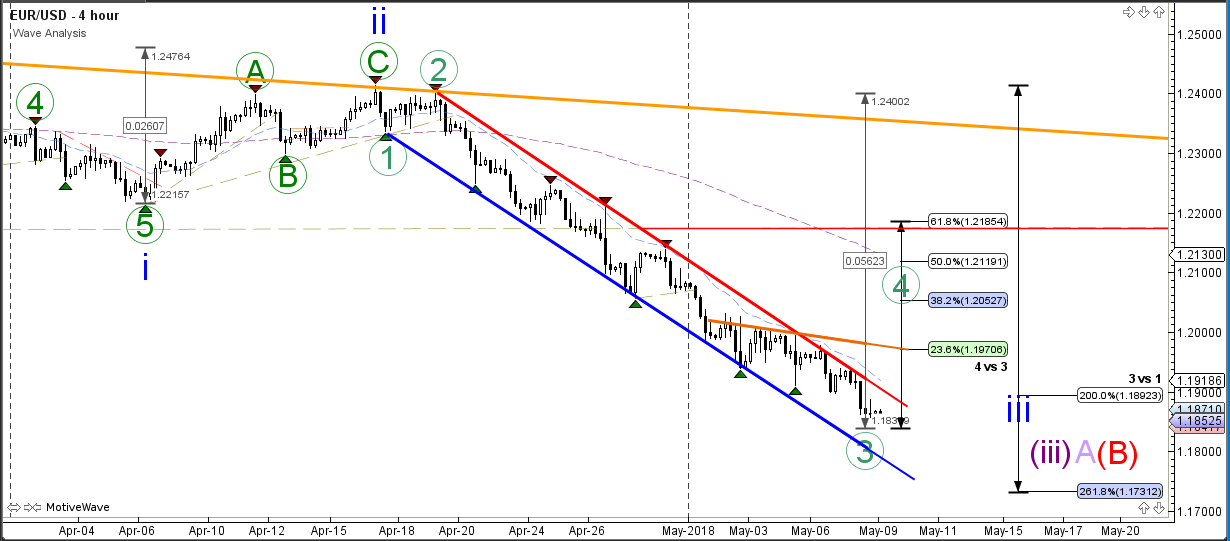
EUR/USD Bearish Breakout Continues In Downtrend Channel
The EUR/USD downtrend continued yesterday with one more lower low within wave 3 (green). The bearish momentum could be aiming at 1.17-1.18 support zone before a larger correction within a wave 4 (green) could take place. Price remains however in a downtrend as long as price stays within the bearish channel and only a bullish breakout above the resistance zone could indicate a bigger retracement.
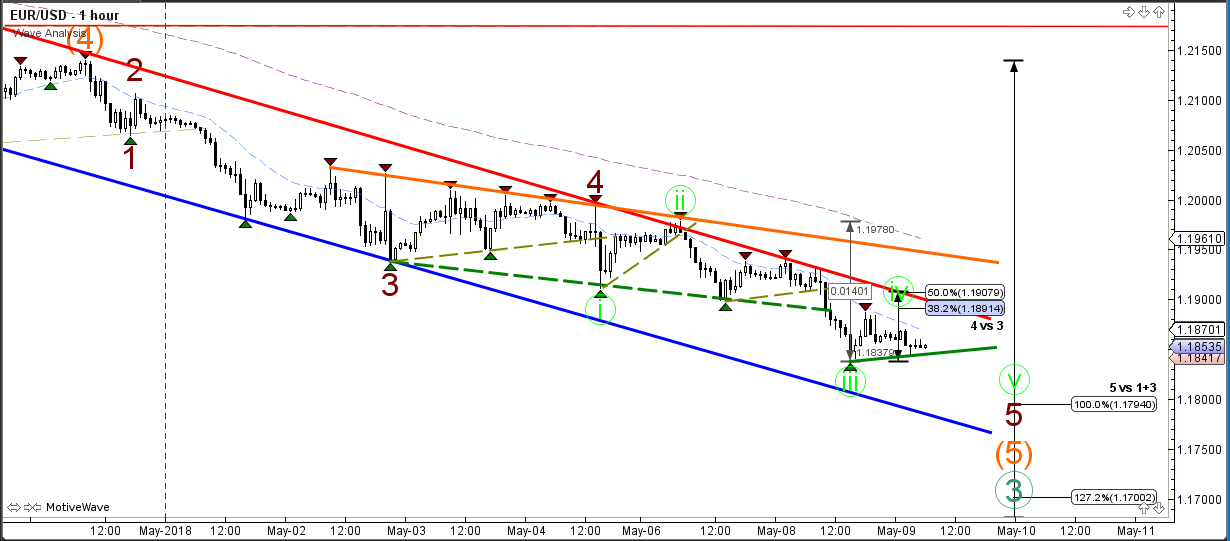
The EUR/USD broke multiple support trend lines (dotted green) as it fell below 1.1850. The current pullback is probably a smaller wave 4 (light green) as long as price stays below the bottom of wave 1 (light green) at 1.1910. A bullish break above this 50% Fib could mean that a different wave pattern is valid whereas a break below support (green) could see price make a bearish breakout and a new low.
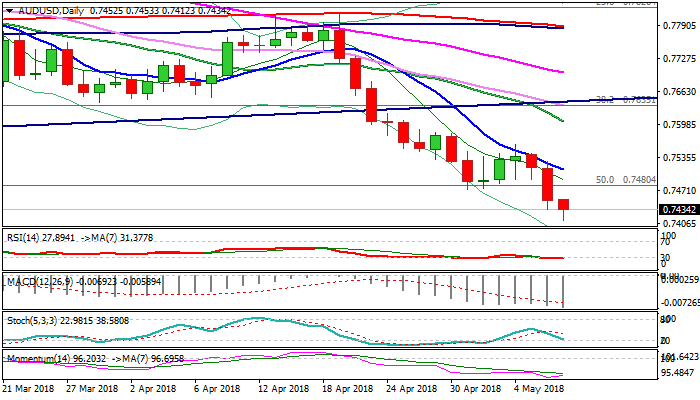
AUDUSD – Firm Bearish Setup Favors Further Weakness
The Aussie dollar extends bear leg from 0.7560 lower top to new 11-month low at 0.7412 on Wednesday.
Stronger dollar on uncertainty over Iran and higher oil prices keep Aussie firmly in red, along with bearish daily techs.
Bears approach psychological 0.7400 support and could extend towards next key support at 0.7321 (Fibo 61.8% of larger Jan 2016 / Jan 2018 0.6818/0.8135 recovery).
Falling 10SMA capped recent recovery attempts and continues to track descend, offers solid resistance at 0.7510 which is expected to cap corrective upticks.
Res: 0.7453, 0.7472, 0.7510, 0.7542
Sup: 0.7412, 0.7370, 0.7321, 0.7300
USDJPY – Fresh Bullish Acceleration Opens Way For Attack At Psychological 110 Barrier And 200SMA
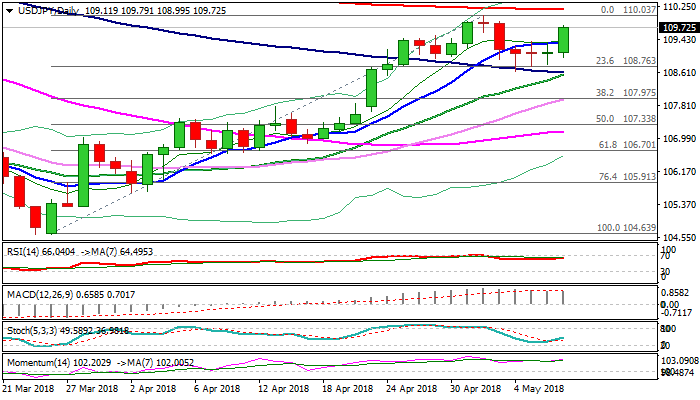
The USDJPY pair rallied on Wednesday, signaling an end of corrective phase from 110.03 high (02 May), which showed strong indecision at 108.83 Fibo support, shaped in triple long-legged Doji. The dollar was boosted by decision of US pulling out of Iran nuclear deal which also lifted US Treasury yields. Today's rally retraced over 76.4% of 110.03/108.64 pullback and turned focus higher for renewed attack at psychological 110.00 barrier and 200SMA (110.16). Bullish setup of daily techs (14-d momentum is turning up from sideways mode, slow stochastic is heading north and showing a plenty of space at the upside, while converged 20/100SMA's are about to form bull-cross. In addition, weekly cloud twists this week (110.89) and could attract for fresh extension higher. Bulls need clear break above 110.00/16 pivots to signal continuation of larger uptrend from 104.63 (26 Mar low) for test of targets at 110.48 (02 Feb high) and 110.87 (Fibo 61.8% of 114.73/104.63 Nov/Mar fall). Broken 10SMA offers initial support at 109.36 and should hold in order to keep fresh bulls in play.
Res: 110.03, 110.16, 110.48, 110.87
Sup: 109.44, 109.36, 108.99, 108.61
GBPUSD – 200SMA Still Holds But Strong Bearish Sentiment Maintains Risk Of Eventual Break Lower
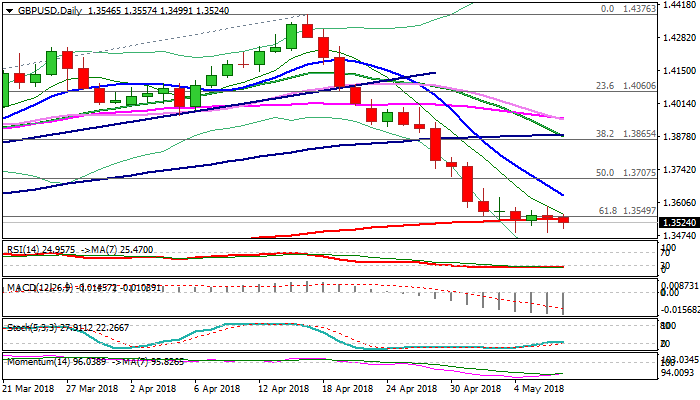
Cable moved lower in early Wednesday’s trading and probes again below 200SMA but remains for now within consolidation range (1.3484/1.3592) which extends into fourth straight day.
Steep fall from 1.4376 (2018 high) found footstep at 200SMA which resisted attacks in past three days, as repeated daily closes above 200SMA, keep the support valid.
However, no firmer basing signal has been generated yet, that keeps the downside vulnerable, as clear break below 200SMA would spark fresh extension of pullback from 1.4376 and expose key support at 1.3442 (Fibo 38.2% of 1.1930/1.4376, post-Brexit recovery phase).
Current sideways mode is helped by conflicting signals from daily studies (MA’s are in full bearish setup while slow stochastic emerged from oversold territory and 14-d momentum reversed higher), while falling 10SMA (1.3636) weighs and marks the upper pivot.
Overall sentiment remains negative and was further boosted by recent downbeat UK data which signaled the BoE would likely stay on hold in May and probably hike rates in their August meeting.
Res: 1.3541, 1.3575, 1.3592, 1.3636
Sup: 1.3484, 1.3442, 1.3400, 1.3346
EURUSD – Bears Approach Initial Target At 1.1790 And Could Extend To Next Key Support At 1.1709, Falling 10SMA...
The Euro remains under strong pressure on Wednesday and extends weakness to new multi-month lows.
President Trump's decision to pull out from a nuclear deal with Iran pushed dollar higher, while concerns about Italian political turmoil additionally weighs on the single currency.
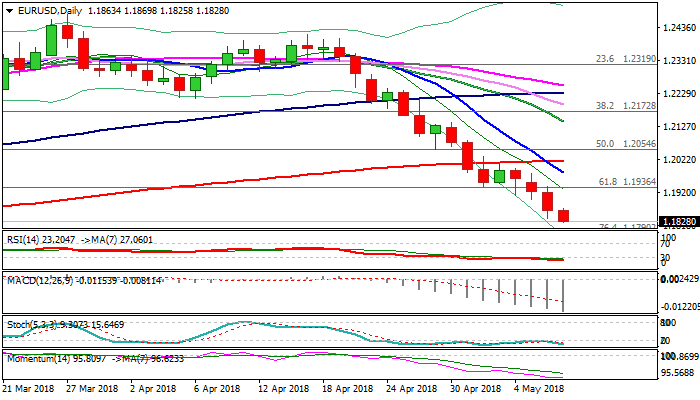
Fresh extension of steep downtrend from 1.2413 approaches initial target at 1.1790 (Fibo 76.4% of 1.1553/1.2555 ascend) and may extend towards next key support at 1.1709 (Fibo 38.2% of larger 1.0340/1.2555 bull-phase).
Meanwhile, bears may take a breather ahead of 1.1790 target as initial positive signals are developing on daily chart (14-d momentum turned sideways, oversold RSI and slow stochastic and bullish divergence on slow stochastic).
Falling 10SMA (1.1982) which formed death-cross with 200SMA, is expected to cap upticks and keep bearish structure intact.
Res: 1.1870, 1.1936, 1.1982, 1.2016
Sup: 1.1816, 1.1790, 1.1737, 1.1709
EURUSD Strongly Bearish Below 1.1900
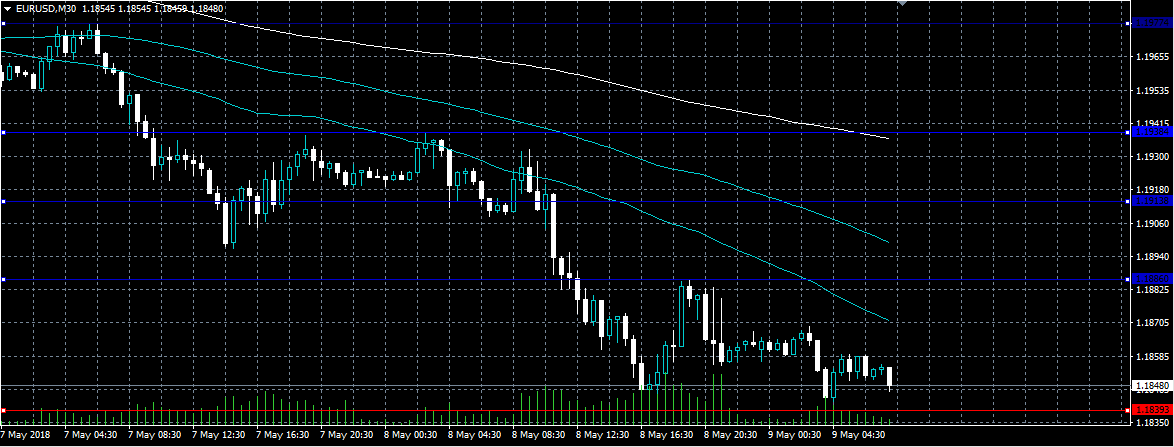
The euro has fallen to fresh monthly trading-low against the U.S dollar, hitting 1.1839, after much better than expected U.S Job Openings data caused the greenback to strengthen further. The EURUSD pair currently around the 1.1850 level, with strong downside pressure building after the 1.1900 level was clearly breached yesterday. Traders now look towards 1.1800 support level, and the release of the United States Producer Price Index later today.
The EURUSD pair is strongly bearish while trading below the 1.1900 level, further losses towards 1.1839 and 1.1800 seem possible in the short-term.
If the EURUSD pair starts to trade back above the 1.1886 level, we may see price bounce towards the 1.1913 and 1.1938 levels.