Sample Category Title
EUR/GBP Daily Outlook
Daily Pivots: (S1) 0.8736; (P) 0.8773; (R1) 0.8792; More...
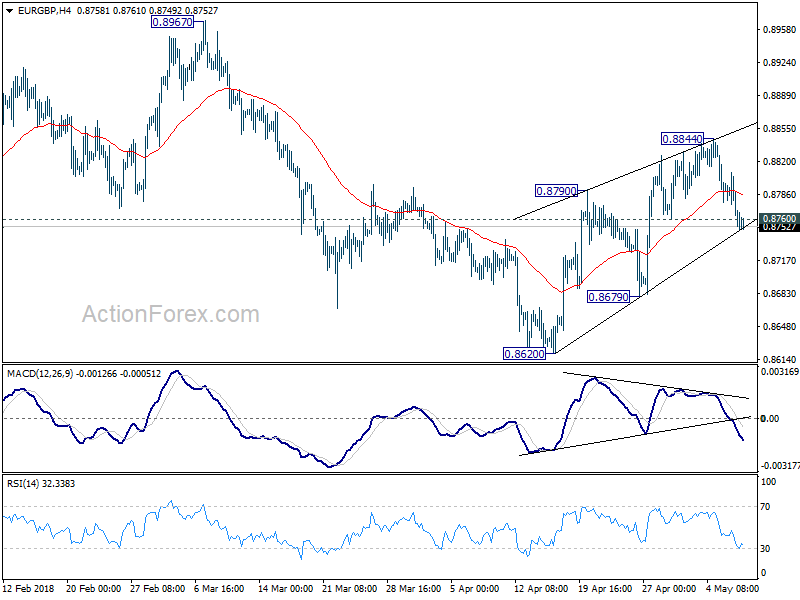
3The break of 0.8760 support suggests that rebound from 0.8620 is likely finished at 0.8844. The three wave corrective structure in turns argue that larger decline from 0.9305 is not completed yet. Intraday bias is turned back tot he downside for 0.8679 support first. Break will affirm this bearish case and target 0.8620 and below. On the upside, break of 0.8844 is now needed to revive the bullish case of reversal. Otherwise, outlook is now bearish even in case of recovery.
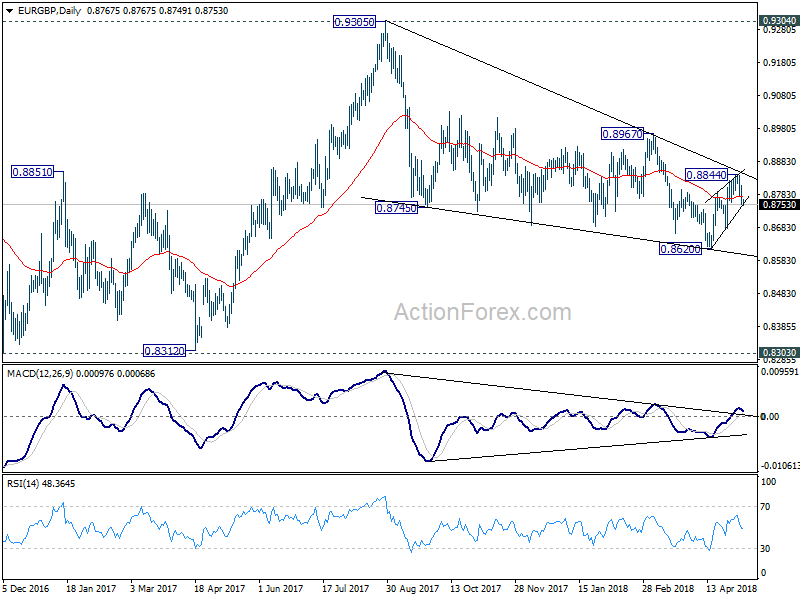
In the bigger picture, for now, the decline from 0.9305 is seen as a leg inside the long term consolidation pattern from 0.9304 (2016 high). Such consolidation pattern could extend further. Hence, in case of strong rally, we'd be cautious on strong resistance by 0.9304/5 to limit upside. Meanwhile, in another decline attempt, we'd expect strong support from 0.8116 cluster support (50% retracement of 0.6935 to 0.9304 at 0.8120) to contain downside.
EUR/AUD Daily Outlook
Daily Pivots: (S1) 1.5863; (P) 1.5903; (R1) 1.5956; More....
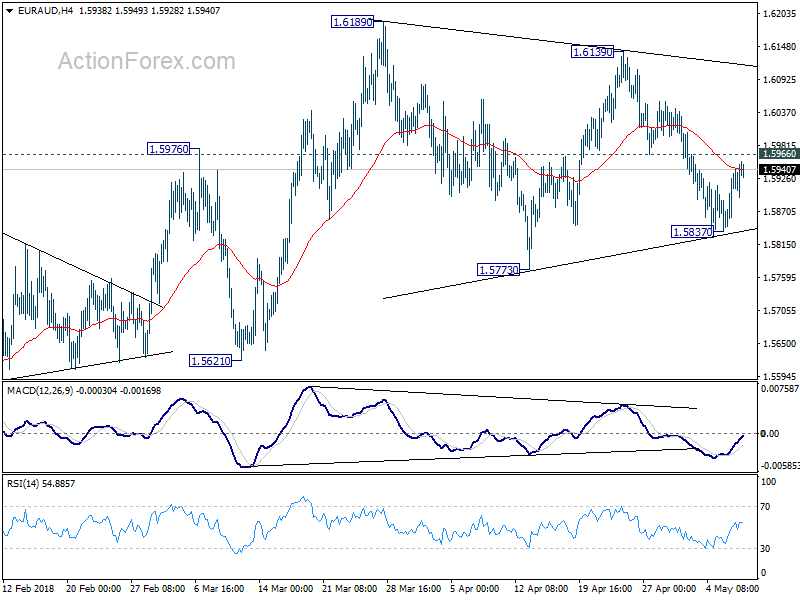
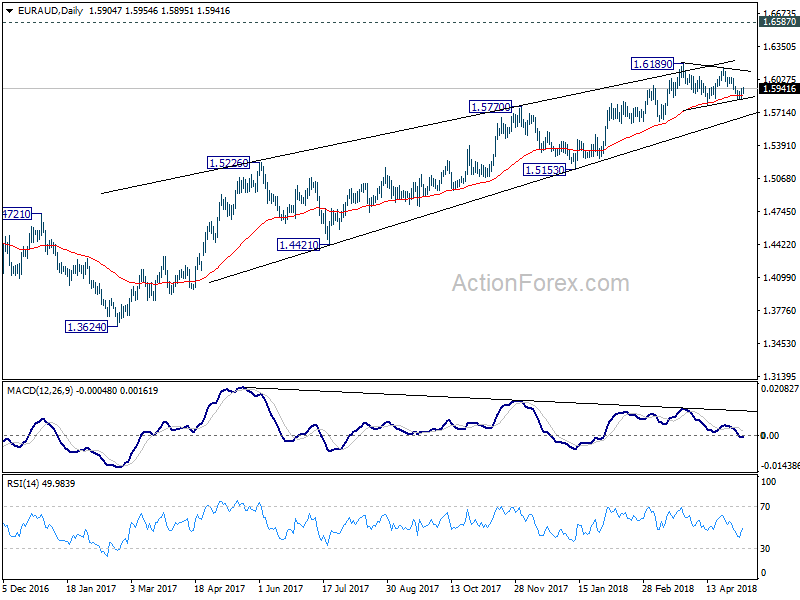
Intraday bias in EUR/AUD remains neutral at this point. Price actions from 1.6189 are forming a corrective pattern. Below 1.5837 will extend the leg fro 1.6139 and target 1.5773 support and below. But we'd expect strong support above 1.5621 to complete the pattern and bring rebound. On the upside, above 1.5966 support turned resistance will turn bias to the upside for 1.6139 resistance.
In the bigger picture, while there is bearish divergence condition in daily MACD, there is no clear sign of reversal yet. Current rally from 1.3624 could extend to 1.6587 key resistance (2015 high). Nonetheless, we'd expect further loss of upside momentum, and strong resistance from 1.6587 to limit upside and bring reversal. On the downside, sustained break of 1.5621 support should confirm reversal and turn outlook bearish for 1.5153 support and below.
EUR/CHF Daily Outlook
Daily Pivots: (S1) 1.1846; (P) 1.1903; (R1) 1.1940; More...
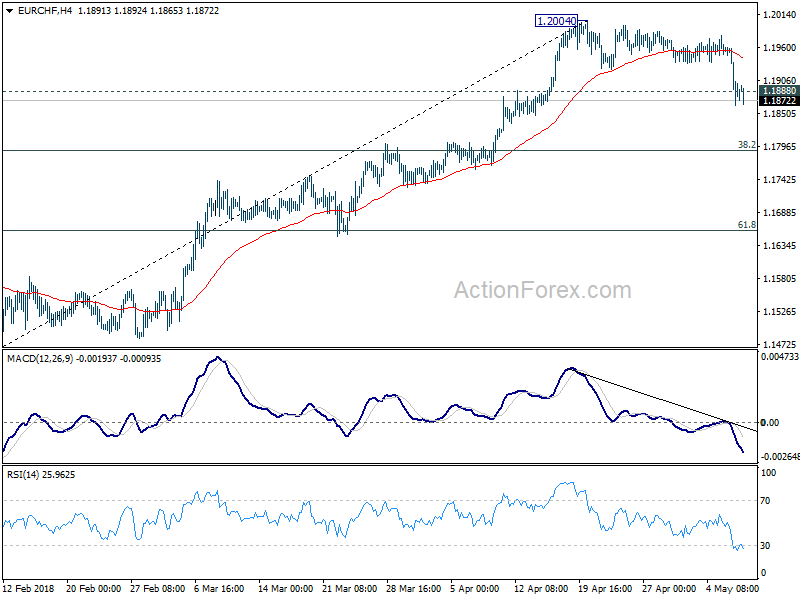
EUR/CHF's break of 1.1888 support indicates short term topping at 1.2004, after rejection by 1.2 handle. Intraday bias is turned back to the downside for pull back to 4 hour 55 EMA (now at 1.1816). For now, such decline is seen as correcting the rise from 1.1445 only. Hence, we'd expect strong support from 38.2% retracement of 1.1445 to 1.2004 at 1.1790 to contain downside and bring rebound. On the upside, break of 1.2004 is needed to confirm up trend resumption. Otherwise, we'd expect more corrective trading in near term.
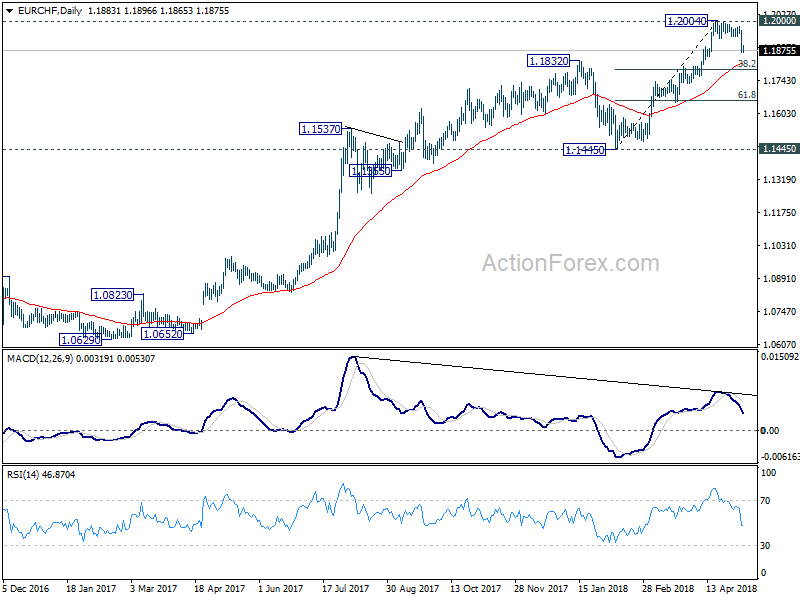
In the bigger picture, long term up trend in EUR/CHF is still in progress. Prior SNB imposed floor at 1.2000 was already met but there is no sign of reversal yet. As long as 1.1445 support holds, we'd expect the up trend to extend to 2013 high at 1.2649 next. However, considering bearish divergence condition in daily MACD. Break of 1.1445 will be an indicate of medium term reversal and will turn outlook bearish.
Lasting Impacts of Trump’s Unilateral Withdrawal from Iran Nuclear Deal
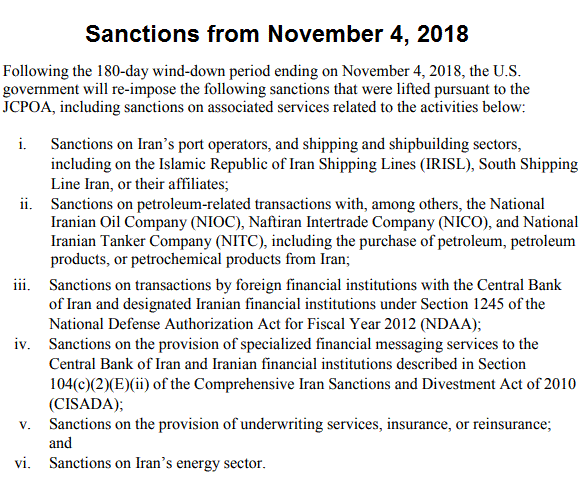
Donald Trump confirmed that the US would withdraw from the Iran nuclear deal, an agreement reached in 2015 between Iran, the P5+1 (5 UNSC permanent members including US, France, Russia, UK, China + Germany) and the European Union. New sanctions, both financial sanctions and bans of oil exports, would be re-instituted on Iran. The closely-watched crude oil prices slumped from almost 4-year highs before recovery. The front-month WTI contract slumped to US$ 67.63/bbl after the news before regaining the level of US$ 70/bbl in Asia session today. The contract jumped to US$ 70.84/bbl last Friday. While managing to make a fresh 3.5-year high earlier today, the Brent crude contract retreated modestly after the news before closing largely flat. Brent oil price is more affected by Trump’s move as Iran’s oil exports are mainly destined to European and Asian countries. Geopolitical uncertainty would likely cause great volatility in the oil market in the near term. In the longer-term, we believe the move has more implications on geopolitics than oil fundamentals, both would affect oil prices and the financial markets, though.
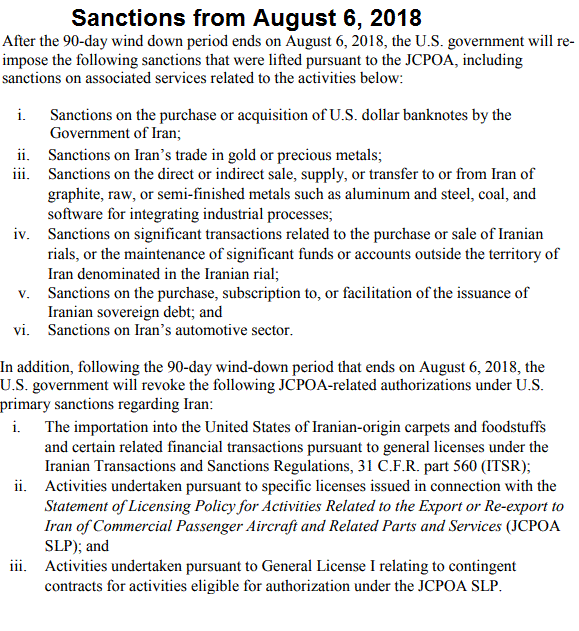
In signing an executive order that will withdraw the US from the Iran nuclear deal, Trump has triggered a 180-day countdown period for the White House to re-institute all of the sanctions on Iran that were relaxed according to the deal. Many of the sanctions (see end of the report) would be re-instituted in 90 days, by August 6, though. Financial market reaction to the announcement was rather muted as it probably has “priced in”. Moreover, if Trump had not chosen to scrap the deal, he would have renewed the waiver but reiterated his opposition to it. The latter only delay the decision for some time.
Iran’s Oil industry
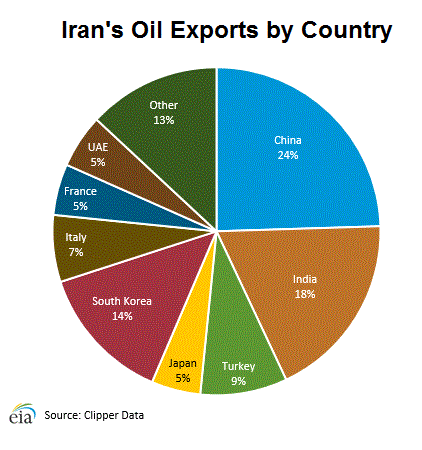
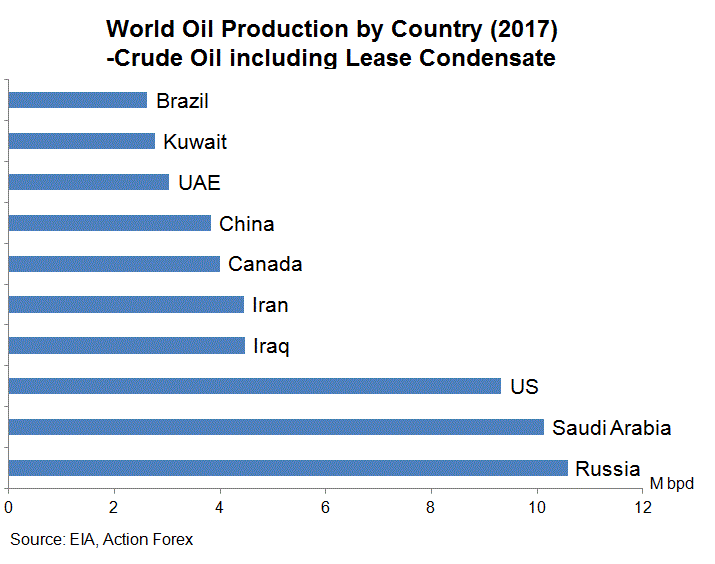
As a founding member of OPEC, Iran holds the world’s fourth-largest proved crude oil reserves (10%) and the world’s second-largest natural gas reserves (13%). While the United Nation Security Council (UNSC) began imposing nuclear activities-related sanctions against Iran in 2006, what affected the country’s oil industry most were those imposed in 2011 and 2012. Accompanied with the economic recession after the global financial crisis, the sanctions had sent Iran’s oil production to about 3M bpd, compared with about 4M bpd prior to that. European refiners had been purchasing and processing Iranian crude oil until those sanctions. A number of European countries, including Croatia, France, Greece, Italy, Malta, Netherlands, Poland, and Spain, resumed their purchases as the sanctions were lifted in 2015. According to the US Energy Information Agency (EIA), Iran produced nearly 4.7M bpd of petroleum and other liquids, of which 3.8M bpd was crude oil. Iranian total liquids production rose in 2017 relative to 2016 by +0.5M bpd. Last year, oil production of Saudi Arabia and the US reached 10M bpd. Crude oil and condensate exports averaged 2.5M bpd in 2017, up +0.2M bpd from the 2016 average. China and India accounted for about 43% of all Iranian exports in 2017, and Turkey and South Korea took substantial volumes during the year.
Impacts of Withdrawal might be Limited
Whether Trump’s renewed sanctions against Iran would significantly tighten the oil market remains to be seen. So far, it is the US’ unilateral action to pull out of the plan and other countries are condemning his action. As French President Emmanuel Macron commented, “France, Germany, and the UK regret the US decision to leave the JCPOA. The nuclear non-proliferation regime is at stake”. Israel has been the only country openly supporting this move. Prime Minister Benjamin Netanyahu praised it as a “brave decision" as the deal has “allowed Iran to enrich enough uranium for an entire arsenal of nuclear bombs". Iran’s oil is mainly destined to Asia and Europe. If these countries choose to continue adhering to the deal, it should not have much impact on the oil exports. Impact on US oil supply should be limited Thanks to the aggressive shale investment over the past years, the US is largely self-sufficient oil.
Intensifying Geopolitical Uncertainty
While US' withdrawal from the deal might have limited impacts oil fundamentals, the move can have lasting legacy from geopolitical perspective. The move is deliberately provocative in nature. This could encourage retaliation from Iran which, once again depending on whether other powers would follow the US, might find strong reasons to resume development of mass destruction weapons. Trump's decision would inevitably destabilize the Middles East. Moreover, it has also dampened the prospect of denuclearizing North Korea, which possesses nuclear weapons but has recently indicated the willingness to denuclearize under certain conditions. Trump’s decision has presented to North Korea and other powers in the world that negotiating with the US is worth little.
USD/CAD Daily Outlook
Daily Pivots: (S1) 1.2847; (P) 1.2872; (R1) 1.2907; More....
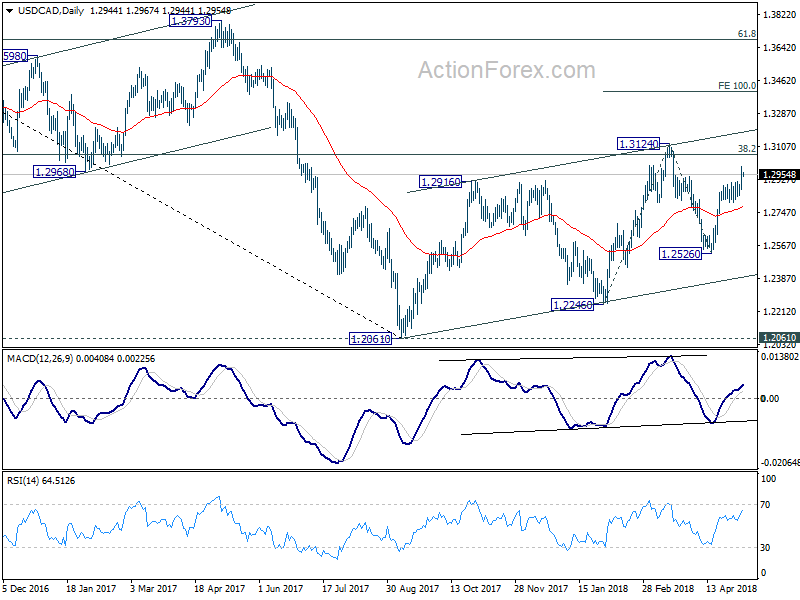
Intraday bias in USD/CAD remains on the upside as rise from 1.2526 is in progress for retesting 1.3124 key resistance. Decisive break there will extend later rebound to 100% projection of 1.2246 to 1.3124 from 1.2526 at 1.3404 next. On the downside, break of 1.2802 support is now needed to indicate near term topping. Otherwise, outlook will remain bullish in case of retreat.
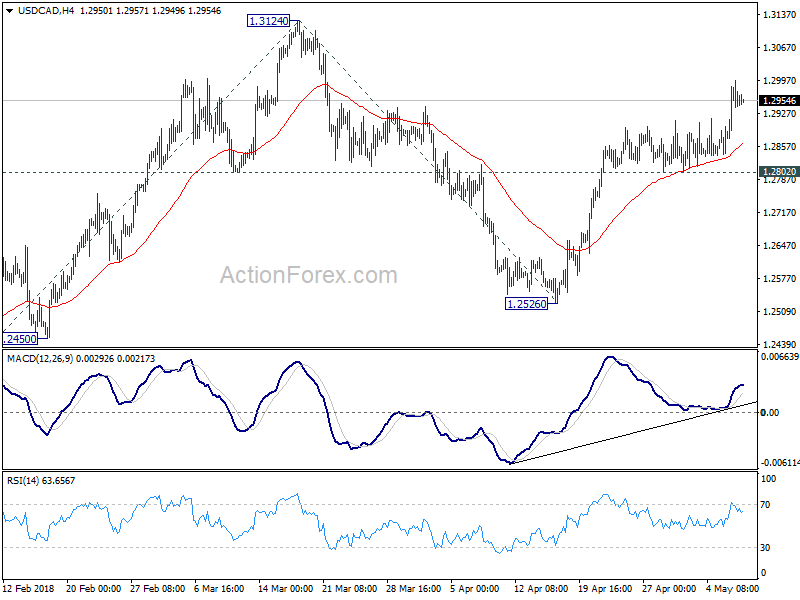
In the bigger picture, current development suggests that rebound from 1.2061 has not completed yet. Focus is back on 38.2% retracement of 1.4689 to 1.2061 at 1.3065. Sustained trading above there will confirm medium term bullish reversal. That is, down trend from 1.4689 has completed at 1.2061 already. In that case, next target will be 61.8% retracement at 1.3685.
AUD/USD Daily Outlook
Daily Pivots: (S1) 0.7414; (P) 0.7471; (R1) 0.7508; More...
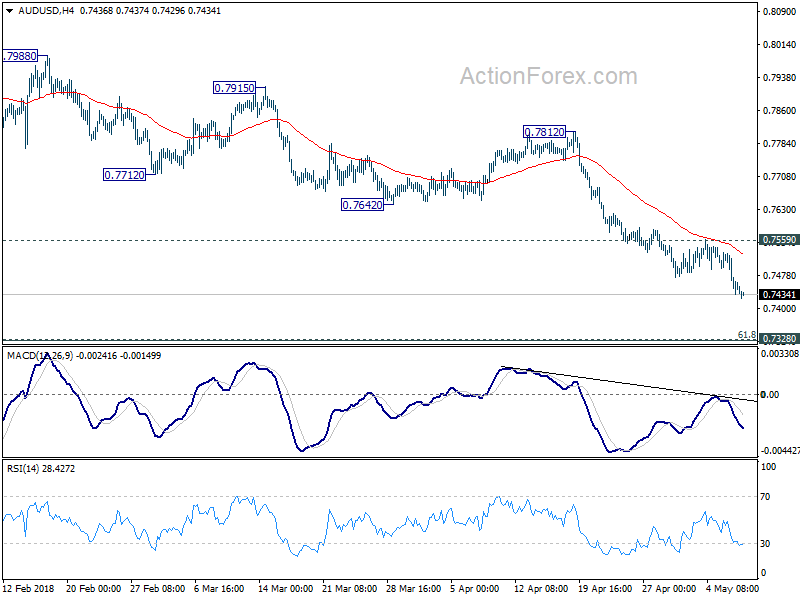
Intraday bias in AUD/USD remains on the downside for the moment. Current decline should target next cluster support at 0.7328 (61.8% retracement of 0.6826 to 0.8135 at 0.7326). Sustained break will add more credence to the case of long term down trend resumption and target 0.7158 support next. On the upside, break of 0.7559 resistance is needed to indicate short term bottoming. Otherwise, outlook will stay bearish in case of recovery.
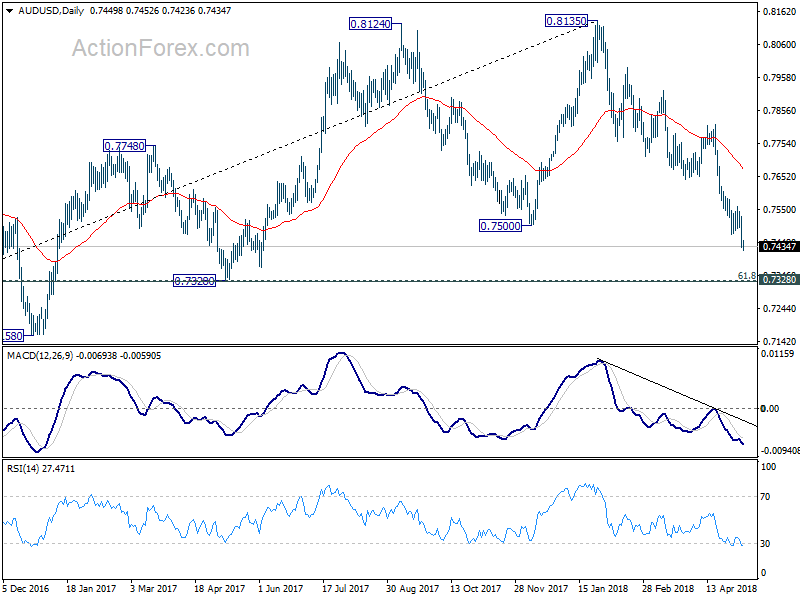
In the bigger picture, medium term rebound from 0.6826 is seen as a corrective move. Decisive break of 0.7500 key support suggests that such correction is completed at 0.8135. Deeper decline would be seen back to retest 0.6826 low. In case of another rise, we'd expect strong resistance from 38.2% retracement of 1.1079 to 0.6826 at 0.8451 to limit upside to bring long term down trend resumption eventually.
EUR/USD Daily Outlook
Daily Pivots: (S1) 1.1821; (P) 1.1879 (R1) 1.1922; More....
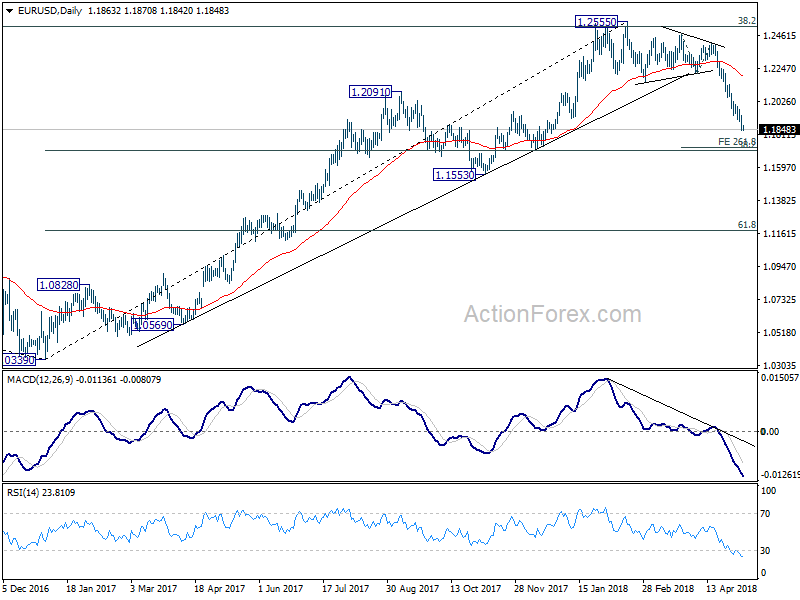
Intraday bias in EUR/USD remains on the downside at this point. Current fall is in progress to 261.8% projection of 1.2475 to 1.2214 from 1.2413 at 1.1730. As it will then be close to 1.1708 medium term fibonacci level, some support could be seen around 1.1708/30 to bring rebound. Though, break of 1.1938 minor resistance is needed to be the first sign of short term bottoming. Otherwise, outlook will remain bearish in case of recovery.
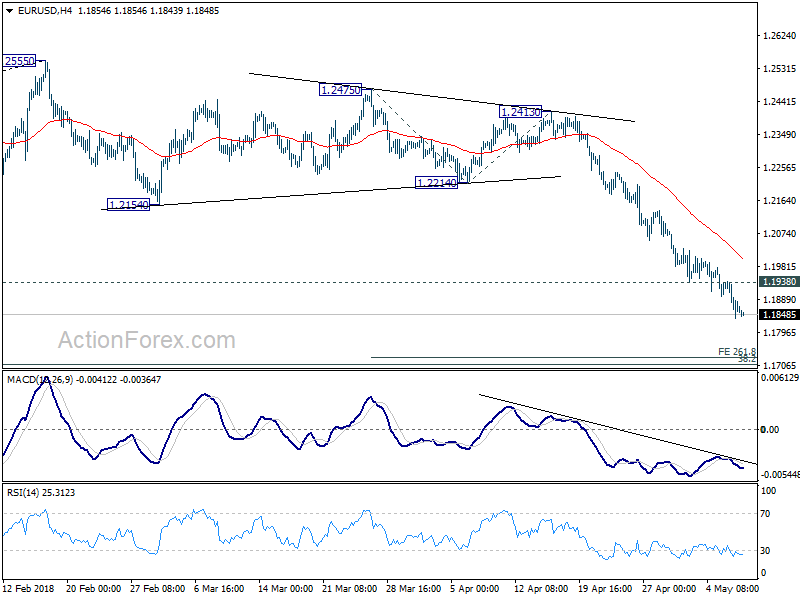
In the bigger picture, current decline and firm break of 1.2154 support confirms rejection by 38.2% retracement of 1.6039 (2008 high) to 1.0339 (2017 low) at 1.2516. A medium term top should be in place at 1.2555 and deeper decline would be seen back to 38.2% retracement of 1.0339 to 1.2555 at 1.1708 first. With current downside acceleration, there is prospect of hitting 61.8% retracement at 1.1186 before completing the decline. But still, we'll need to look at the structure before deciding if it's a corrective or impulsive move.
GBP/USD Daily Outlook
Daily Pivots: (S1) 1.3489; (P) 1.3541; (R1) 1.3598; More...
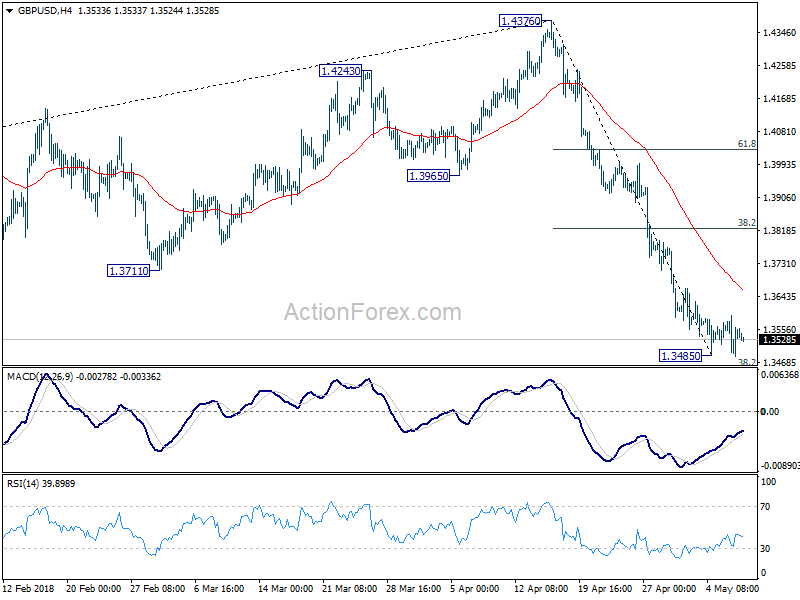
Consolidation from 1.3485 is still in progress and intraday bias in GBP/USD remains neutral. Another recovery could be seen. But upside is expected to be limited by 38.2% retracement of 1.4376 to 1.3485 at 1.3825 to bring fall resumption. Break of 1.3485 will resume the fall from 1.4376 to 1.3448 fibonacci level next.
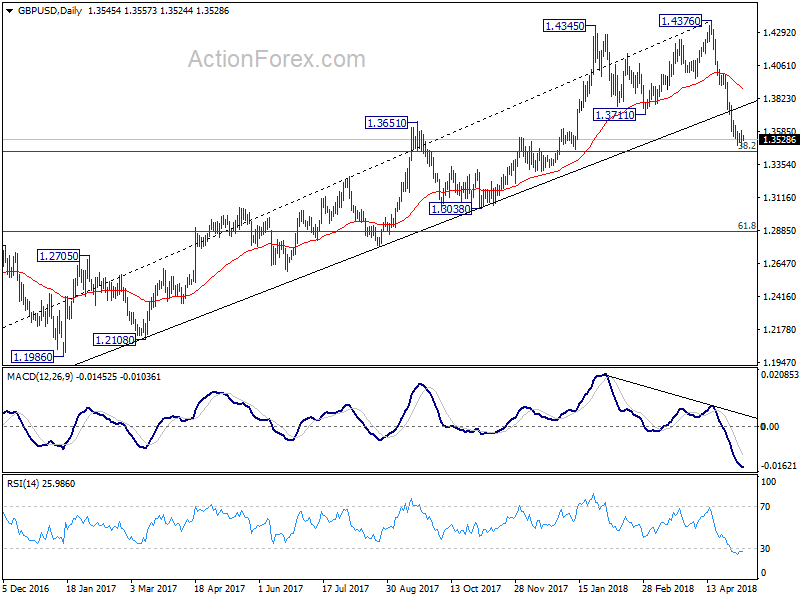
In the bigger picture, current development suggests that whole medium term rebound from 1.1936 (2016 low) has completed at 1.4376 already, with trend line broken, on bearish divergence condition in daily MACD, after rejection from 55 month EMA (now at 1.4223). Deeper decline should be seen to 38.2% retracement of 1.1936 (2016 low) to 1.4376 at 1.3448 first. Break will target 61.8% retracement at 1.2874 and below. Outlook will stay bearish as long as 55 day EMA (now at 1.3925) holds, even in case of strong rebound.
USD/CHF Daily Outlook
Daily Pivots: (S1) 0.9997; (P) 1.0021; (R1) 1.0040; More...
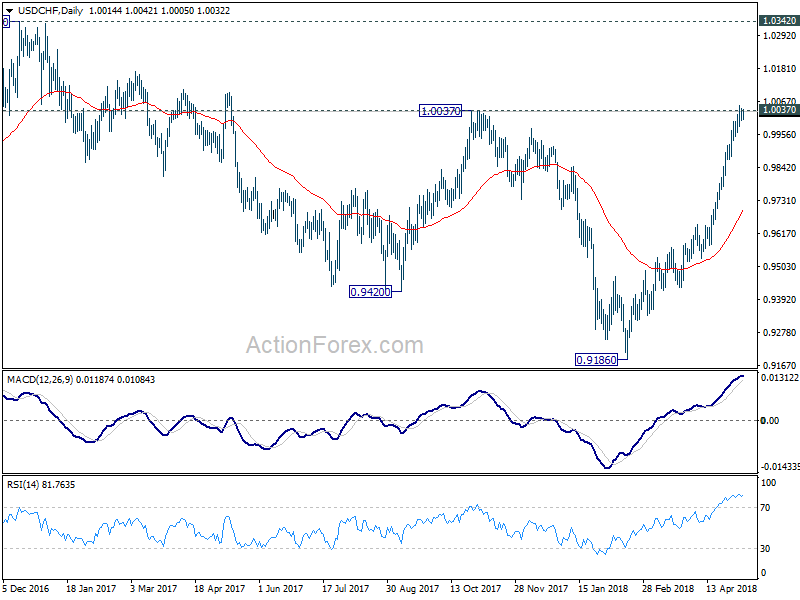
With 0.9982 minor support intact, intraday bias stays on the upside for further rally. Sustained trading above 1.0037 will pave the way to 1.0342 key resistance next. On the downside, though, below 0.9982 minor support will indicate short term topping, on bearish divergence condition in 4 hour MACD. And, in that case, deeper retreat could be seen, possibly to trend line support (now at 0.9731) before staging another rally.
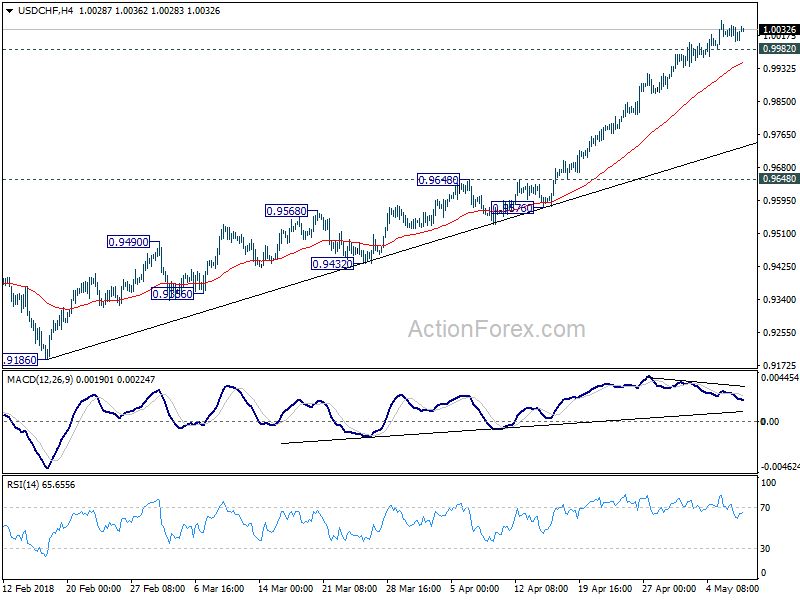
In the bigger picture, medium term decline from 1.0342 has completed with three waves down to 0.9186. Rise from there is currently viewed as a leg inside the long term range pattern. Hence, while further rally would be seen, we'd be cautious on strong resistance from 1.0342 to limit upside. For now, further rise is expected as long as 0.9648 resistance turned support holds, even in case of pull back.
Forex Technical Analysis: EUR/USD, USD/JPY, GBP/USD
EUR/USD
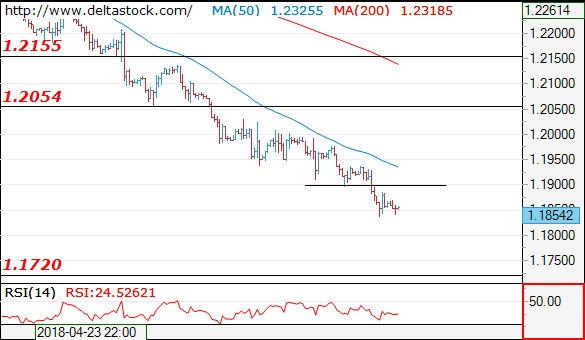
Current level - 1.1854
The downtrend remains intact below 1.1900, for a continuation towards 1.1720. Crucial on the upside is 1.1950.
| Resistance | Support | ||
| intraday | intraweek | intraday | intraweek |
| 1.1900 | 1.2060 | 1.1840 | 1.1840 |
| 1.2060 | 1.2160 | 1.1720 | 1.1720 |
 USD/JPY
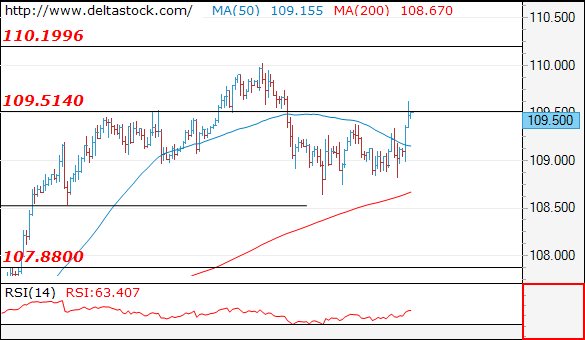
Current level - 109.50
Current violation of 109.50 resistance has brought a bit of confusion in the negative bias, but my outlook remains bearish against 110.00 high, for a break through the 108.80 trigger, towards 107.90.
| Resistance | Support | ||
| intraday | intraweek | intraday | intraweek |
| 110.00 | 110.20 | 108.80 | 107.90 |
| 110.20 | 111.90 | 107.90 | 104.60 |
GBP/USD
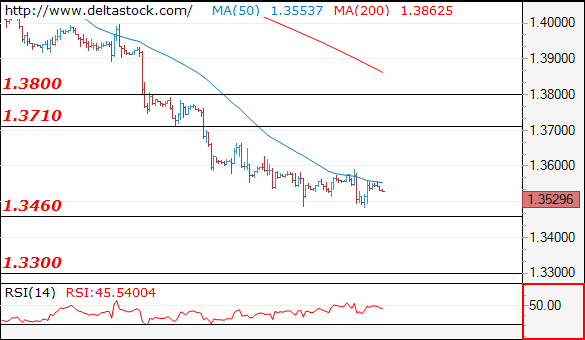
Current level - 1.3529
Despite the failure at 1.3480 low my outlook remains bearish, for a slide through 1.3460, towards 1.3300 zone. Initial intraday resistance lies at 1.3590, followed by 1.3710 area.
| Resistance | Support | ||
| intraday | intraweek | intraday | intraweek |
| 1.3590 | 1.3990 | 1.3480 | 1.3460 |
| 1.3710 | 1.4100 | 1.3460 | 1.3310 |