Sample Category Title
GBPUSD Still Finding Buyers Above 1.3500
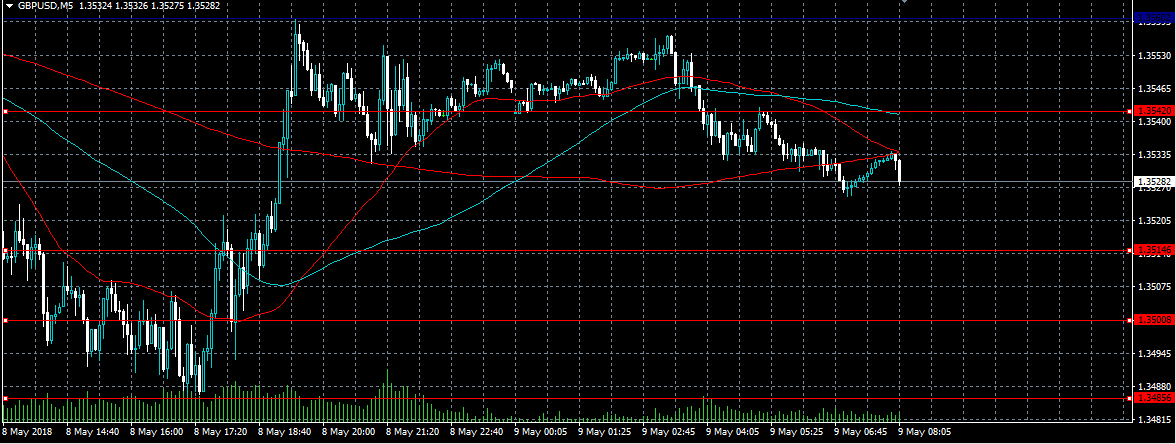
The British pound continues to find dip-buying interest, with price still trading well above the 1.3500 level against the U.S dollar, after Tuesday’s strong bounce from the 1.3483 level. The GBPUSD pair currently trades around the 1.3530 level, after finding strong technical resistance from the 1.3560 level. Sterling traders now look towards U.S PPI Inflation data later today and are likely to remain cautious ahead of Thursday’s Bank of England meeting.
The GBPUSD pair may continue to trade higher while price holds above the 1.3500 level. Key upside resistance is found at the 1.3560 and 1.3592 levels.
If the GBPUSD pair falls below the 1.3500 level again, key support is then found at the 1.3483 and 1.3460 levels.
Bitcoin Falls After Buffett Criticism
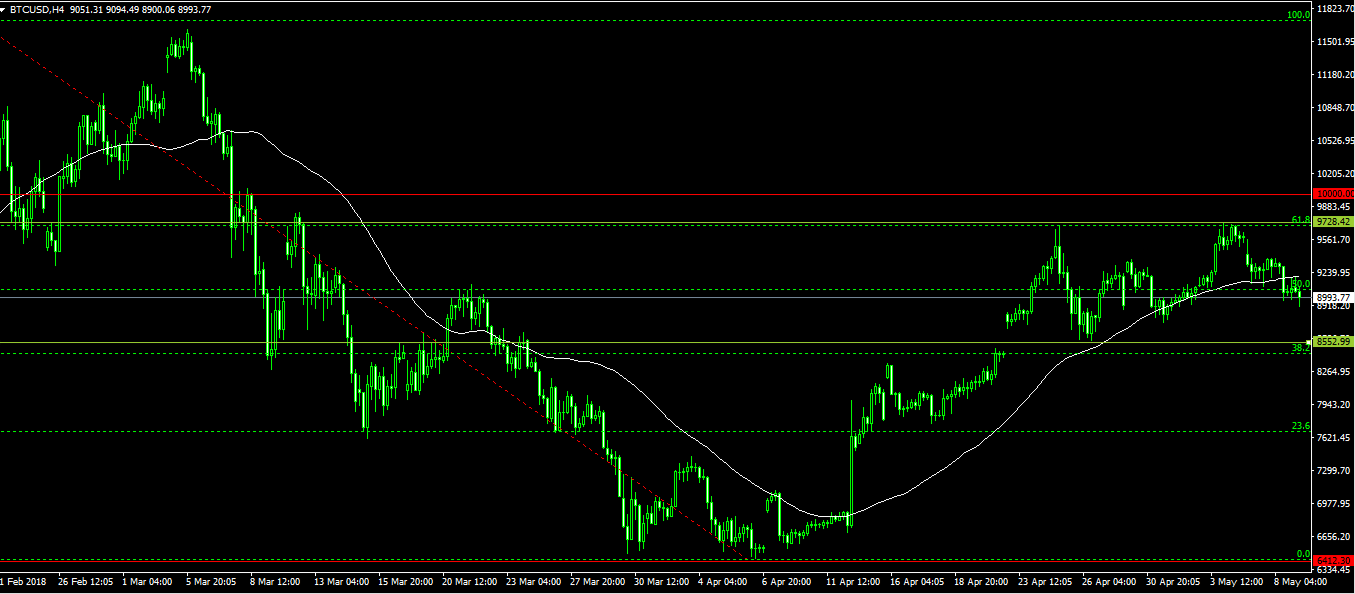
The price of bitcoin has nosedived following renewed crypto criticism from renowned investor and CEO of Berkshire Hathaway, Warren Buffett. Despite reaching a high of $11,700 in March, bitcoin tumbled throughout April and is now trading at $8965. The digital currency has had three consecutive days of losses following negative media attention.
At the annual Berkshire Hathaway shareholder's meeting which took place on Saturday 5th May 2018, Buffett was questioned yet again about his crypto stance. He expressed his views that cryptocurrencies would come to a ‘bad ending’ and compared them to ‘rat poison squared.’
During a three hours exclusive CNBC interview on Monday, millionaire Buffett also reiterated his negative crypto views by saying that that bitcoin had no value and that buyers only bought it hoping that the price would go up.
However, Warren has been wrong before. He is famously known for avoiding technology companies like Google and Facebook when they became public. Had he invested then, his holdings would have been significantly larger. He also invested in IBM, an investment he exited recently at a loss.
Despite tumbling bitcoin prices, there is still a probability that the BTC/USD pair will continue moving higher, as Wall Street moves to recognize the value of cryptocurrencies. Traders should watch out for the psychologically-important level of $10,000. If it crosses this price, there is a chance that it could continue the upward momentum and possibly test the $11,700 high.
Inflation, Monetary Policy To Drive Headlines On Wednesday
A steady stream of economic data and monetary policy fills the economy calendar on Wednesday. For traders of North America, the afternoon session will feature an important rate announcement from the Reserve Bank of New Zealand (RBNZ).
Action begins at 06:45 GMT with the release of French industrial production data. Factory production in the Eurozone's second largest economy is forecast to rise 0.4% in March, compared with 1.2% the month before.
Spain will also issue industrial output figures 15 minutes later. The government in Madrid is expected to show annualized growth of 3.3% for March.
Italy will report on retail sales at 08:00 GMT. The report, which is seen as a key proxy for consumer spending, is expected to show growth of 0.1% for March.
Shifting gears to North America, the Mortgage Bankers Association will report on weekly mortgage applications for the period ending 4 May.
Later in the morning, the Department of Labor will issue its most recent producer inflation report. The producer price index (PPI) is forecast to rise 0.2% in April following a 0.3% uptick the month before. Compared to April 2017, PPI is projected to rise 2.8%.
Excluding food and energy, PPI is projected to rise 0.2%.
The Department of Commerce will report on wholesale inventories at 14:00 GMT. Thirty minutes later, the US Energy Information Administration (EIA) will report on crude inventories for the week ended 4 May.
Monetary policy speculators will also be keeping tabs on FOMC member Raphael Bostic, who is scheduled to deliver a speech at 17:15 GMT.
The RBNZ will deliver its policy verdict at 21:00 GMT, which corresponds with the morning session on Thursday in Oceana. However, North American traders can still observe the release. No change in policy is expected at this time. The central bank will hold a press conference one hour after the monetary policy statement is released.
EUR/USD
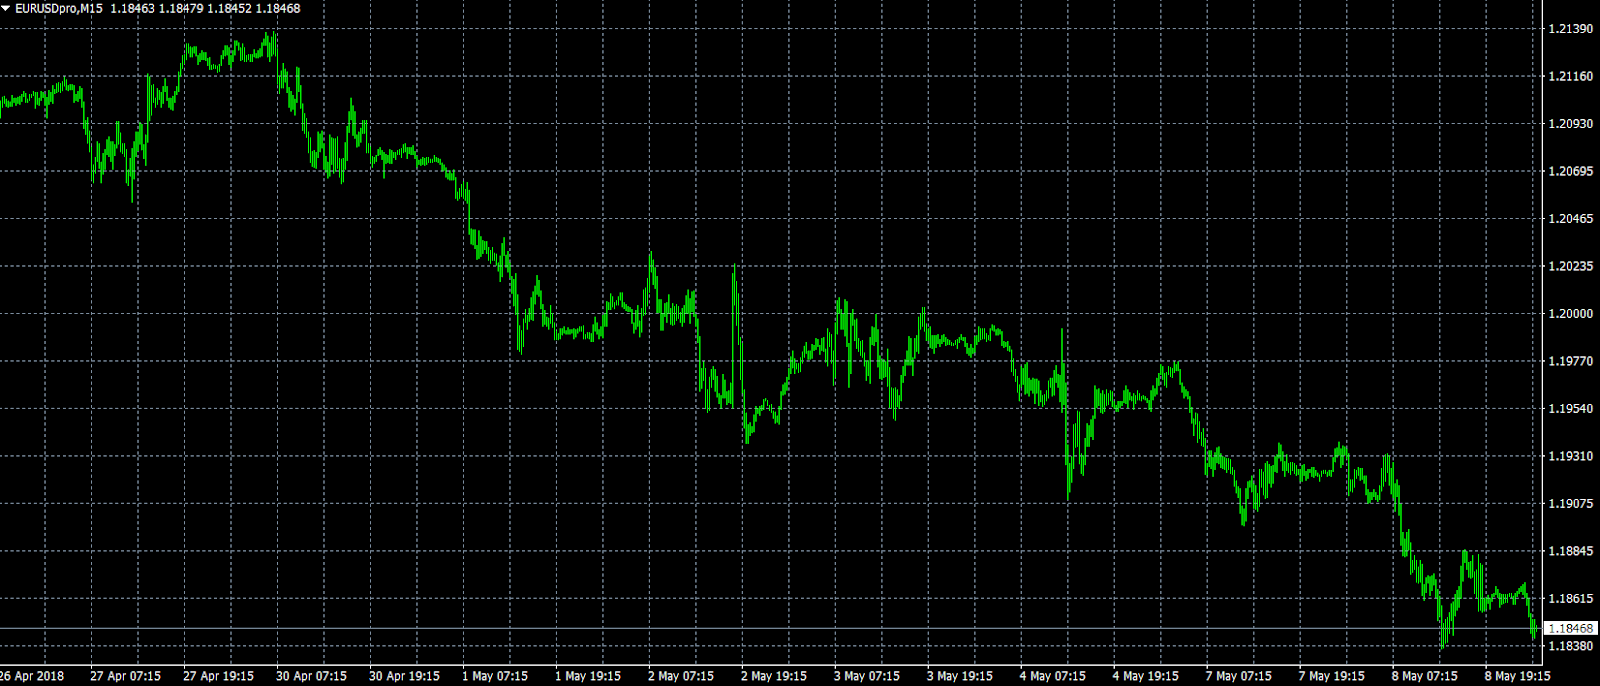
Europe's common currency plunged deeper into correction territory on Tuesday, as prices fell toward the mid-1.1800 range. At the time of writing, EUR/USD was trading at 1.1848, where it was down 0.1% from the previous close. The pair is now holding on to critical support at 1.1820, the low from December.
GBP/USD
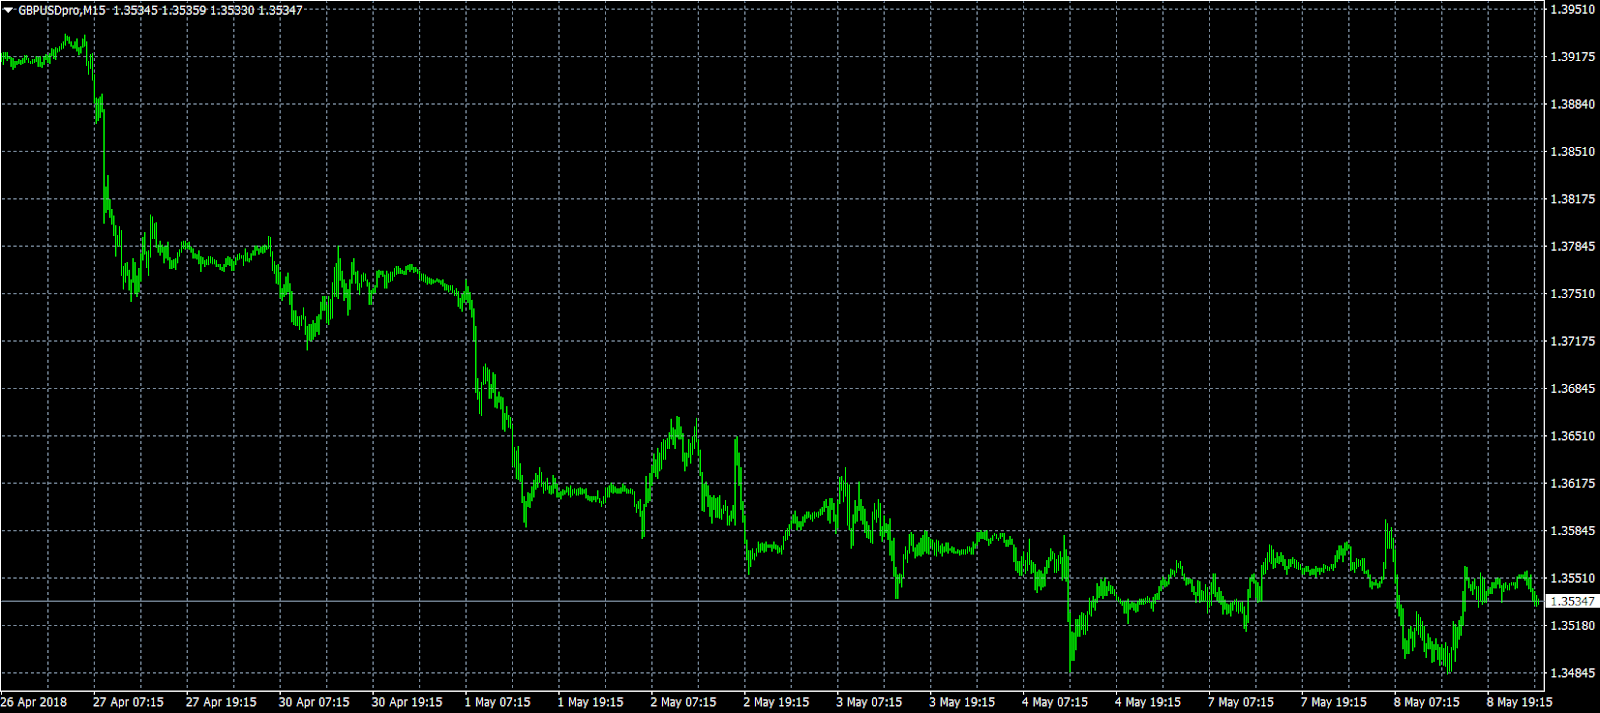
Cable briefly fell below 1.3500 on Tuesday before quickly rebounding later in the session to settle around 1.3550. Prices were down 0.1% during Asian trading, with key support still holding at the psychological 1.3500 mark.
NZD/USD
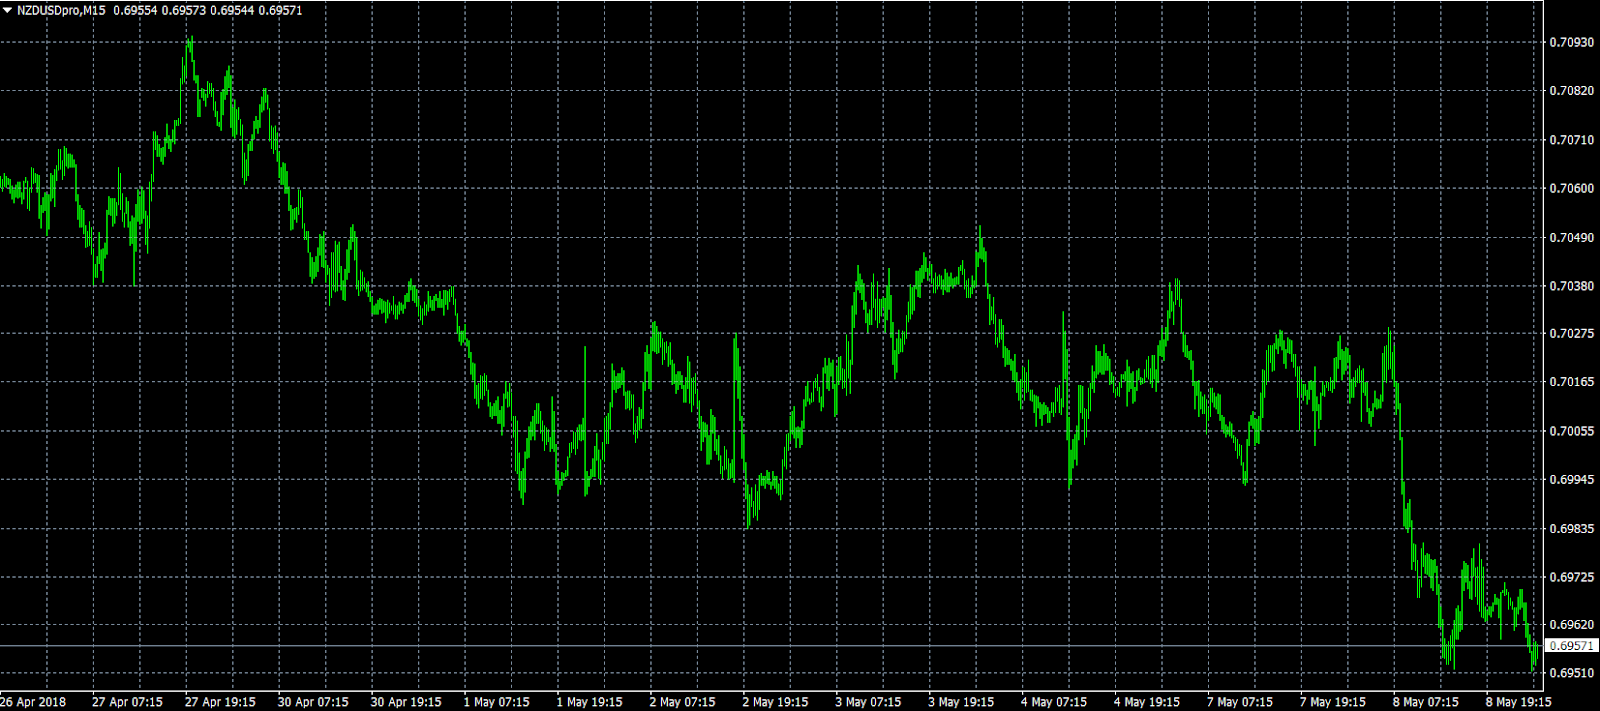
The rapid deceleration in the New Zealand dollar continued on Tuesday, with prices falling below 0.7000. At present, NZD/USD was trading at 0.6957 for a decline of 0.2%. After breaking multiple supports, the pair's new backstop appears to be 0.6880. On the upside, resistance will likely be met around 0.7000.
USD/JPY heading back to 110 as WTI oil hits 71, 10 year yield hit 3%
Oil price continues to surge on US withdrawal of Iran deal, WTI hit as high as 71.17 so far before retreat slightly to 70.9. US 10 year yield also follows and is back above 3% now.
In the currency markets, today's trend continue with USD and CAD trading as the strongest ones. Meanwhile, JPY is trading as the weakest one. The is in line with the development of surging oil and yield.
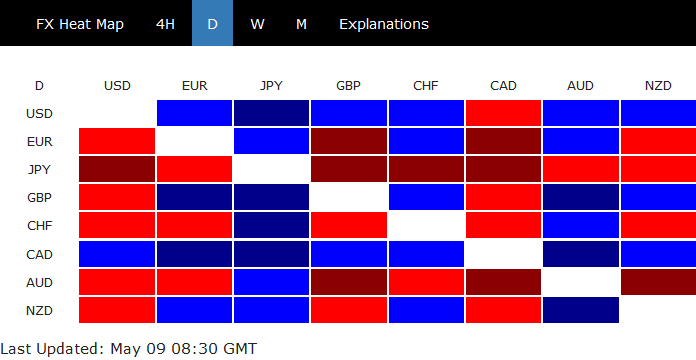
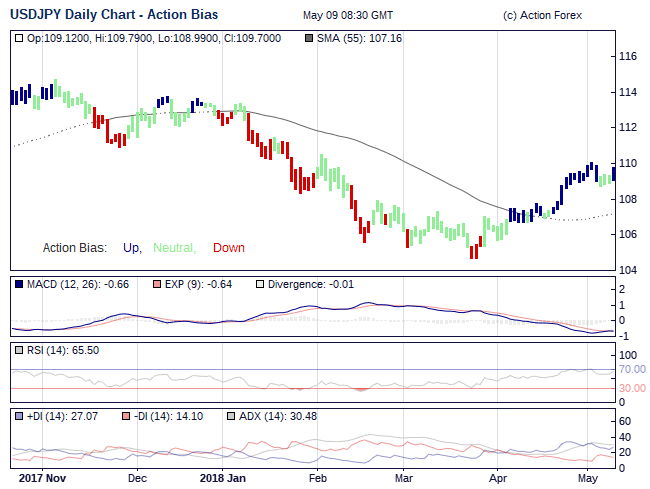
Dollar is trading above last week's high except versus JPY and GBP. Note that Yen's strength last week was due to falling yields in US and, more so in Europe. Rebound in US yield could now put 110.02 resistance in USD/JPY back into focus.
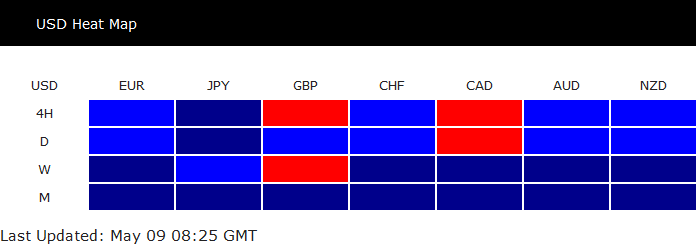 Action Bias of USD/JPY is looking promising. H row is all upside blue with the current rebound. D action also turned from neutral to upside blue already.
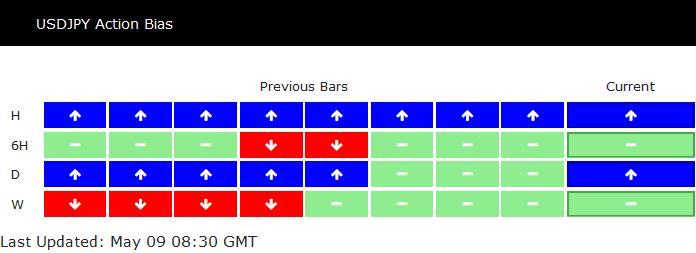 Nonetheless, we'd stay cautious in the pair first, at least until either 110.02 is taken out, or when 6H action bias also turns upside blue.
Dollar And Oil Continue Marching Higher As Geopolitics Dominate Attention
Here are the latest developments in global markets:
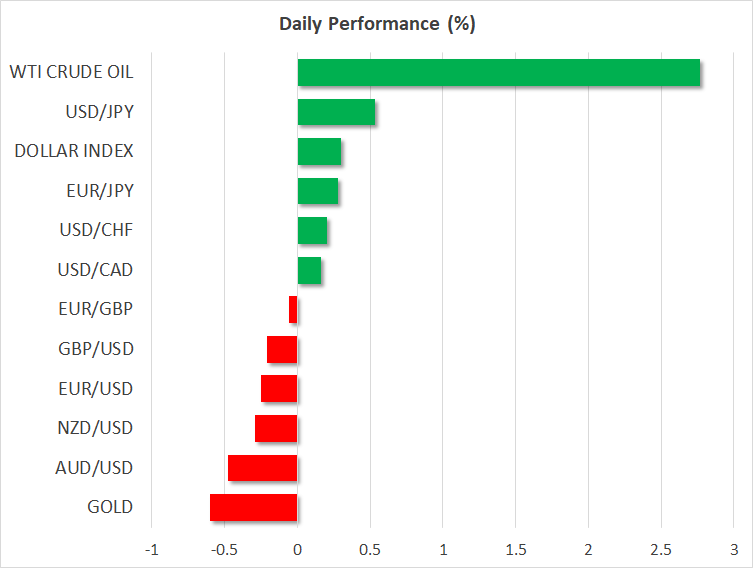
FOREX: The US dollar index was nearly 0.3% higher on Wednesday, touching its highest level in four-and-a-half months, and extending the significant gains it posted on Tuesday on the back of a rebound in longer-term US Treasury yields and particularly strong JOLTS data.
STOCKS: Major US indices closed practically flat on Tuesday, in the aftermath of the US decision to leave the Iran nuclear deal. The Nasdaq Composite and the Dow Jones managed to climb 0.02% and 0.01% respectively, while the S&P 500 fell by 0.03%, as gains in energy shares and defense contractor stocks were offset by losses in the utility sector. As for today, futures tracking the S&P, Dow, and Nasdaq 100 are currently very close to neutral territory as well. In Asia, Japan's Nikkei 225 and the Topix fell by 0.44% and 0.39% correspondingly, while in Hong Kong, the Hang Seng rose 0.18%. In Europe, futures tracking the major benchmarks are mostly in the green, pointing to a higher open today, with the only exception being France's CAC 40.
COMMODITIES: Oil prices soared on Wednesday, amid speculation that the US reinstating sanctions on Iran would curb the nation's crude exports. WTI and Brent crude surged by 2.7% and 2.8% respectively, both reaching fresh highs last seen in 2014, following a very turbulent ride on Tuesday (see below). In precious metals, gold prices plunged despite a marked increase in geopolitical uncertainties, namely in the Middle East. The yellow metal is down 0.6% and is currently trading near the $1,306/ounce mark, as the sharp rebound in the US currency is weighing on demand for the dollar-denominated metal. Should the greenback continue to move higher, then gold could well test its 2018 lows soon, near $1,301.
Major movers: Dollar advances; oil edges higher after US withdraws from Iran deal
Dollar strength and heightened volatility in oil prices were the two main themes in financial markets on Tuesday. The US dollar index touched fresh highs last seen in late December, as market participants awaited the decision of the US President on whether his nation would pull out of the Iran nuclear deal. Euro/dollar and sterling/dollar continued their freefall, with the former breaking below 1.1850 and the latter briefly falling through 1.3500.
As for oil, price movements can be best described as a rollercoaster ride. WTI prices dipped by roughly $2.5 ahead of Trump's announcement, after headlines suggested the President would delay the withdrawal. But prices rebounded sharply once he started talking and announced that the US will leave the nuclear deal with Iran, and re-impose fresh sanctions on the oil-exporting nation.
Trump said the US is committed to preventing Iran from acquiring nuclear weapons and that it will work with its allies to ensure that outcome. Importantly though, he also kept the door open for negotiating a new deal, displaying a similar method of approach to his handling of the steel and aluminum tariffs, where he imposed the levies but quickly postponed them and called for negotiations.
Oil rebounded in the aftermath of Trump's remarks on expectations for reduced Iranian supply, and got another kick higher from a surprising drawdown in the weekly API crude inventory data. In the big picture, it is still unclear what impact the US decision will have on oil markets. While the US is due to impose new sanctions as it attempts to broker a new deal with Iran, the other nations in the accord (UK, France, Germany, Russia, China) have not displayed the same intentions. If these nations, as well as Iran itself, choose to remain in the deal, then a unilateral withdrawal from the US is likely to be much less impactful, particularly so because the US does not import oil from Iran.
Day ahead: US PPI due; geopolitics at the forefront
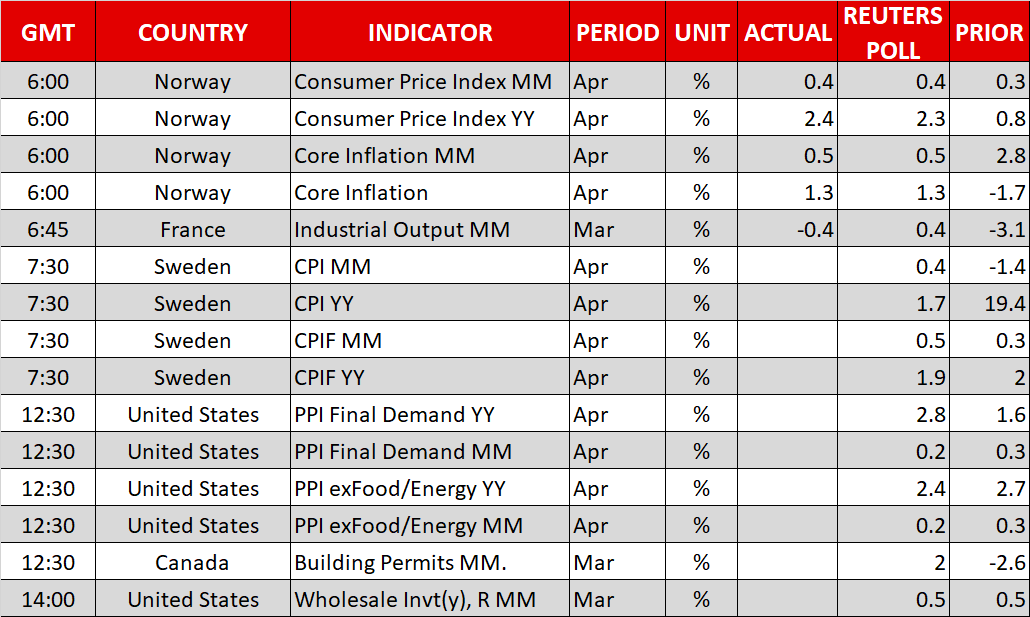
US factory price inflation as gauged by the producer price index is one of the releases attracting interest out of today's calendar. However, geopolitical developments after the Trump administration's decision to pull out of the nuclear deal with Iran are expected to dominate attention during today's trading. Meanwhile, uncertainty surrounding Italy's political scene is also expected to be one of the topics that will be on investors' radar.
At 0730 GMT, Swedish inflation figures for the month of April will be made public, bringing into focus krona pairs. Meanwhile, a Riksbank executive board meeting will commence a little earlier (0700 GMT).
Producer price data out of the US will be released at 1230 GMT. Overall, PPI numbers are anticipated to show that factory prices eased in April. The figures come ahead of tomorrow's respective data on consumer prices, which are perhaps more likely to lead to fairly considerable movements in dollar pairs. Wholesale inventory data for March are also on the agenda out of the US (1400 GMT).
Also at 1230 GMT, Canada will be on the receiving end of building permits data for March.
Oil traders will be paying attention to EIA weekly data on US crude stockpiles. Crude oil inventories are anticipated to decline by 0.7 million barrels during the week ending May 4, after a notable buildup in the previously tracked week. However, investors digesting the impact on oil supply after Trump's decision to exit the Iran nuclear deal, how things play out in the Middle East, and the reaction of other players – for example, European counterparts – who were part of the deal, will definitely be the main driver of movements in oil prices during today's trading and in the days to come. For the record, Iran is OPEC's third largest producer.
Quarterly earnings continue rolling in in equity markets, though overall sentiment could again be driven by the geopolitical developments just mentioned.
Atlanta Fed President Raphael Bostic, a voting FOMC member in 2018, will be talking on the US economic outlook and monetary policy at 1715 GMT.
Lastly, Italian politics are also on center stage, weighing on the common currency. The country may head to fresh elections soon after President Sergio Mattarella's attempt to form a government led by technocrats was unsuccessful. In the meantime, populist-perceived forces are seen as strengthening. Also in politics, any updates on the trilateral summit between Japanese PM Shinzo Abe, Chinese Premier Li Keqiang and South Korean President Moon Jae-in will be closely watched.
Technical Analysis: WTI oil futures short-term bullish; challenge 3½-year high
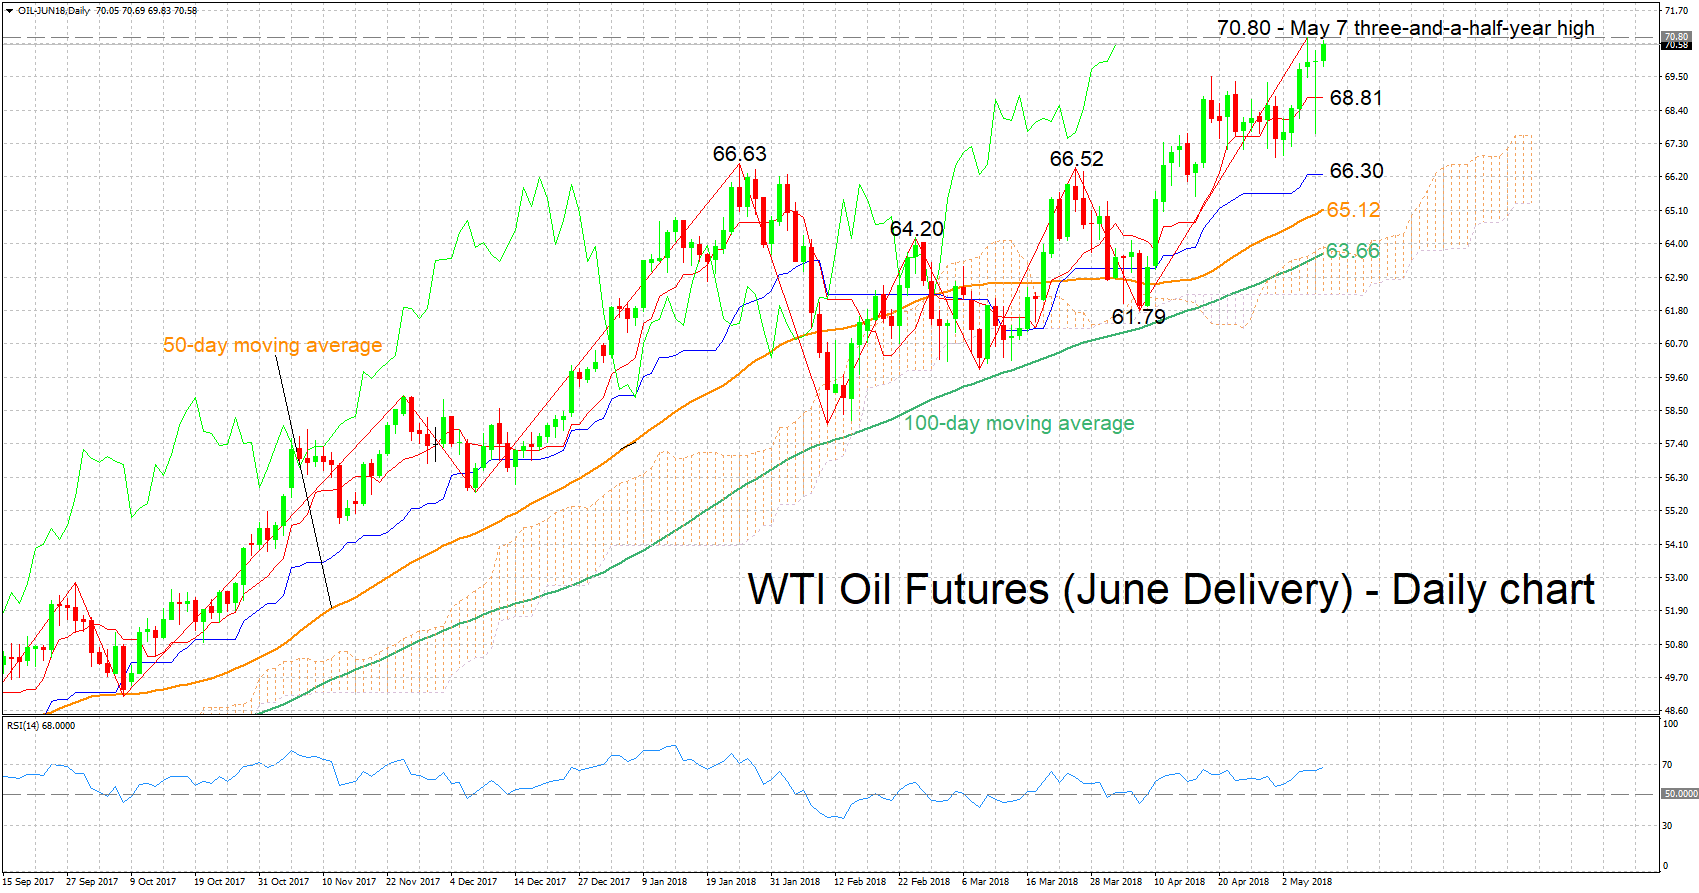
WTI oil futures for June delivery are on their sixth straight day of advances, with price action currently challenging the three-and-a-half-year high of 70.80 hit on Monday. The positively aligned Tenkan- and Kijun-sen lines are projecting a bullish picture in the short-term. The RSI which is on the rise supports this view, though notice as well that the indicator is close to entering overbought territory at 70.
Should geopolitical developments clearly point towards the direction of oil supply being taken out of the market, then prices are expected to head higher. Immediate resistance to gains could be coming around Monday's three-and-a-half-year high of 70.80, including the 71 round figure. The 72 handle may act as an additional barrier further above.
Conversely, if oil supply is not seen as negatively affected, or at least not to a significant extent, then prices are likely to fall. Support to declines might come around the 70 level that may be of psychological importance and the current level of the Tenkan-sen at 68.81 (including the 69 handle) in case of a downside violation. Further below, the area around the Kijun-sen at 66.30 will increasingly start to come into focus.
The EIA's weekly report on crude stocks due later on Wednesday can also spur some movements in oil prices.
AUDUSD Holds At 11-Month Low, Bearish In Short And Long-Term
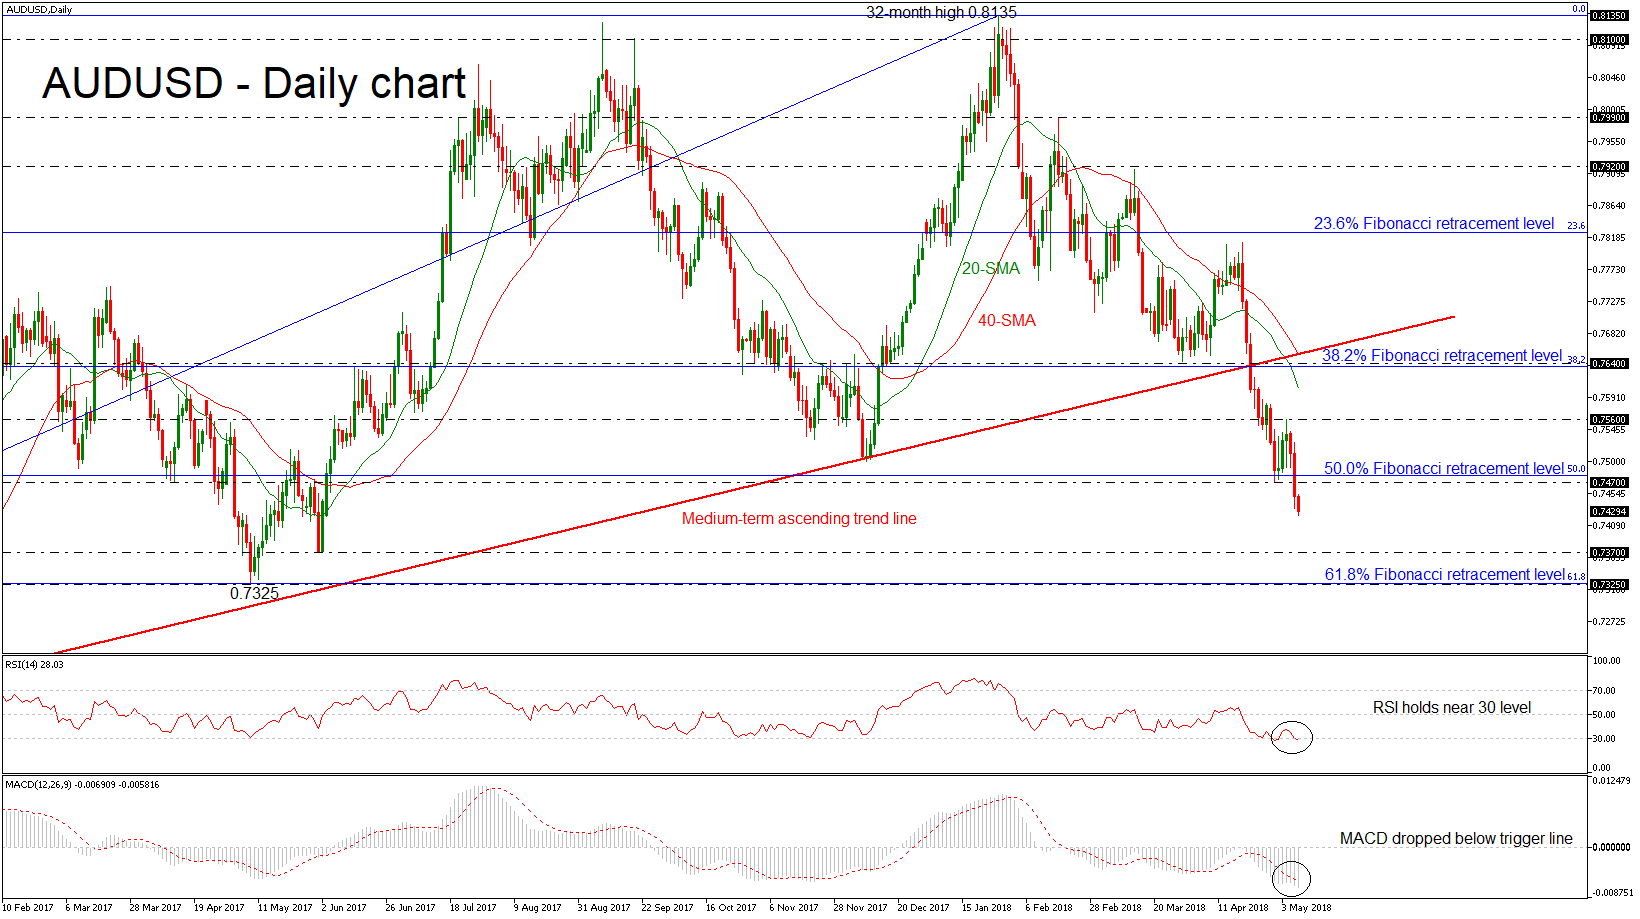
AUDUSD has come under renewed selling pressure on Wednesday, recording a fresh 11-month low of 0.7423 and remaining below the medium-term ascending trend line. This diagonal line had been holding since January 2016 and this is the third bearish week where the price has extended its losses. Despite that there was a strong support of 50.0% Fibonacci retracement level of 0.7480 of the upleg from 0.6820 to 0.8135, the price has posted an aggressive bearish rally below it once again.
More broadly, the pair has shifted the long-term bullish outlook to bearish and looking at momentum indicators in the daily timeframe, they suggest further declines may be on the cards. The Relative Strength Index (RSI) is holding slightly below its 30 level and is pointing downwards, while the MACD oscillator lies below its trigger line and is strengthening its negative momentum.
In case of further declines in the pair, immediate support may be found near the low of 0.7370 created last June. A downside break of that zone would open the way for the May 2017 bottom of 0.7325, an area that also encapsulates the 61.8% Fibonacci. If sellers manage to push below that hurdle too, that would mark a lower low in the daily timeframe, increasing the probability for further bearish extensions. Support may be found initially near 0.7160, identified by the December 2016 low.
On the flip side, if the bulls retake control and successfully surpass 0.7470, price advances may stall initially near the latest highs at 0.7560. A potential violation of the aforementioned obstacle would re-challenge the 0.7640 resistance barrier, which stands around the 38.2% Fibonacci mark. A climb above this significant area would touch the 23.6% Fibonacci of 0.7825, raising the likelihood for more advances.
GBP/USD Challenges Resistance After Bears Fail To Break 1.35
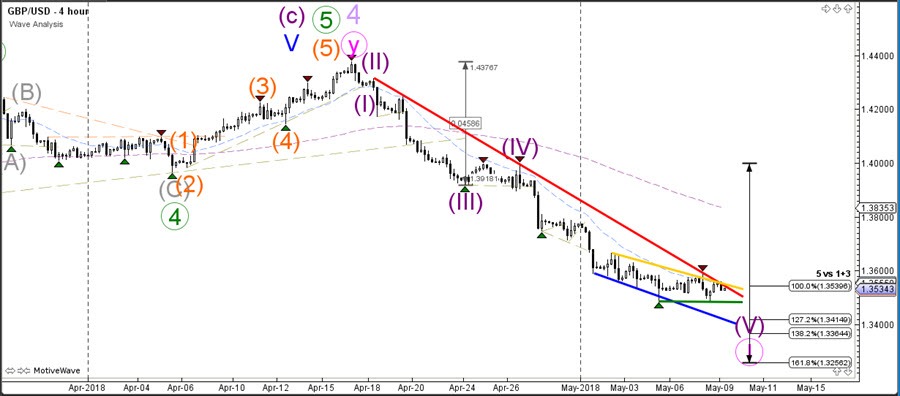
The GBP/USD is unable to break above the resistance at 1.36 or below the support zone at 1.35. The downtrend is still valid and a bearish breakout could price fall towards the Fibonacci targets of wave 5 (purple). A bullish break above that resistance would indicate the completion of wave 1 (pink) and the start of wave 2.
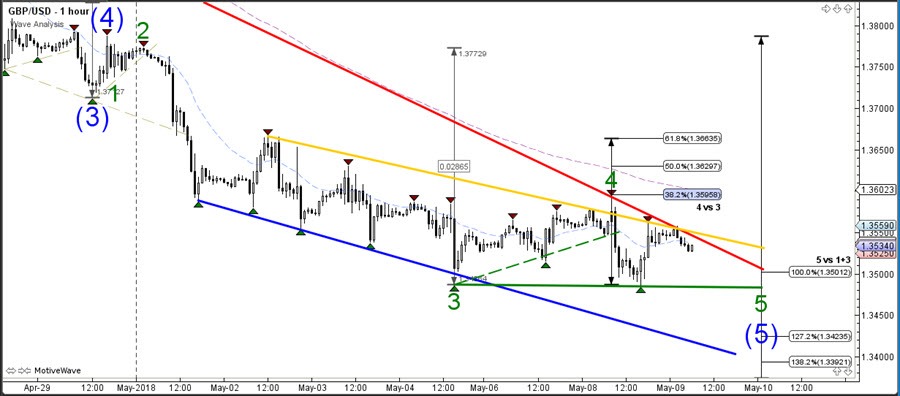
The GBP/USD made a bearish bounce at the38.2% Fibonacci level of wave 4 (green) and broke below the support trend line (dotted green). This breakout could have completed the wave 5 (green) but a continuation of the downtrend towards the Fibonacci targets of wave 5 (green) is also possible if price breaks below the previous bottom (green).A break above the 61.8% Fibonacci retracement level could indicate the potential end of the downtrend.
USD/JPY Bullish Breakout Faces Heavy 110 Resistance Zone
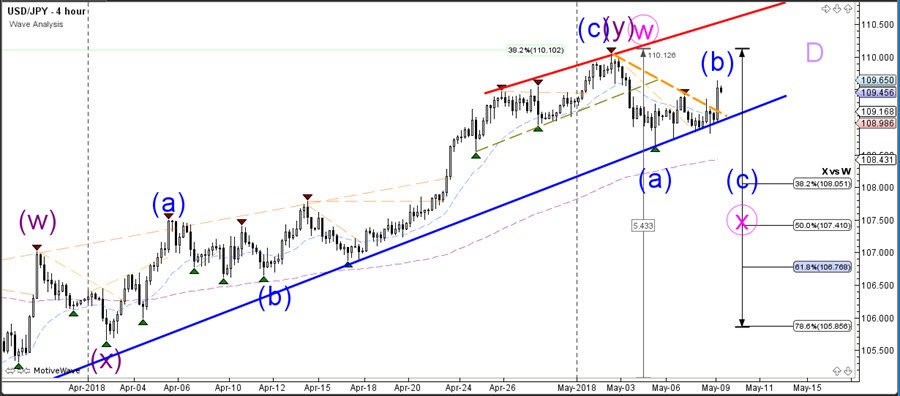
The USD/JPY made a bullish breakout above resistance (dotted orange), which could either start a continuation of the uptrend or be part of a larger ABC correction. Price would need to break above the previous top at 110 to confirm the uptrend whereas a break below the support trend lines (blue) near 109 indicates that a larger bearish correction becomes more likely. A bullish breakout above the 110 resistance level could indicate an extension of the wave W (pink) towards the 50% Fib at 111.50 whereas a bearish break aim at 108-107.50.
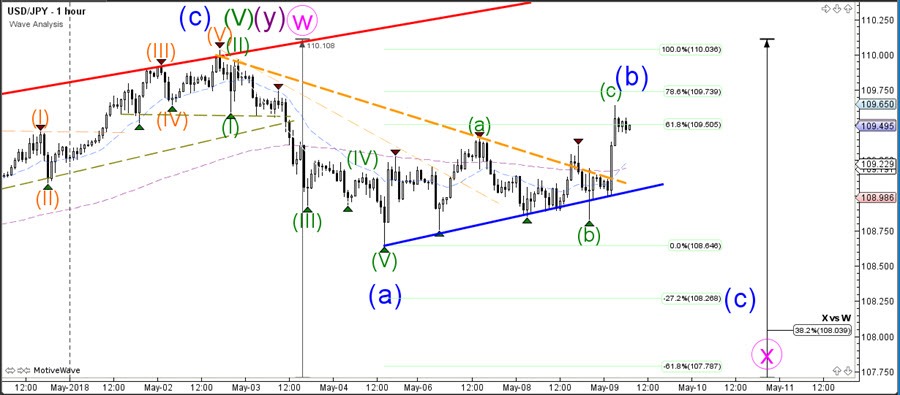
The USD/JPY is showing a bullish breakout but the Fibonacci levels could act as a potential resistance. Price could be building a larger ABC (blue) zigzag correction but a break above the 100% Fibonacci level and resistance zone at 110 invalidates this wave pattern. A break below the support trend line (blue) is needed before such an ABC becomes more likely.
XAUUSD Intraday Analysis
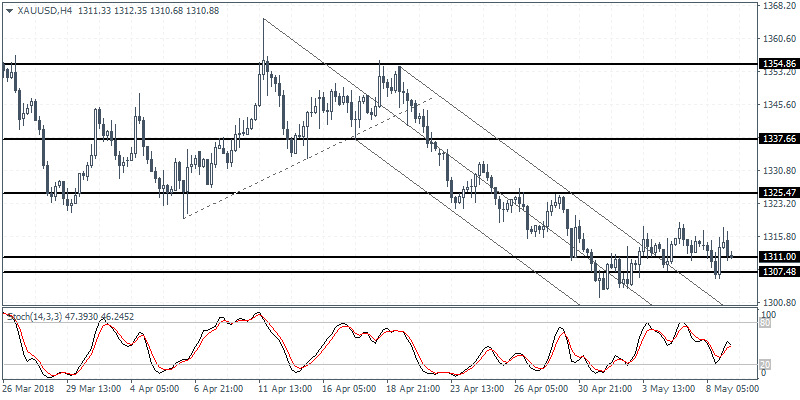
XAUUSD (1310.88): Gold prices continued to trade within the support level of 1311 and 1307. Price action remains range bound at this level but the consolidation could signal a possible correction. The resistance level at 1325 which remains untested could be the upside target on a rebound. To the downside, price action will need to break out below the support level strongly in order to test the next main support at 1300. However, in the near term, gold prices are likely to remain support with the potential for an upside correction.
GBPUSD Intraday Analysis
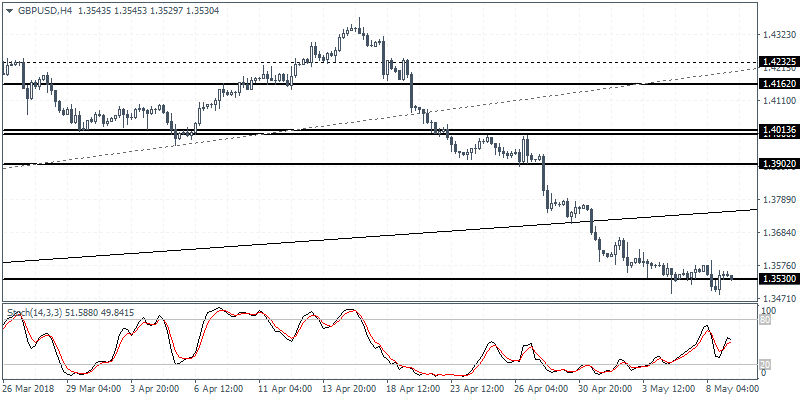
GBPUSD (1.3530): The British pound remained trading near the 1.3530 level with price action seen briefly slipping below this level only to recover back modestly. The consolidation at this level is expected to continue and it also indicates a potential rebound in price action in the near term. The British pound could be seen most likely to post a correction with the breached trend line likely to turn as resistance. To the downside, the round number support at 1.3500 remains the next target.