Sample Category Title
Trump Dumps Iran And EM FX Reacts
Trump dumps Iran and EM FX reacts
So unless you have been hiding under a rock you have seen that US president Donald Trump pulled the USA out of international nuclear deal with Iran. This extreme move was not completely unexpected given Trump years of criticism and general hatred of Obama. The move has increased risk in the middle east, jeopardized US relations with allies and reintroduced oil supply concerns. All in a days work for this US president that thrives on disruption and drama. Reaction in the markets was broadly muted as the move was already priced in. Oil prices climbed marginal with brent hitting a 3 plus year high at $77.10 while US 10 year yields just below 3.0%. The event was felt a bit more in FX were politically risk currency were sold-off. TRY reached a record low against the USD as Trump move threated stability of boarder, access to oil and highlighted Turkey own political and monetary uncertainty. Argentina ARS currency crisis continued. Banco Central de la Republica Argentina has raised interest rates 1,275bp in two weeks (40%) and requested support from the IMF. Worryingly for Argentina which is heavily funding in USD spent over $5bn to temporarily support the peso. We might now yet be in period as volatile as the “taper tantrum” however, rising USD Interest rates and extreme geopolitical uncertainty are the key ingredients to deeper EM sell-off. Extend period of lose monetary policy did not just create bubble in development market equites but embolden EM carry traders to overlook crucial fundamentals risks. This unwind is not likely to let up anytime soon.
Sweden keeps rates unmoved
The Riksbank is not having an easy time: its monetary policy meeting on 26 April concluded with a maintenance of its key rate at -0.50%. The minutes from April, just released, confirmed the bank’s willingness to raise interest rates this year (expected year-end), probably earlier than the European Central Bank. USD/SEK gained 1.68 while EUR/SEK lost ground, lowering by -0.56% (year-to-date: +7.75% and +6.18%), suggesting strong USD momentum since the beginning of February. We would favour short USD/SEK and EUR/SEK positions. Both pairs are currently trading at 8.79 and 10.42, heading to 8.7695 and 10.4060 in the short-term.
Inflation data released this morning hint towards a postponement of a normalization next year. Given at 0.40% and 1.70% on month-to month and year-to-year basis (prior: 0.30% and 1.90%), consumer prices are disappointing. Should these remain so in coming months, a delay is most likely. Still, with a take off in domestic consumption and a recovery in March’s trade balance, a rate hike in 2018 is still likely. The odds remain low, but an increase in September earliest (expected in October or December) is feasible.
Bitcoin Expected To Decline Below 9000
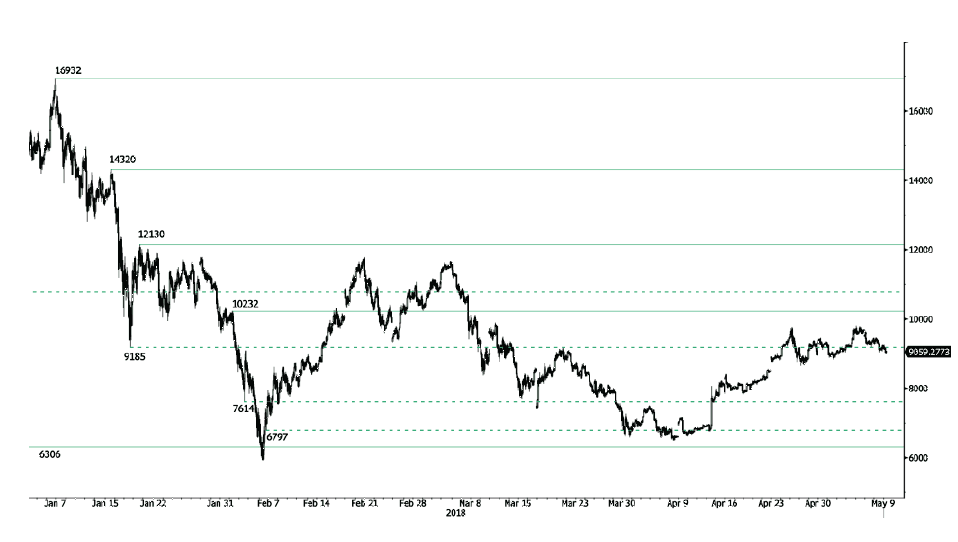
Bitcoin rise started in mid-April pauses, the pair is currently decreasing after reaching 9795 (04/05/2018 high), heading along the 8970 range. Bitcoin bearish pattern started in March 2018 weakens. The pair is contained between hourly support and resistance given at 6306 (13/11/2017 low) and 10232 (01/02/2018 high). The technical structure suggests further short-term decrease.
In the long-term, the digital currency has had an exponential growth but also presented important downturns. There is decent likelihood that the currency could stabilize between 7'000 - 12'000 in 2018. Bitcoin is trading slightly above its 200 DMA (8300 range).
CRUDE OIL Bullish Momentum
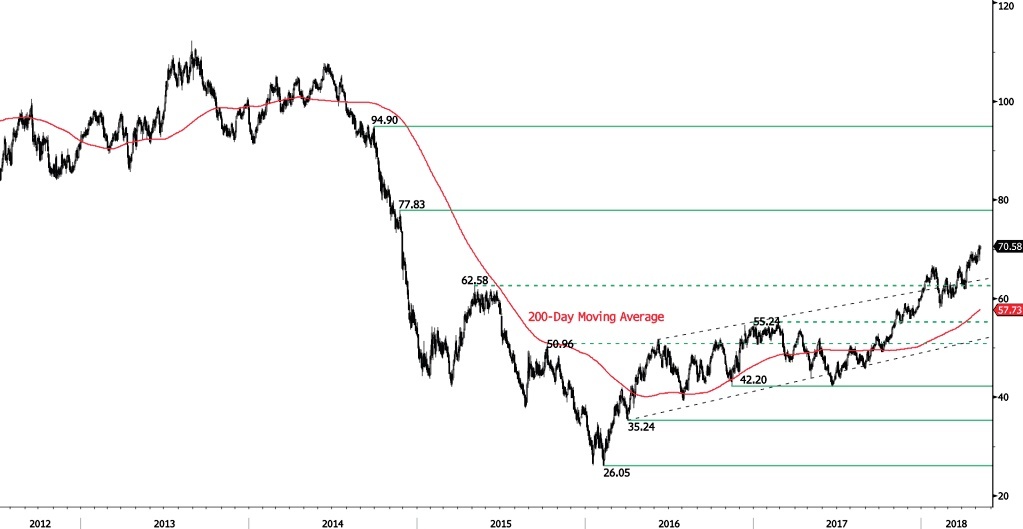
Crude oil bullish momentum continues, bouncing off from 67.63 and heading along the 71 range. Crude Oil is currently trading at December 2014 levels. The bullish pattern started in mid-February 2018 is maintained. Hourly support and resistance are given at 65.56 (17/04/2018 low) and 73.56 (28/11/2014 high). The technical structure suggests short-term upward moves.
In the long-term, crude oil has recovered after its sharp decline last year. However, we consider that further weakness is very likely. For the time being, the pair lies in an upside trend since June 2017. Support lies at 42.20 (16/11/2016) while resistance is located at 77.83 (20/11/2014). Crude oil is trading largely above its 200 DMA.
SILVER Weakening
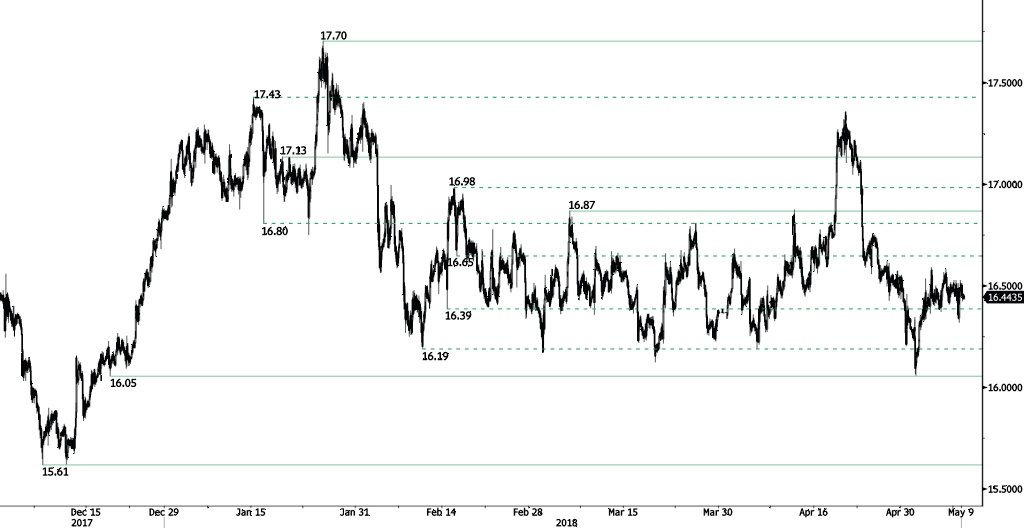
Silver is decreasing, currently trading below 16.50 and heading along the 16.30 range. Hourly support and resistance are given at 16.05 (19/12/2017 low) and 16.87 (06/03/2018 high). The technical structure suggests short-term decrease.
In the long-term, the trend remains negative/ sideways. Further downside is very likely. The pair is trading below its 200 DMA. Resistance is located at 21.58 (10/07/2014 high). Strong support can be found at 11.75 (20/04/2009).
GOLD Trading Sideways
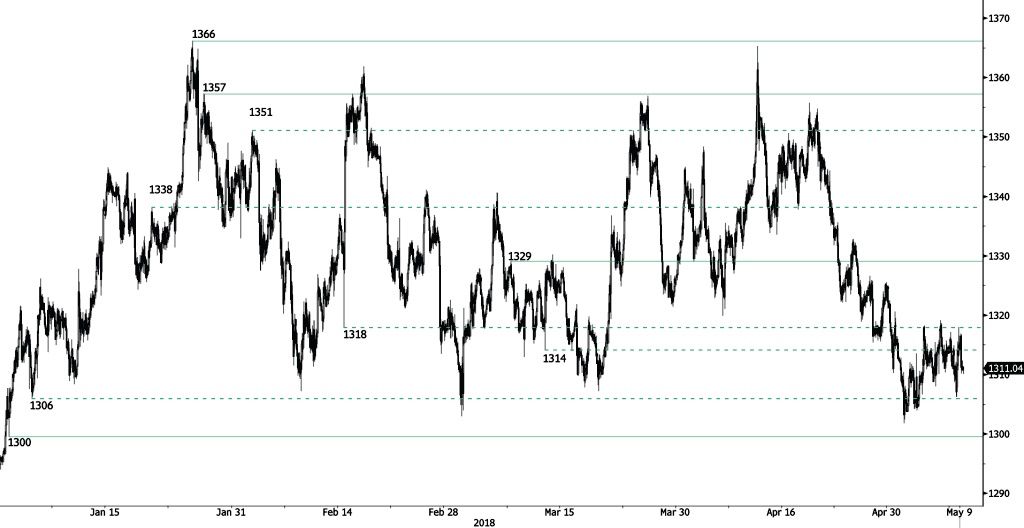
Gold is decreasing after reaching 1317, heading along the 1306 range. Hourly support and resistance are given at 1300 (29/12/2017 low) and 1329 (08/03/2018 high). The technical structure suggests short-term downward moves.
In the long-term, the technical structure suggests that there is a growing upside momentum. A break of 1'392 (17/03/2014) is required to confirm it. A major support can be found at 1'045 (05/02/2010 low).
EUR/CHF Trading Lower
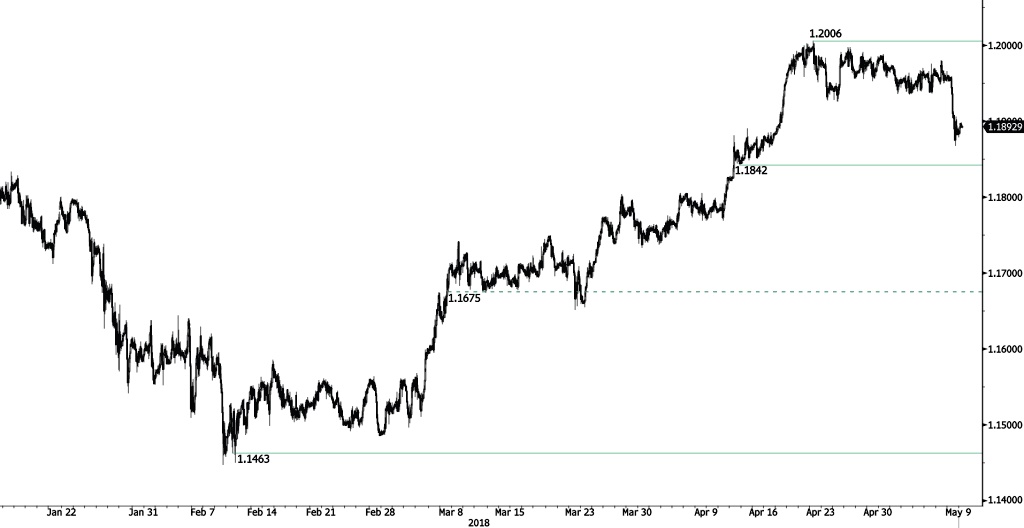
EUR/CHF is weakening, trading below 1.19 and heading along the 1.1865 range. Hourly support and resistance are given at 1.1842 (11/04/2018 low) and 1.2006 (20/04/2018 high). The shortterm technical structure suggests further shortterm downward moves.
In the longer term, the technical structure has reversed. Strong resistance at 1.20 (level before the unpeg) is now at reach. The ECB's slowing QE program is likely to cause buying pressures on the euro, which should weigh in favour of the EUR/CHF. Support and resistance can be found at 1.0624 (24/06/2016 low) and 1.2097 (18/12/2014 high).
EUR/GBP Pausing Before Another Leg Lower
EUR/GBP is starting a bearish consolidation and is expected to trade lower, heading along the 0.875 range. EUR/GBP bearish pattern started in March is strengthening. Hourly support and resistance are given at 0.8668 (22/03/2018 low) and 0.8898 (07/02/2018 high). The technical structure suggests short-term sideways price action.
In the long-term, the pair has largely recovered from 2015 lows. The technical structure suggests further upside pressure. Strong resistance can be found at 0.9500 (psychological level) while support remains at 0.8304 (05/12/2016 low). The pair is trading below its 200 DMA.

AUD/USD Trading At June 2017 Range
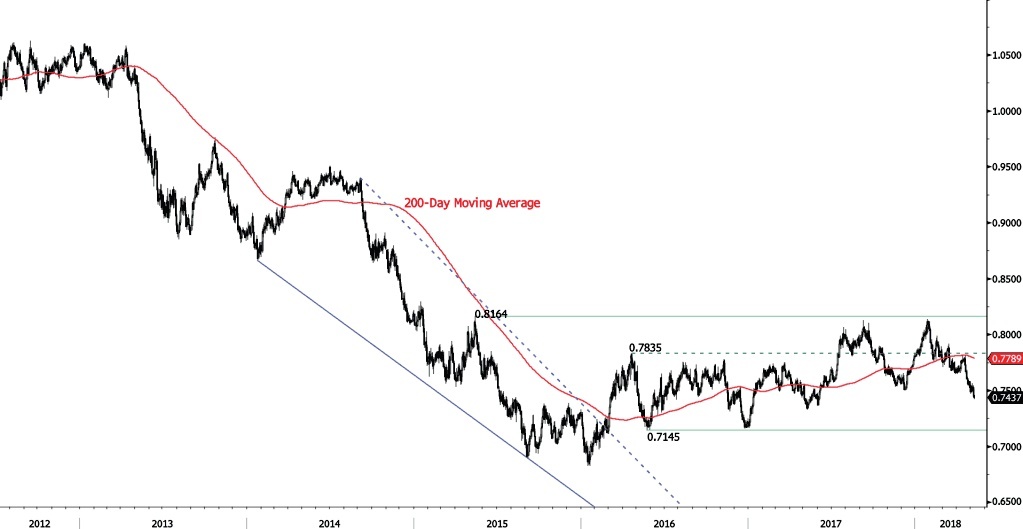
AUD/USD bearish pattern from 0.7813 (19/04/2018) continues, currently trading at 0.7430 and approaching the 0.7420 range. Hourly resistance remains at 0.7879 (28/02/2018 high). The technical structure suggests shortterm decrease.
In the long-term, the upward trend slows down after failing to reach key resistance at 0.8164 (14/05/2015 low). Key support stands at 0.6009 (31/10/2008 low). A break of the key resistance at 0.8164 (14/05/2015 high) is needed to invalidate our long-term bearish view.
USD/CAD Bullish Consolidation
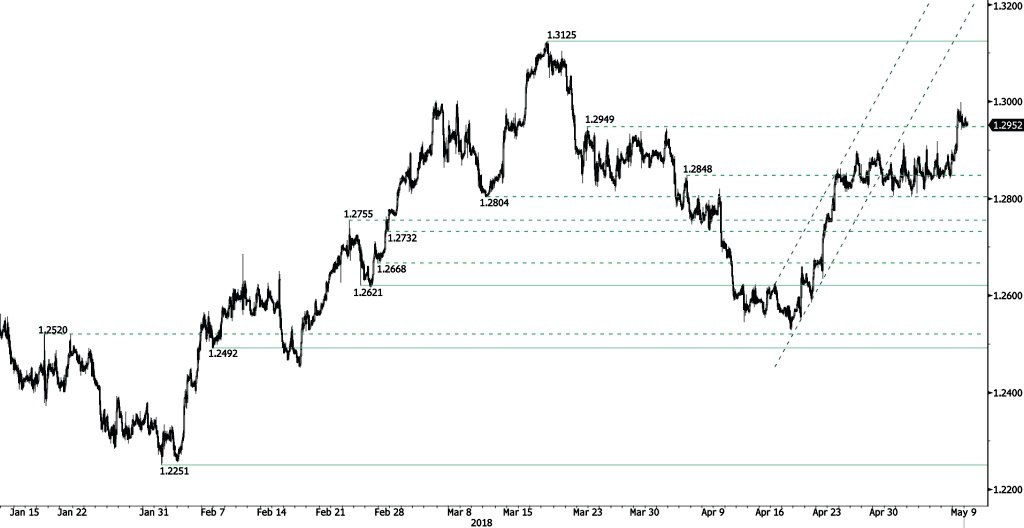
USD/CAD bullish trend pauses after breaking hourly resistance at 1.2949 (22/03/2018 high). The pair is contained, trading sideways and heading along the 1.2965 range. Hourly support and resistance are given at 1.2621 (23/02/2018 low) and 1.3125 (19/03/2018 high). The technical structure suggests short-term sideways trading moves.
In the longer term, the pair is trading between resistance point at 1.3805 (05/05/2017 high) and support at 1.2128 (18/06/2015 low). Strong resistance is given at 1.4690 (22/01/2016 high). The pair is likely to head lower. The pair is trading above its 200 DMA.
USD/CHF Pushing Higher
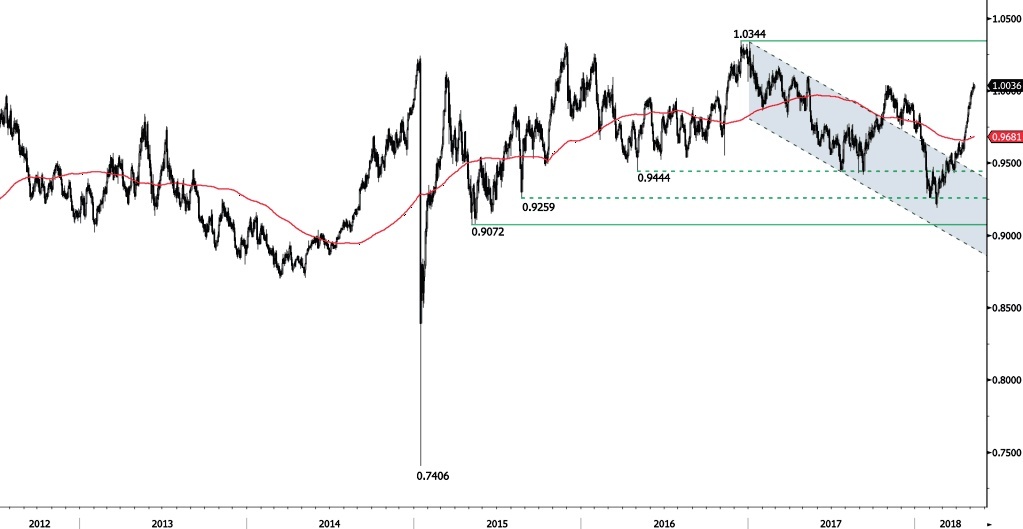
USD/CHF bullish pattern pauses after reaching 1.0056, heading along the 1.0045 range. The bullish pattern started from 0.9188 (16/02/2018 low) is maintained. Hourly support and resistance are given at 0.9755 (10/01/2018 low) and 1.0091 (09/05/2017 high). The technical structure suggests short-term increase.
In the long-term, the pair is still trading in range since 2011 despite some turmoil when the SNB unpegged the CHF. Key support lies at 0.9072 (07/05/2015 low) while resistance at 1.0344 (15/12/2016 high) is distanced. The technical structure favours a long term bullish bias since the unpeg in January 2015.