

Sample Category Title
EUR/CHF Approaching The 1.1950 Range
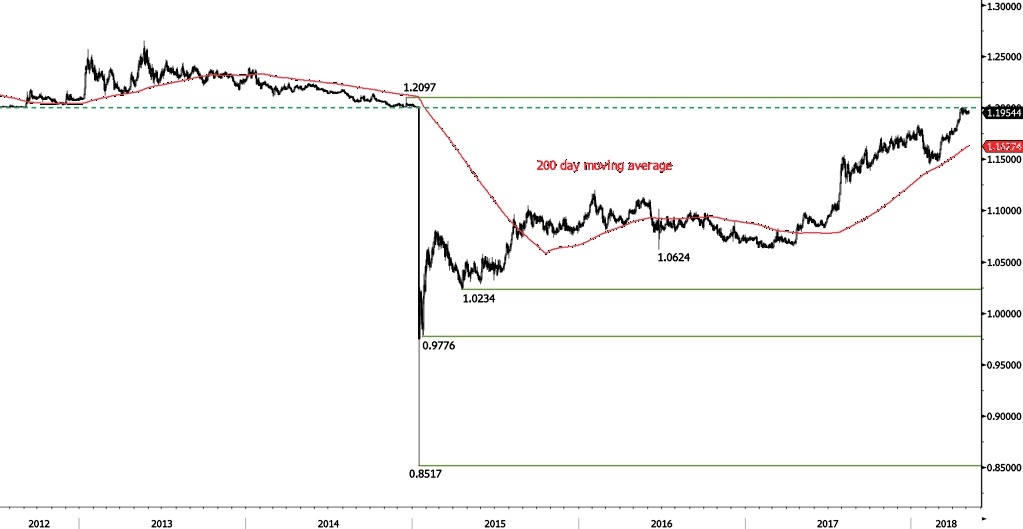
EUR/CHF is decreasing, trading below 1.1955 and heading along the 1.1950 range. Strong resistance at 1.20 remains. Hourly support given at 1.1842 (11/04/2018 low) is distanced. The short-term technical structure suggests shortterm decrease.
In the longer term, the technical structure has reversed. Strong resistance at 1.20 (level before the unpeg) is now at reach. The ECB's slowing QE program is likely to cause buying pressures on the euro, which should weigh in favour of the EUR/CHF. Support and resistance can be found at 1.0624 (24/06/2016 low) and 1.2097 (18/12/2014 high)
EUR/GBP Heading Lower
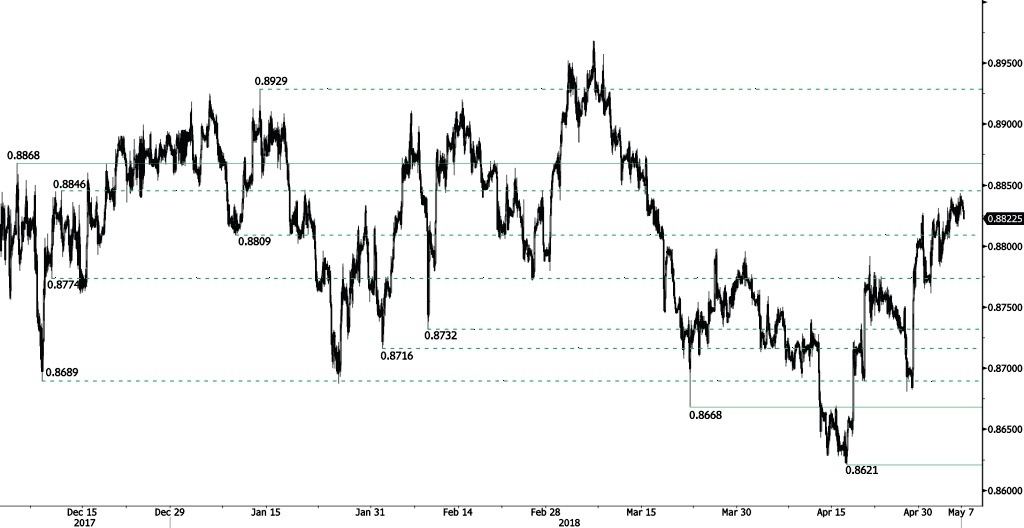
EUR/GBP is decreasing, trading along 0.8818 and approaching the 0.8816 range. EUR/GBP bearish pattern started in March is weakening. Hourly support and resistance are given at 0.8668 (22/03/2018 low) and 0.8868 (05/12/2017 high). The technical structure suggests shortterm downward moves.
In the long-term, the pair has largely recovered from 2015 lows. The technical structure suggests further upside pressure. Strong resistance can be found at 0.9500 (psychological level) while support remains at 0.8304 (05/12/2016 low). The pair is trading below its 200 DMA.
AUD/USD Weakening
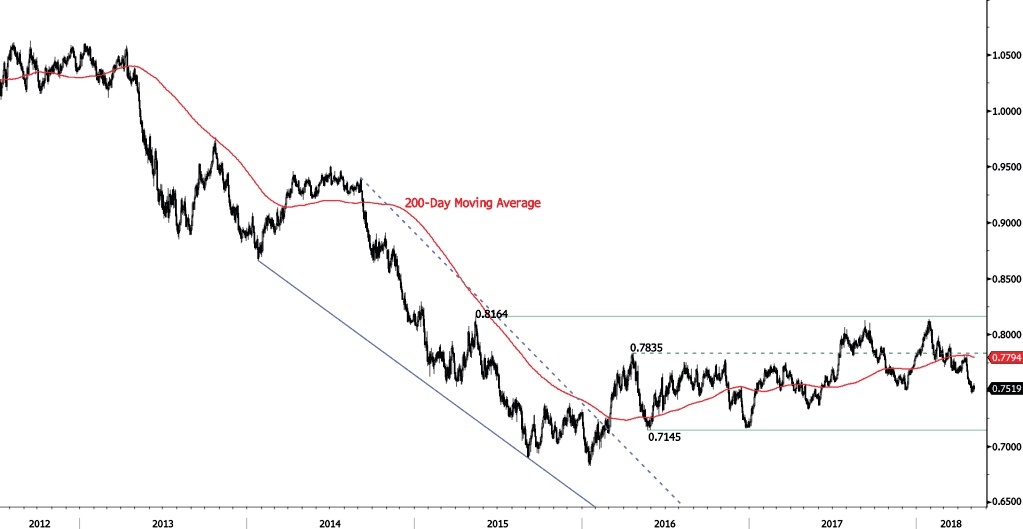
AUD/USD bearish pattern from 0.7813 (19/04/2018) continues after reaching 0.7558 (04/05/2018 high), trading along 0.7515 and approaching the 0.7510 range. Hourly resistance at 0.7879 (28/02/2018 high) remains. The technical structure suggests short-term decrease.
In the long-term, the upward trend slows down after failing to reach key resistance at 0.8164 (14/05/2015 low). Key support stands at 0.6009 (31/10/2008 low). A break of the key resistance at 0.8164 (14/05/2015 high) is needed to invalidate our long-term bearish view.
USD/CAD Bouncing Off
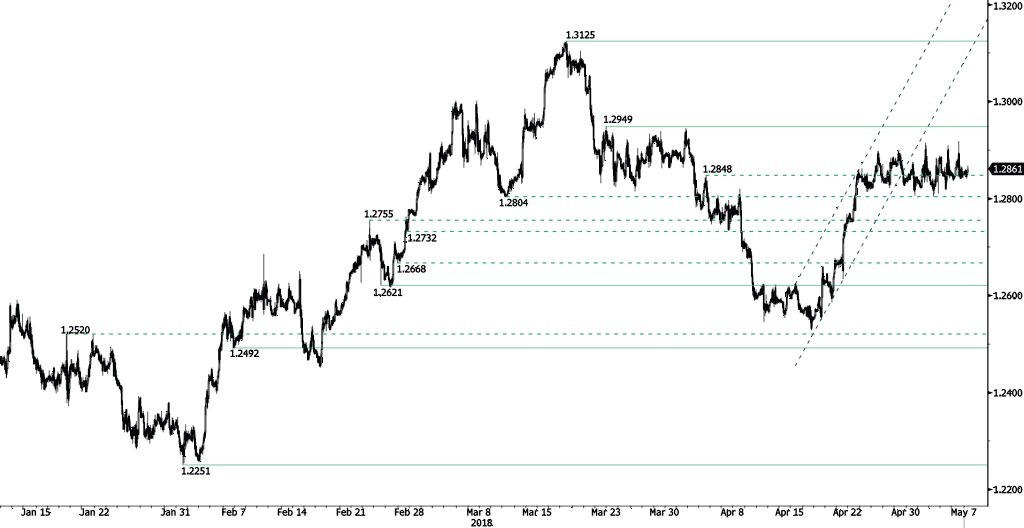
USD/CAD bullish trend stops, trading sideways since end-April. The pair is currently increasing, heading along the 1.2870 range. Hourly support and resistance are given at 1.2621 (23/02/2018 low) and 1.2949 (22/03/2018 high). The technical structure suggests short-term upward moves.
In the longer term, the pair is trading between resistance point at 1.3805 (05/05/2017 high) and support at 1.2128 (18/06/2015 low). Strong resistance is given at 1.4690 (22/01/2016 high). The pair is likely to head lower. The pair is trading above its 200 DMA.
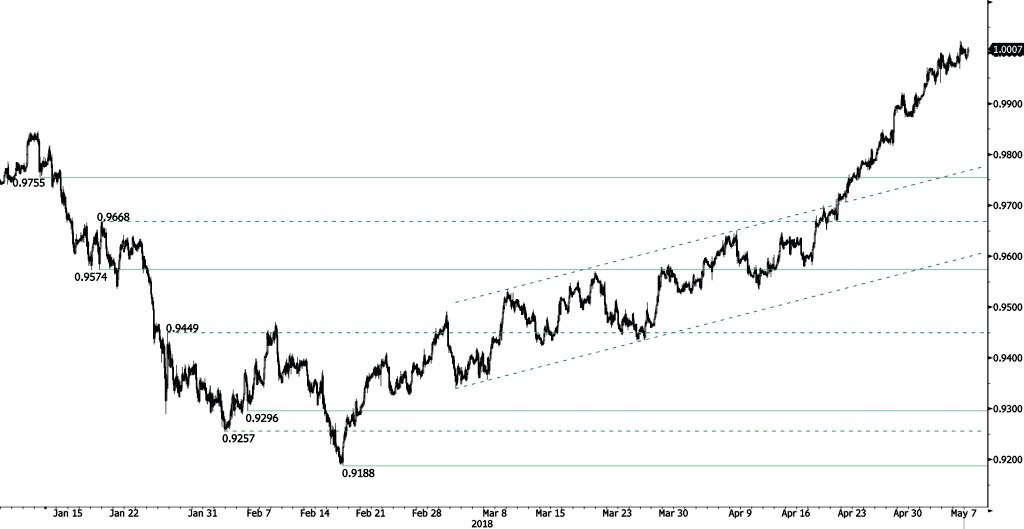
USD/CHF Trading Above 1
USD/CHF bullish pattern continues, trading above 1 and heading along the 1.0010 range. The bullish pattern started from 0.9188 (16/02/2018 low) continues. The pair is contained between hourly support and resistance given at 0.9755 (10/01/2018 low) and 1.0038 (01/11/2017 high). The technical structure suggests shortterm increase.
In the long-term, the pair is still trading in range since 2011 despite some turmoil when the SNB unpegged the CHF. Key support lies at 0.9072 (07/05/2015 low) while resistance at 1.0344 (15/12/2016 high) is distanced. The technical structure favours a long term bullish bias since the unpeg in January 2015.
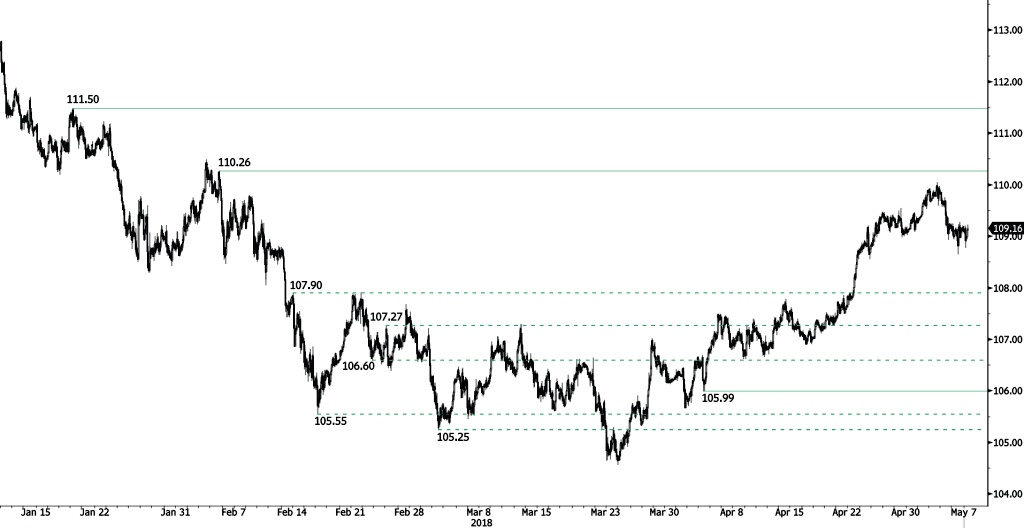
USD/JPY Trading Above 109
USD/JPY bullish pattern pauses, currently trading along 109.25 and approaching the 109.35 range. The bearish pattern started in January 2018 is weakening. Hourly support and resistance are given at 105.99 (04/04/2018 high) and 110.26 (05/02/2018 low). The short-term technical structure suggests short-term upward moves.
We favor a long-term bearish bias. Support remains at 101.20 (09/11/2016 low). A gradual rise toward the major resistance at 125.86 (05/06/2015 high) seems unlikely. Expected to decline further support at 101.20 (09/11/2016 low). The pair trades below its 200 DMA.
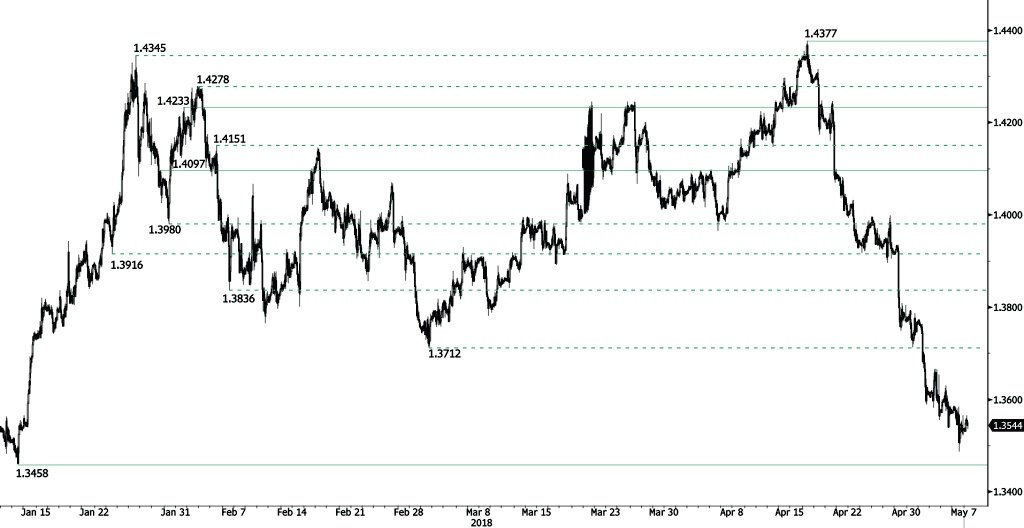
GBP/USD Trading Sideways
GBP/USD is slightly increasing, trading below 1.36 and heading along the 1.3565 range. The pair is currently trading at mid-January 2018. Hourly support and resistance are given at 1.3458 (11/01/2018 low) and 1.4097 (29/01/2018 high). The technical structure suggests shortterm sideways trading move.
The long-term technical pattern is reversing. The Brexit vote had paved the way for further decline but the pair is moving to 2016 highs. Long-term support and resistance are given at 1.1841 (07/10/2017 low) and 1.5018 (24/06/2016 high).
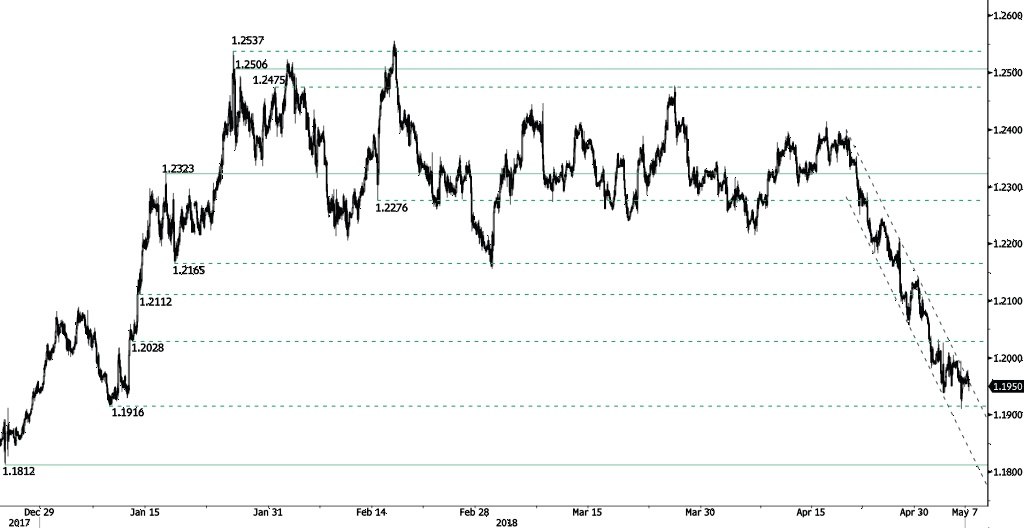
EUR/USD Decreasing
EUR/USD bearish pattern started from 1.24 (19/04/2018 high) continues, currently trading at 1.1940 and heading along the 1.1935 range. The pair is currently trading at mid-January 2018 low. Hourly support and resistance are given at 1.1812 (25/12/2017 low) and 1.2323 (17/01/2018 high). The technical structure suggests further short-term downward moves.
In the longer term, the momentum is turning largely positive. We favor a continued bullish bias. Key resistance is holding at 1.2886 (15/10/2014 high) while strong support lies at 1.1554 (08/11/2017 low).
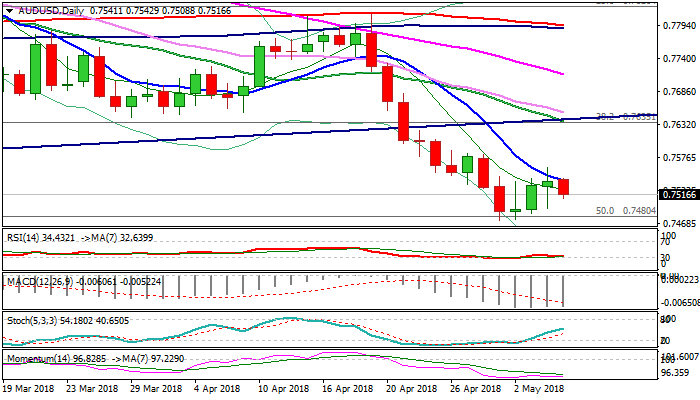
AUDUSD – Near-Term Risk Shifts Lower As Recovery Was Capped By 10SMA
The Aussie dollar moved lower after receiving minor support from solid Australian business confidence data in Asia, as upside attempts were capped by falling 10SMA (0.7538).
This increases risk of three-day recovery stall, as Friday's action ended in long-legged Doji and was capped by falling 10SMA.
Firm bearish setup of daily MA's and weak momentum studies maintain pressure as recovery attempts are showing initial signs of stall, being also weighed by falling thick 4-hr cloud.
Today's close in red would add to negative outlook and increase risk of retesting near-term base at 0.7472 and continuation of the downtrend from 0.8135 (2018 high).
Alternatively, firm break above 10SMA would sideline immediate downside risk and expose next pivotal barrier at 0.7602 (Fibo 38.2% of 0.7812/0.7472 descend).
Res: 0.7538, 0.7560, 0.7583, 0.7602
Sup: 0.7500, 0.7472, 0.7456, 0.7420
China FX reserves dropped to five month low in USD term
According to the latest data from People's Bank of China, the country's foreign exchange reserves dropped to a five month low in April. Reserves dropped USD 17.97B in April from USD 3.143T to USD 3.125T. In SDR terms, Foreign currency reserves rose 11.3 B from 2.162T to 2.173T.
Gold reserves was unchanged at 59.24 Million oz.
Total reserves dropped from USD 3.240T to USD 3.221T. In SDR terms, total reserves rose from 2.229T to 2.240T.