Sample Category Title
GER 30 Index Rises To 3-Month High, Positive But Possibly Overbought
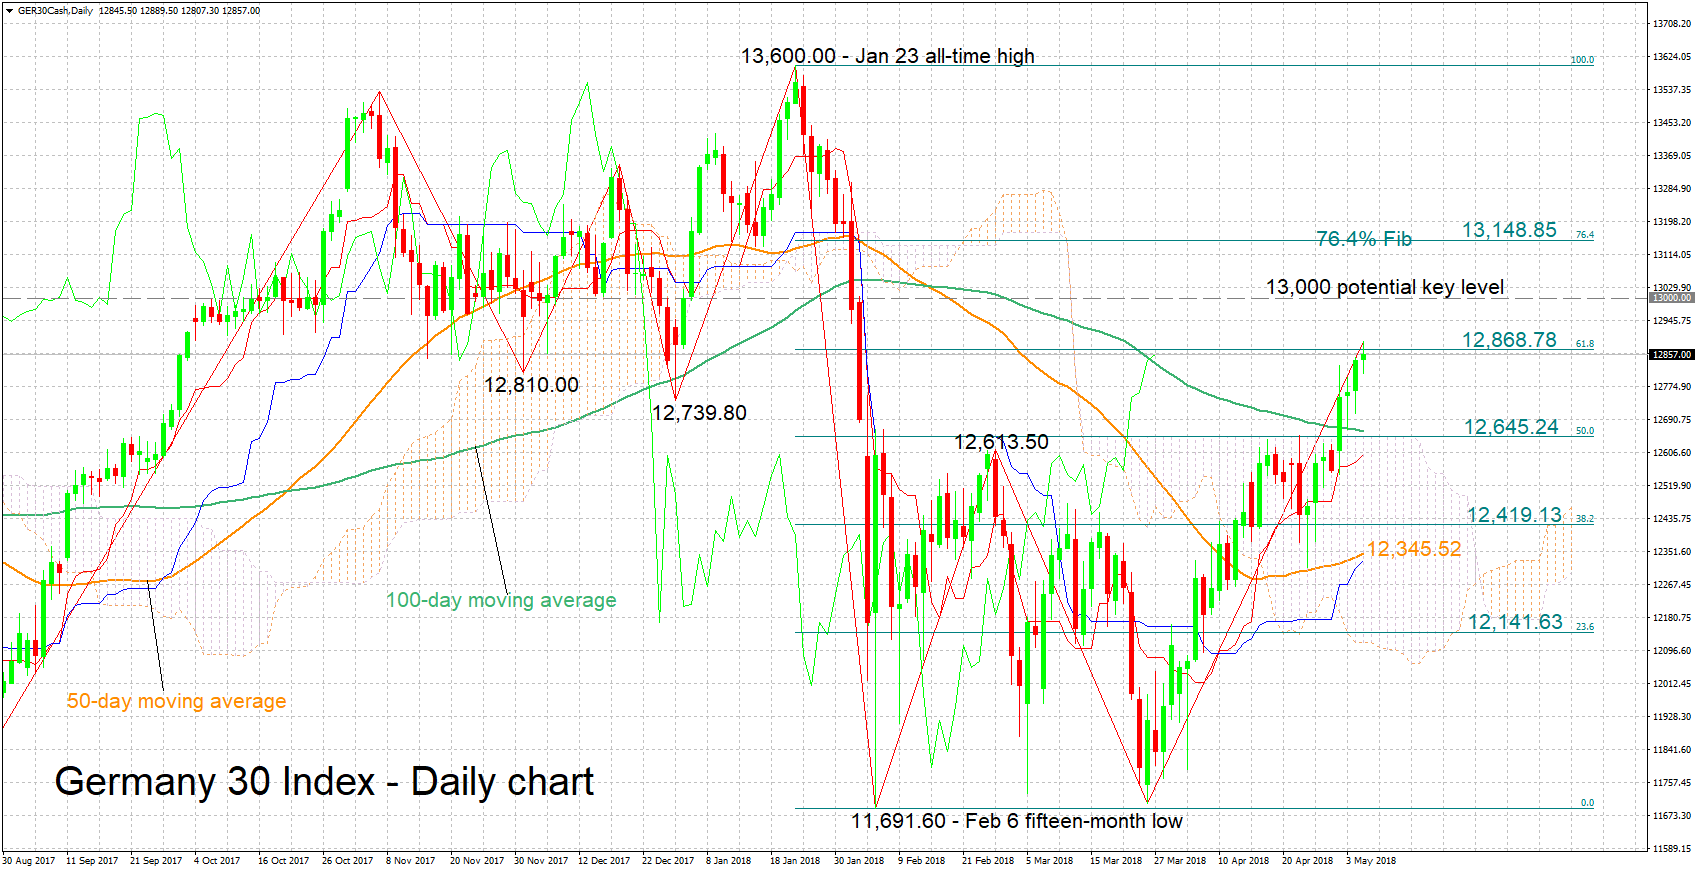
The Germany 30 index has climbed considerably since late March and after coming close to revisiting the 15-month low of 11,691.60 recorded in early February. Earlier on Monday, the index touched a three-month high of 12,889.50.
The Tenkan-sen and Kijun-sen lines are positively aligned, supporting the case for a bullish bias in the short term. The Chikou Span, though, may be hinting to an overbought market, the implication being that a pull-back in the near term is not to be ruled out.
Immediate resistance might be taking place around the 61.8% Fibonacci retracement level of the January 23 to February 6 downleg at 12,868.78. This level itself was momentarily violated earlier in the day, but the area around it seems to be still acting as a barrier to the upside. Further above, additional resistance could come around the 13,000 handle, a level of potential psychological importance.
On the downside, support could come around the 50% Fibonacci mark at 12,645.24, with the region around it encapsulating other levels that may be of significance, such as the current level of the 100-day moving average (12,660.28), the Ichimoku cloud top (12,645.80) and the Tenkan-sen (12,599.90). But before price action reaches the area around the 50% Fibonacci level, a couple of bottoms from the recent past at 12,810.00 and 12,739.80 might provide support as well.
The medium-term outlook has turned predominantly bullish after the index crossed above the 100-day MA (and consequently above the Ichimoku cloud). A drop back below this level though, would set a more neutral medium-term picture.
Overall, both the short- and medium-term outlooks are looking mostly positive, though a signal for a possibly overextended rally in the short term is in place at the moment.
Oil Topped Above $70 | Gold’s Price Dances On The Dollar Index Move
- Hedge funds and money managers have trimmed their long position
- Traders have pushed the oil price higher due to the geopolitical concerns
Traders are taking every opportunity to buy the dollar index, the index has made its strongest level for the year today and we believe that the trend would still continue. This has an impact on the price of the gold. The US NFP number released on Friday was largely short of expectation, especially the wage growth print. It was completely rotten. As we said on Friday, that no matter how you have look at the US NFP number, the message was that it is a feeble number. What changed the sentiment again for the dollar index was the speeches of the Federal Reserve Bank member who clearly said they are an open mind when it comes to the topic of interest rate hike.
Investors have still focused on the factors which are positive; the headline employment number. These factors are keeping the dollar rally going which is pushing the gold price lower. Hedge funds and money managers have trimmed their long position and if this trend continues, it is likely that we may see the gold price breaking the 1300 mark
Having said all this, we have started a very important week and some major news are due this week and they have potential to support the gold price. Trump’s decision on Iran, US and China trade deal are just few of them.
Traders have pushed the oil price higher due to the geopolitical concerns and the price has topped the $70 level for the first time since November 2014. President Trump is going to make a decision on Iranian nuclear deal this week and if he decides that he is going to walk away from the deal, we could see the oil price soaring even further. Iran is playing a major in global oil production and since 2016 after the sanctions were lifted, and if the US walks away from the deal, it would disturb the global supply and demand equation. We already know that the crisis over in Venezuela has halved its oil production and this is mainly because industry in Venezuela didn’t not keep up the pace with technology
USD/CAD Rectangle Consolidation In Intraday Timeframe
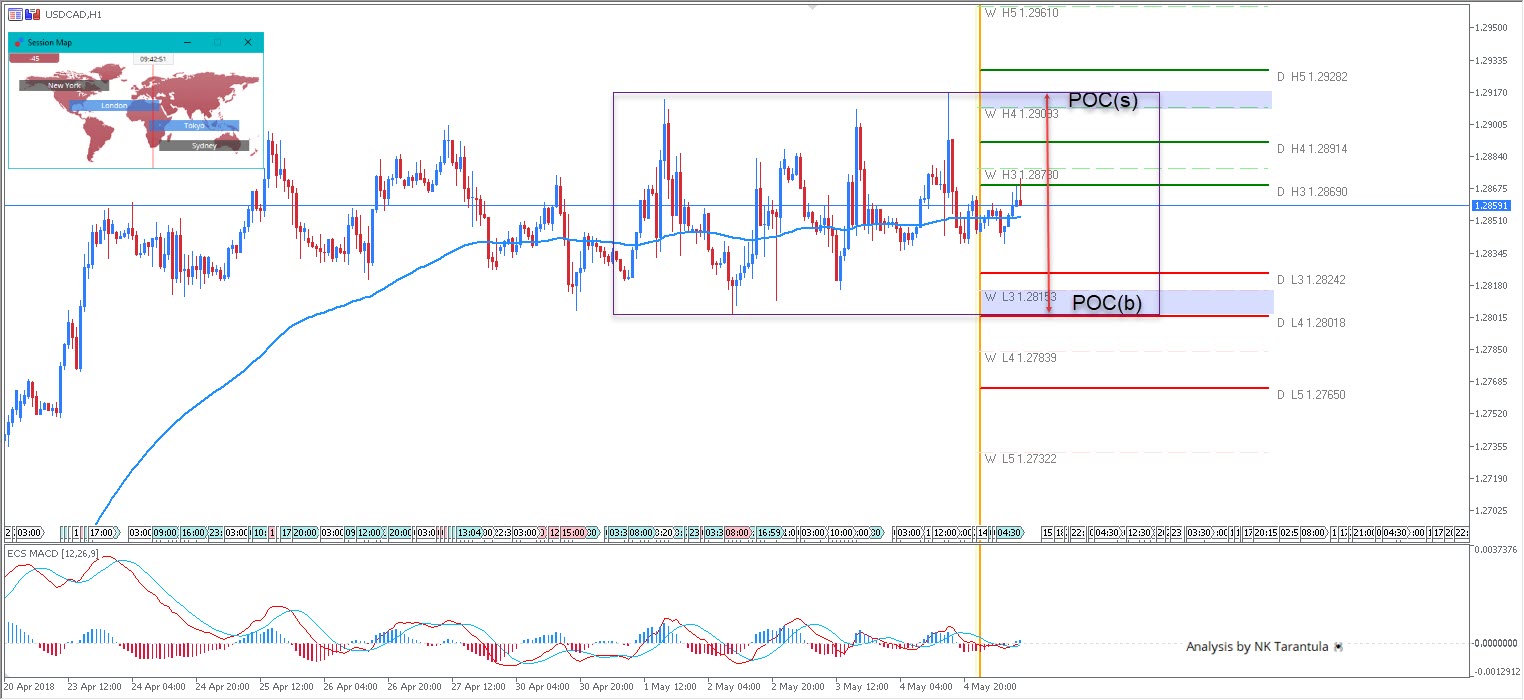
The USD/CAD has been consolidating within the rectangle between W H4 and W L3 levels. Traders need to pay attention to all weekly levels pivot points that are contained in the box. 1.2908 1.2878 and 1.2815. Daily pivot levels are also significant so we need to look at the confluence. We might expect short sellers to sell within 1.2908-20 zone and fresh buyers within the 1.2800-15. Until the consolidation is broken on the USD/CAD, we should see a range play.
W L3 - Weekly Camarilla Pivot (Weekly Interim Support)
W H3 - Weekly Camarilla Pivot (Weekly Interim Resistance)
W H4 - Weekly Camarilla Pivot (Strong Weekly Resistance)
D H4 - Daily Camarilla Pivot (Very Strong Daily Resistance)
D L3 – Daily Camarilla Pivot (Daily Support)
D L4 – Daily H4 Camarilla (Very Strong Daily Support)
POC - Point Of Confluence (The zone where we expect price to react aka entry zone)
GBP/USD Tests Wave 4 Resistance Fibs Levels At 1.36
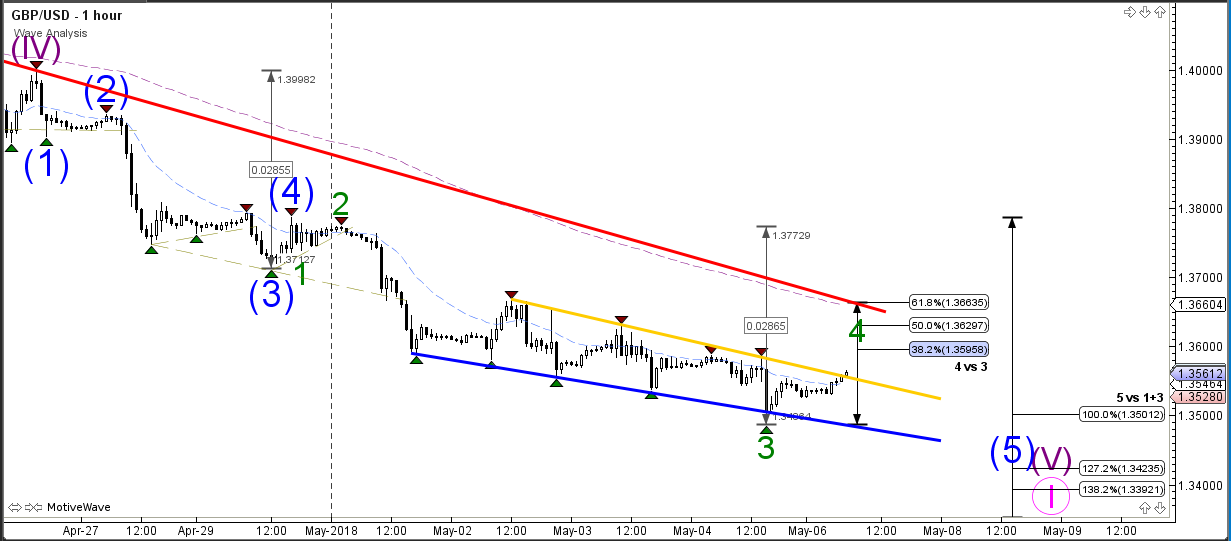
The GBP/USD is making a bullish bounce after failing to break below the support trend line (blue). The trend however remains bearish and the current rally could only be a retracement. Price action stays bearish as long as price remains below the resistance trend line (red) but a bullish break above the resistance would indicate the completion of wave 1 (pink) and the start of wave 2.
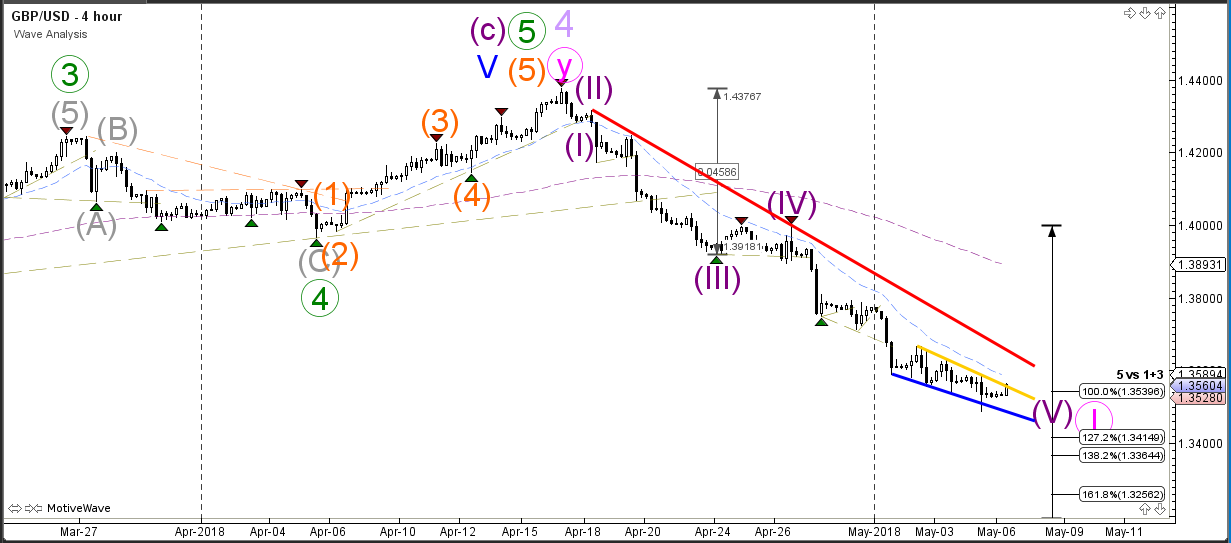
The GBP/USD could be retracing back to the Fibonacci levels of wave 4 (green) which could act as a reversal spot for a downtrend continuation. Price has probably completed the wave 4-5 (green) correction if price breaks above the 61.8% Fibonacci retracement level. Otherwise price is probably still expanding the wave 4 (green) correction.
USD/JPY Challenges 110 Key Resistance Zone For 2nd Attempt
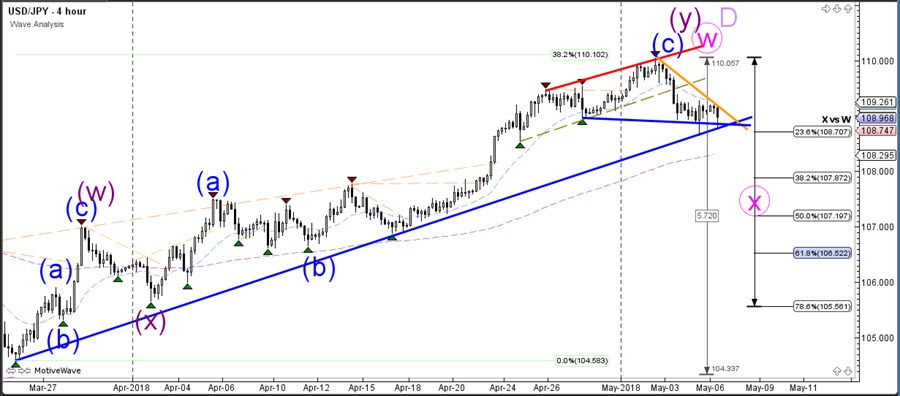
The USD/JPY needs to break below the support trend lines (blue) near 109 before a larger bearish correction within wave X (pink) becomes more likely. A bullish breakout above the 110 resistance level could indicate an extension of the wave W (pink) towards the 50% Fib at 111.50. A break below 109 could see price fall towards 108 and 107.50 support levels.
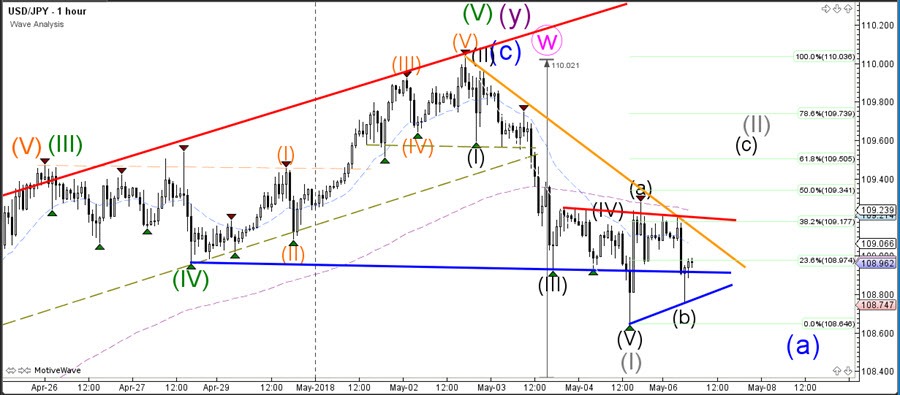
The USD/JPY could be building a wave 1-2 (grey) pattern within a larger wave A (blue). If price makes a bearish bounce at the Fibonacci levels of wave 2, then a larger ABC pattern could take place within wave A. A break above the 100% Fibonacci level and resistance zone at 110 invalidates the wave 1-2 pattern.
EUR/USD Bounce Or Break Spot Within Bearish Wave 3
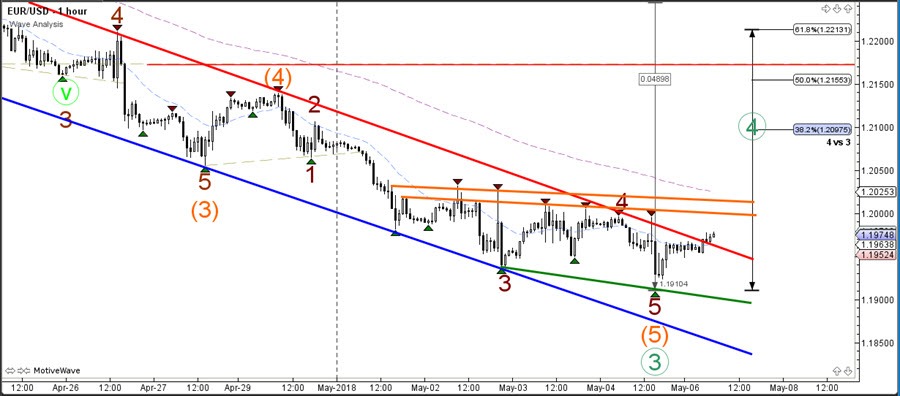
The EUR/USD is facing strong opposite from the resistance zone marked by the trend lines (orange and red). A bullish breakout above the resistance could see price retrace back to the Fibonacci levels of wave 4 (green) which in turn could be bearish reversal spots for a downtrend continuation. An immediate bearish continuation with the bearish channel could see price expand the bearish wave 3 (green) to a lower low and price could make a breakout towards 1.1750-1.18.
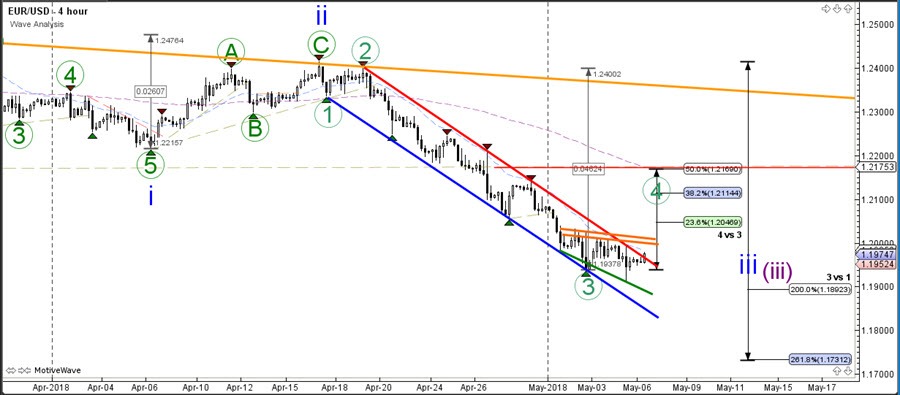
The EUR/USD is hitting multiple resistance levels and a bearish bounce could send price lower to retest the previous bottom. Price will need to break below the previous low for a larger bearish continuation seems likely. A bullish breakout could indicate the start of the wave 4 (green).
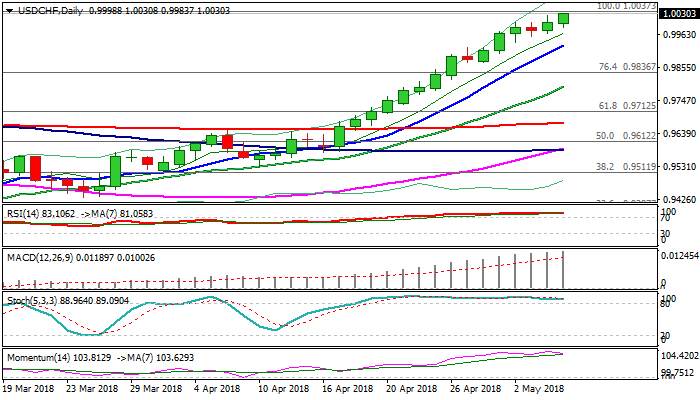
USDCHF Establishes Above Parity And Pressure Strong Barrier At 1.0037, Caution On Strongly Overbought Conditions
The pair extends larger rally on Monday and pressures key short-term resistance at 1.0037 (01 Nov peak) after generating bullish signal on weekly close above parity level.
Full reversal of 1.0037/0.9187 fall would open way for further retracement of larger 1.0343/0.9187 bear-phase and look for test of its Fibo 76.4% at 1.0070.
Daily MA's are in full bullish setup but strongly overbought slow stochastic / RSI, with bearish divergence on slow stochastic and 14-d momentum turning south, warn of possible stall.
No firmer bearish signals being generated so far, but caution is required, as lower platform at 1.0037 marks significant barrier.
Rising 10SMA continues to track the ascend and marks initial support at 0.9925, while rising thick 4-hr cloud (0.9908/0.9818) underpins and marks next strong support zone.
Res: 1.0037, 1.0070, 1.0092, 1.0174
Sup: 1.0000, 0.9955, 0.9925, 0.9908
Confusion In FX
Confusion in FX
FX markets start the week directionless and scant motivation to pick a direction. EURUSD has already retraced gains achieved on Friday. Friday weak headlines payroll (164k vs. 190k consensus estimate), while unemployment rate fell to 3.9%, encouraged equity traders yet gained to excite USD bulls. The subdued wage growth lowered the risk of quicker rate hikes at the Fed. General risk on sentiment pressured the front-end of the US treasuries, which supported tech and financial sectors. Commodities have latched on the positive feeling to drive up oil prices (wti $70.69 high) and commodity currencies. Overall, market are waiting for new direction, willing to wait for fundamental guidance. The BoE and RBNZ are expected to hold rates while BoJ and Riksbanks will released policy meeting minutes. Perhaps the most meaningful data will be inflation from the US and Switzerland.
We remain sidelined on the current USD rally, as the rationale remains elusive. Overly short USD positive has been cut while interest rates correlation is inconsistent with pricing patterns. In fact in the G10 only the GBP is now driven by changing monetary policy. We do understand the risk that USD breakout of 3-month range suggests a stronger correction is in the making. However, lacking understandable drivers we would rather wait. Especially since looming deadlines for the Iranian nuclear deal and ominous warning from U.S. President Donald Trump's attorney, Rudy Giuliani, that other hush payments to women outside pornstar Stormy Daniels was a possibility. Political chaos in the US is now being ignored by the markets, however the closer we get to the midterm elections the higher the risk becomes. As for this week play the range with low probably of a break out expected. Of course, keep our eyes on Turkey were political instability is ramping up.
Oil prices steep rise surprises
Currently trading at November 2014 range, oil rise seems wide opened for further increase, strongly supported by recent macroeconomic events supporting upward commodity prices. Looming US sanctions against one of the largest OPEC producer, Iran, as well as continued economic and political crisis in Venezuela reinforce that global trend started in February 2018.
Bouncing off from 58.23 (14/02/2018 low) and 61.76 (13/02/2018 low) respectively, both US West Texas Intermediate and Brent crude oil futures sharp rise (+16.01% and +20.17% from February low) is expected to strengthen, as Trump administration is likely to disengage from Iran deal this week. Shanghai crude oil futures are meeting the same fate, currently trading at CNY 454 (USD 71.42) and reaching historical high since its start in March 2018.
Therefore, we would expect both oil price futures to converge towards 70.70 and 75.90 in the short-term.
US – China commercial tensions are economically felt
Mnuchin US treasury secretary talks with Chinese premier Liu He on Friday confirmed a rather rough start for both nations who are somehow trying to endeavor a win-win agreement, a relatively less likely scenario as long as both nations won’t get prepared for a “give and take” scheme. Accordingly, Chinese first quarter current account balance deficit above USD 28 billion (prior: USD + 62 billion), a historical low, strongly reflects the fact that both nations must count on much smaller surplus in the near future as long as bilateral tensions are not restored. The final accord on China’s current account surplus over the US could have important repercussion on the CNY, which would be much weaker and volatile if its trade suplus is expected to shrink.
Bitcoin Heading Along 9200
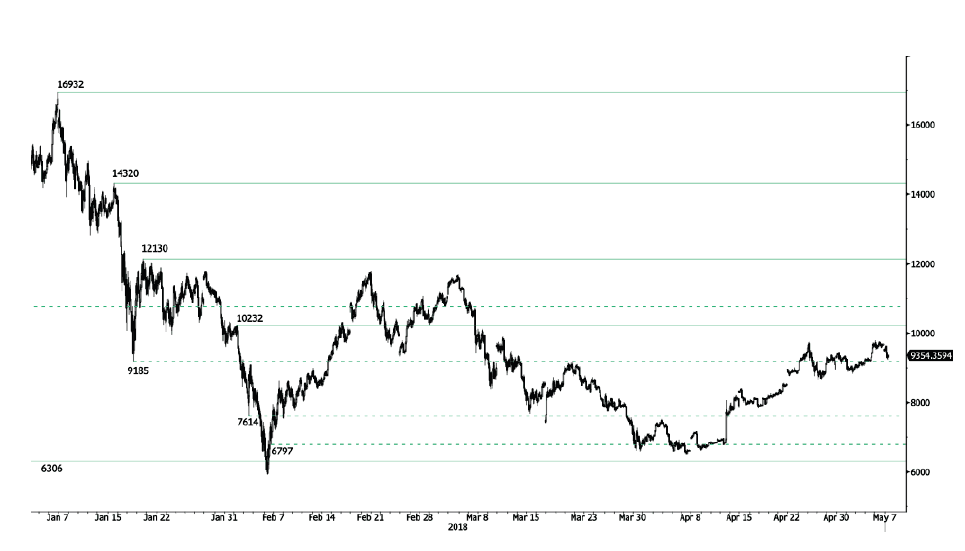
Bitcoin rise started in mid-April pauses, the pair is currently decreasing following recent rise at 9629, heading along the 9300 range. Bitcoin bearish pattern started in March 2018 weakens. The pair is contained between hourly support and resistance given at 6306 (13/11/2017 low) and 10232 (01/02/2018 high). The technical structure suggests short-term decrease.
In the long-term, the digital currency has had an exponential growth but also presented important downturns. There is decent likelihood that the currency could stabilize between 7'000 - 12'000 in 2018. Bitcoin is trading slightly above its 200 DMA (8300 range).
CRUDE OIL Strengthening
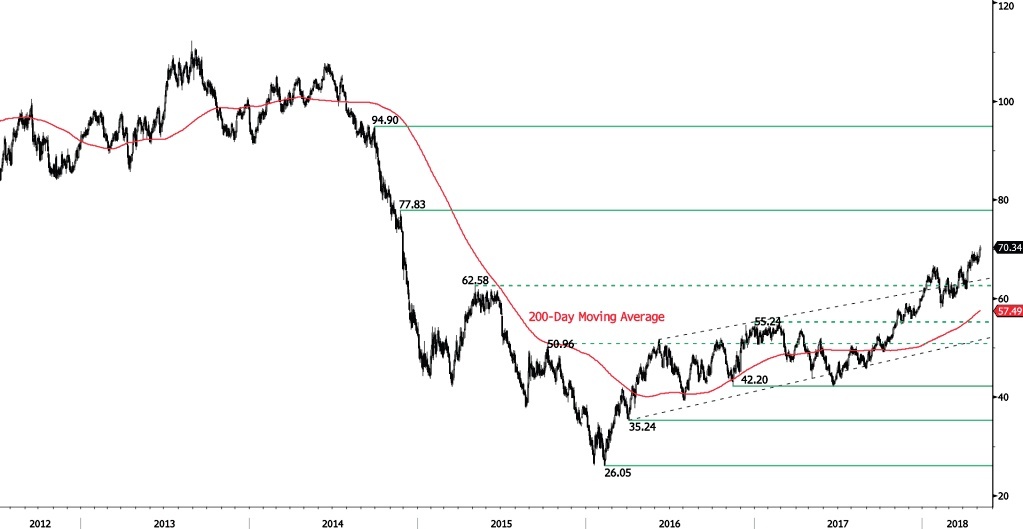
Crude oil is increasing further, trading above 70 and heading along the 70.70 range. Crude Oil is currently trading at December 2014 levels. The bullish pattern started in mid-February 2018 is maintained. Hourly support and resistance are given at 65.56 (17/04/2018 low) and 73.56 (28/11/2014 high). The technical structure suggests short-term upward moves.
In the long-term, crude oil has recovered after its sharp decline last year. However, we consider that further weakness is very likely. For the time being, the pair lies in an upside trend since June 2017. Support lies at 42.20 (16/11/2016) while resistance is located at 77.83 (20/11/2014). Crude oil is trading largely above its 200 DMA.