Sample Category Title
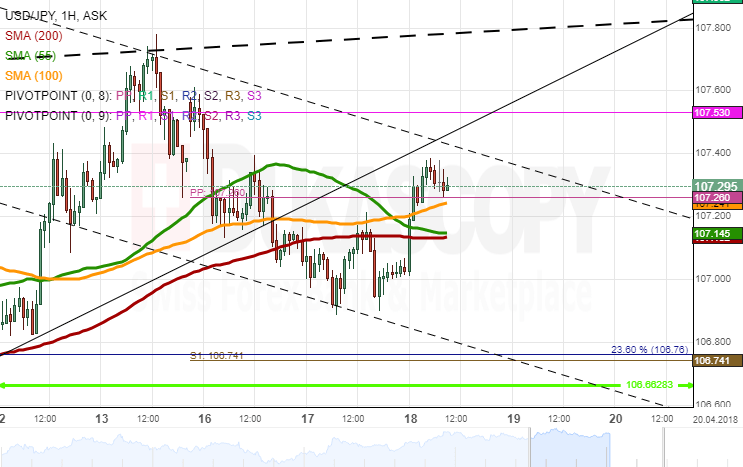
USDJPY Analysis: Breaches Strong Resistance
Tuesday was rather uneventful for the USD/JPY exchange rate, as it spend the majority of the session slightly below the 100– and 200-hour SMAs.
The US Dollar eventually gathered enough momentum to dash through this resistance cluster early today. As a result, it was located near the boundaries of two channels circa 107.40.
From theoretical point of view, the rate should reverse near this area. However, it is more likely that the rate continues pushing higher, given its ability to surpass the comparatively strong resistance cluster near 107.20.
The nearest northern barrier is set the monthly R1 at 107.50, while a more probable upside target for today is the upward-sloping trend-line at 107.80.
XAUUSD Analysis: Indecisive In Morning
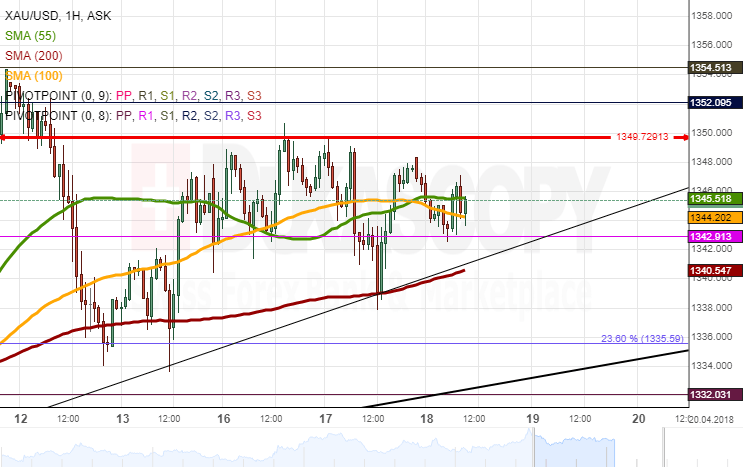
The yellow metal has been trading below the 1,350.00 mark for the third consecutive session. Together with an upward-sloping trend-line, the pair has formed a minor ascending triangle.
The diminishing trading range within this pattern suggests that a breakout should occur soon. Technical indicators flash bullish signals. In line with this scenario, Gold should breach its three-day resistance and approach either the monthly R1 or the senior channel at 1,355.00 and 1,360.00, respectively.
On the other hand, bears might take advantage of bulls' inability to push the pair above the 1,350.00 level. They could move the rate past the 200-hour SMA and towards the 1,335.00 area where the 23.60% Fibonacci retracement and a medium-term channel are located.
Elliott Wave Analysis: Crude Oil And BTCUSD Update
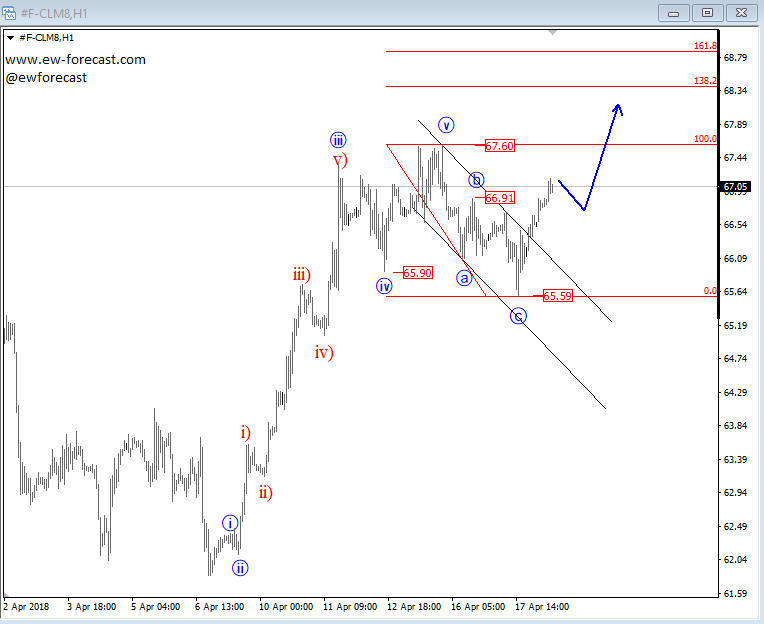
Crude oil is pointing to new highs after five-waves up and three-waves down, which can be actually a perfect bullish setup that can take energy up to 68.30-69.00 area based on short-term upper Fib. projection. Broken wave (b) swing and broken corrective channel line suggest that bulls are not over yet.
Crude oil, 1h
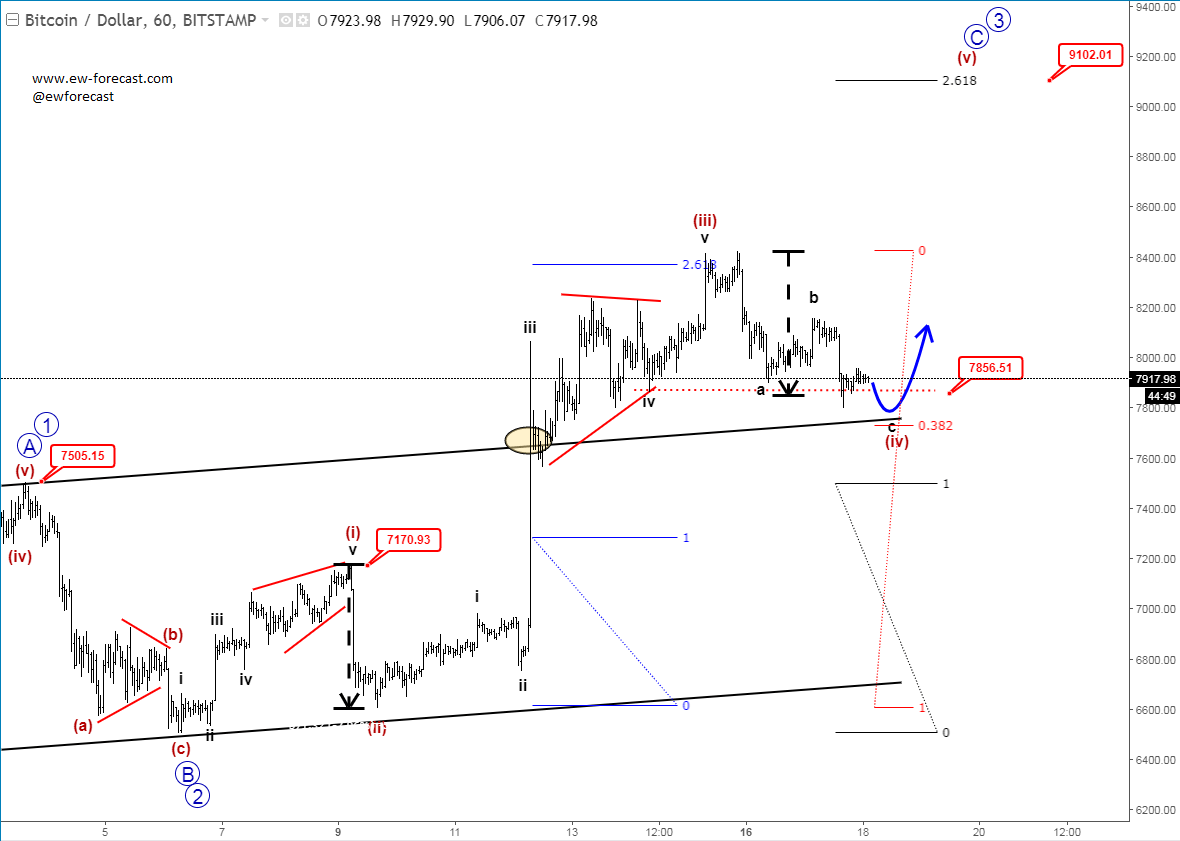
Bitcoin can be unfolding five waves up for wave C/3. Currently consolidating within wave (iv) with support around 38,2% Fibo. retracement and 7700-7800 levels, from where we can expect a bounce for wave (v) towards 9k level to complete a five-wave cycle.
BTCUSD, 1h
CRUDE OIL Strengthening
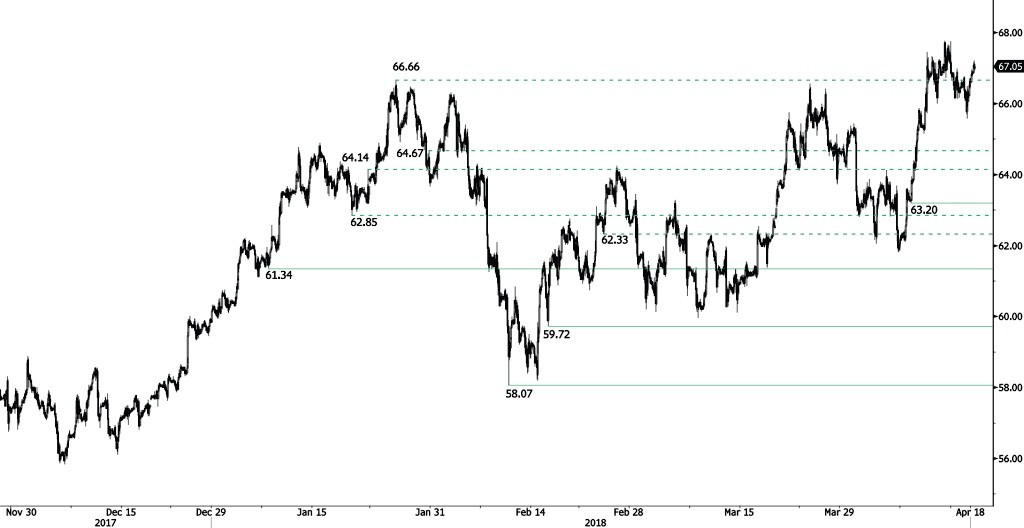
Crude oil is recovering from recent decline at 65.56, heading along the 67.20 range. Crude Oil is trading at its December 2014 high. The bullish pattern started in November 2017 is confirmed. Hourly support at 63.20 (10/04/2018 low) is distanced. The technical structure suggests further short-term increase.
In the long-term, crude oil has recovered after its sharp decline last year. However, we consider that further weakness is very likely. For the time being, the pair lies in an upside trend since June 2017. Support lies at 42.20 (16/11/2016) while resistance is located at 77.83 (20/11/2014). Crude oil is trading largely above its 200 DMA.
SILVER Rising
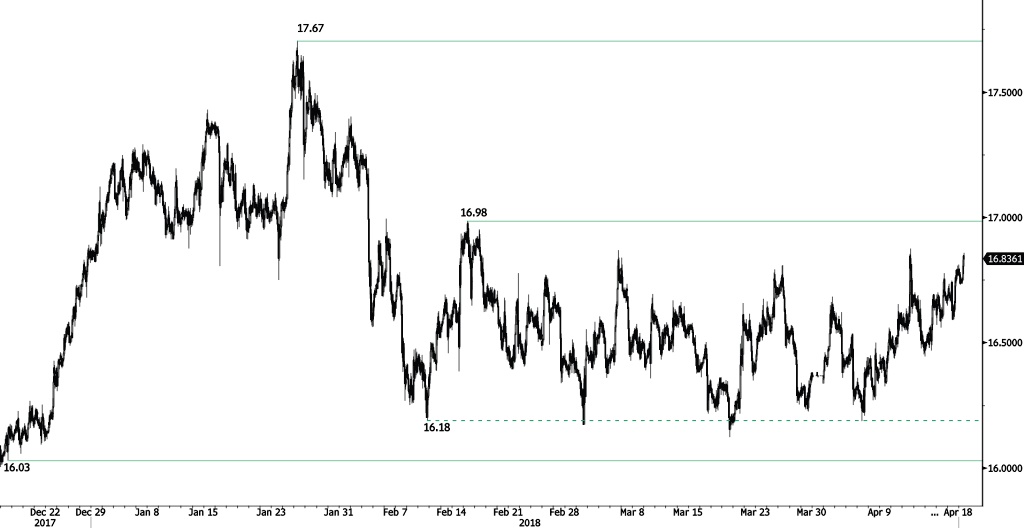
Silver rising pattern started in mid April continues, approaching the 16.87 range. Silver is contained between hourly support and resistance given at 16.03 (18/12/2017 low) and 16.98 (15/02/2018 high). The short-term technical structure suggests short-term increase.
In the long-term, the trend remains negative/ sideways. Further downside is very likely. The pair is trading at its 200 DMA. Resistance is located at 21.58 (10/07/2014 high). Strong support can be found at 11.75 (20/04/2009).
GOLD Weakening
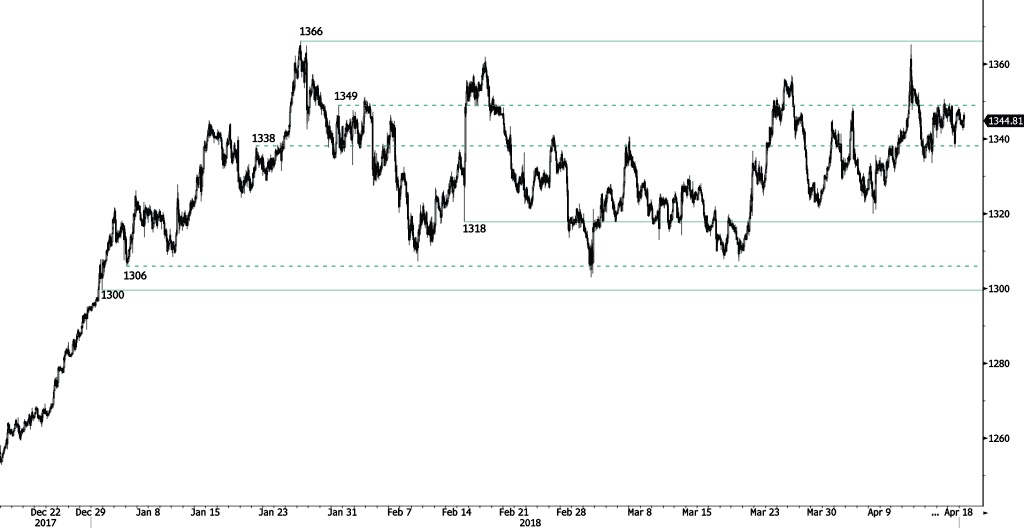
Gold is declining after reaching 1347, heading along the 1342 range. Hourly support and resistance are given at 1318 (14/02/2018 low) and 1366 (25/01/2018 high). The technical structure suggests short-term downward moves.
In the long-term, the technical structure suggests that there is a growing upside momentum. A break of 1'392 (17/03/2014) is required to confirm it. A major support can be found at 1'045 (05/02/2010 low).
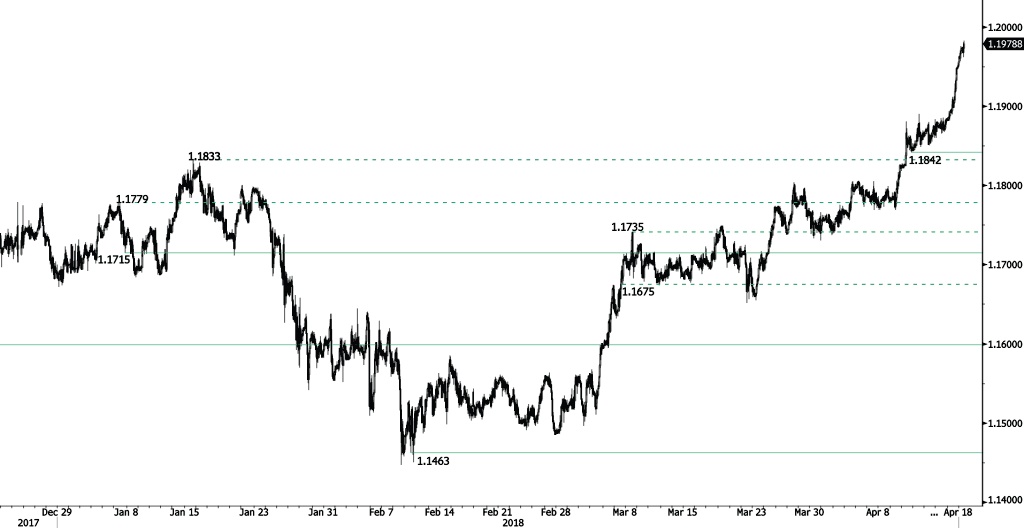
EUR/CHF Approaching 1.20
EUR/CHF is increasing further, approaching the 1.20 range and heading along the 1.1980 range. Strong resistance at 1.20 (level before the unpeg) remains. Hourly support given at 1.1715 (07/01/2018 low) is distanced. The short-term technical structure suggests short-term increase.
In the longer term, the technical structure has reversed. Strong resistance is given at 1.20 (level before the unpeg). Yet, the ECB's slowing QE program is likely to cause buying pressures on the euro, which should weigh in favour of the EUR/CHF. Support can be found at 1.0624 (24/06/2016 low).
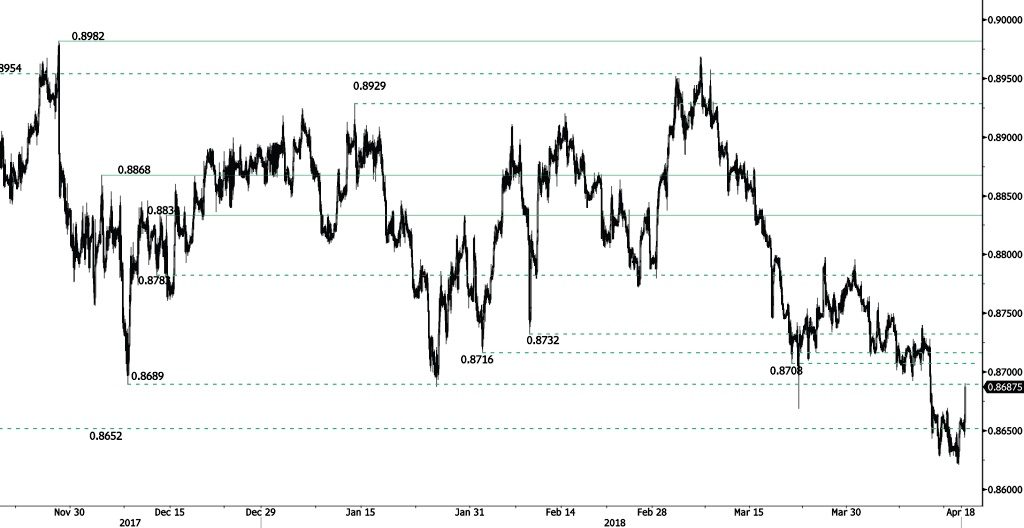
EUR/GBP Bullish Breakout
EUR/GBP bullish momentum started from 0.8644 continues, heading along the 0.8721 range. EUR/GBP bearish pattern started in March remains. Hourly support at 0.8652 (08/06/2017) is now broken while hourly resistance at 0.8834 (14/12/2017 high) is distanced. The technical structure suggests short-term increase.
In the long-term, the pair has largely recovered from 2015 lows. The technical structure suggests further upside pressure. Strong resistance can be found at 0.9500 (psychological level) while support remains at 0.8304 (05/12/2016 low). The pair is trading below its 200 DMA.
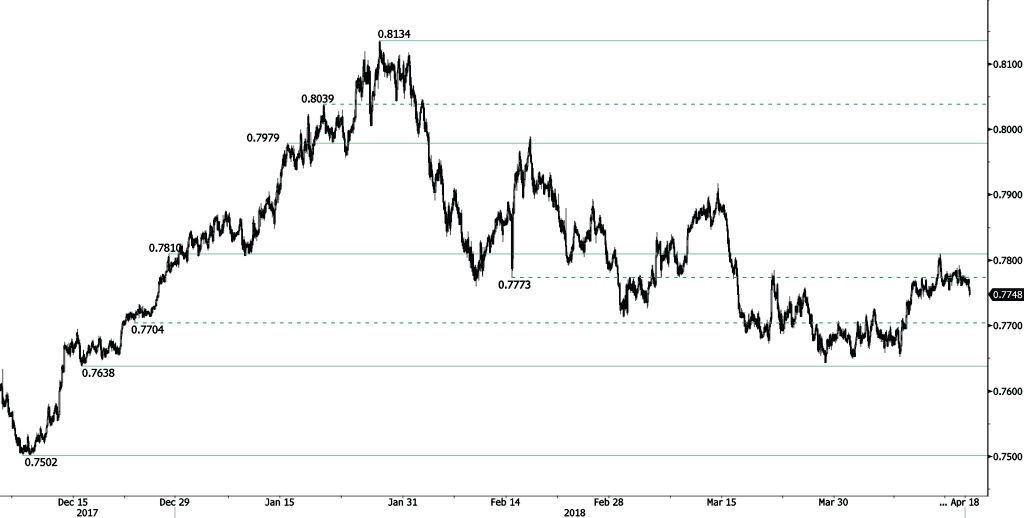
AUD/USD Heading Lower
AUD/USD short-term momentum stops, decreasing from 0.7772 high and heading along the 0.7745 range. Hourly support and resistance at 0.7638 (15/12/2017 low) and 0.7810 (28/12/2018 high) remain. The technical structure suggests short-term downward moves.
In the long-term, the upward trend slows down after failing to reach key resistance at 0.8164 (14/05/2015 low). Key support stands at 0.6009 (31/10/2008 low). A break of the key resistance at 0.8164 (14/05/2015 high) is needed to invalidate our long-term bearish view.
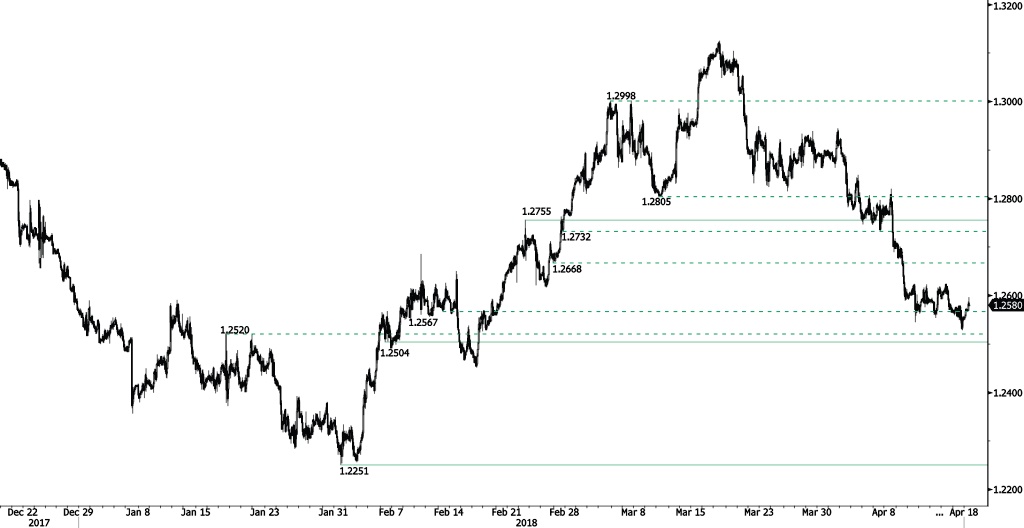
USD/CAD Approaching 1.26
USD/CAD recovery phase from 1.2528 low continues, heading along the 1.2595 range. Hourly support and resistance are given at 1.2504 (06/02/2018 low) and 1.2755 (22/02/2018 high). The short-term technical structure suggests short-term increase.
In the longer term, the pair is trading between resistance point at 1.3805 (05/05/2017 high) and support at 1.2128 (18/06/2015 low). Strong resistance is given at 1.4690 (22/01/2016 high). The pair is likely to head lower. The pair is trading below its 200 DMA.