Sample Category Title
Sterling Lower After UK Wage Data
The British pound has started to correct lower against the U.S dollar, following a weaker than expected increase in monthly wages earnings from the UK economy. The GBPUSD pair currently trades around the 1.4320 region, after earlier hitting 1.4376, which marked sterling’s highest trading level since the day of Brexit. Traders now look towards the release of U.S macroeconomic data and a host of FED speakers, with the 1.4344 level the key upside pivot level to watch.
The GBPUSD pair is likely to move higher while trading above the key 1.4344 level, resistance is now found at the 1.4376 and 1.4440 levels.
Should the GBPUSD pair start to trade below the 1.4300 level, a price-correction towards the 1.4260 and 1.4230 levels appears possible.
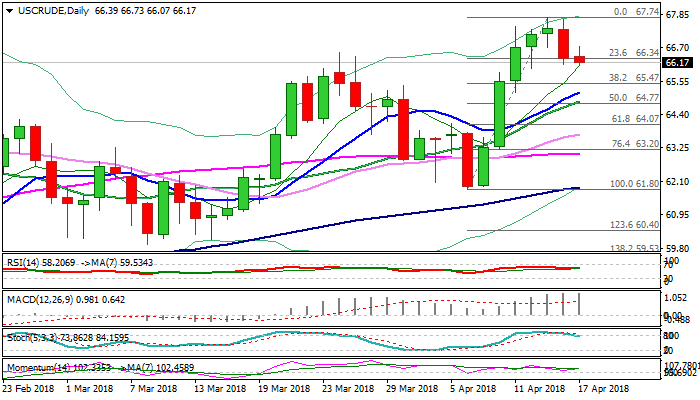
WTI OIL – Pullback Found Footstep Ahead Of $66 Support But Further Easing Cannot Be Ruled Out
Pullback from new over three-year high at $67.74 found temporary footstep just ahead of $66.00 round-figure support and consolidating on Tuesday after suffering heavy losses previous day.
Near-term focus is still shifted to the downside as Monday’s long bearish daily candle weighs, as reversal pattern was completed on daily chart, signaling further easing.
The notion is supported by south-heading slow stochastic which reversed from overbought zone and shows a plenty of space at the downside.
However, the pullback was triggered by profit-taking and so far seen as positioning for fresh upside action as bulls focus psychological $70 barrier.
Solid supports at $65.47 (Fibo 38.2% of $61.80/$67.74 rally) and $65.18 (rising 10SMA) should ideally contain extend dips to keep overall bulls intact.
Easing geopolitical tensions in the Middle East are also supportive for oil price.
Near-term focus turns towards releases of US crude stocks reports, as traders are looking to gauge the demand in the world’s largest oil consumer. API report is due today (build of 1.75 million barrels was seen last week) while EIA report will be released tomorrow (0.5 million barrels draw is forecasted vs 1.04 million barrels draw last week).
Res: 66.73, 67.00, 67.74, 68.63
Sup: 66.00, 65.47, 65.18, 64.85
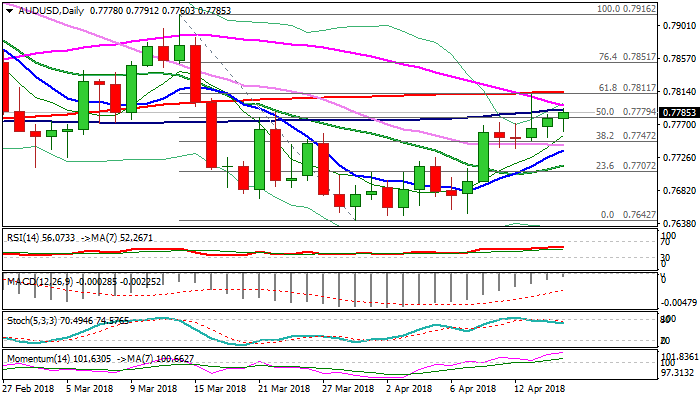
AUDUSD – Recovery From 0.7640 Base Struggles Under 200SMA As Thick Daily Cloud Weighs
The Aussie dollar ticked higher on Tuesday, but lacking strength to retest pivots at 0.7811/13 (Fibo 61.8% of 0.7916/0.7642 / 200SMA) which were tested on Friday's short-lived spike to 0.7810.
Today's action was capped by 100SMA (0.7789) which continues to limit upside attempts for over three weeks.
Rising momentum and bullish setup of 10/20/30SMA's support recovery from 0.7640 base, but limited upside action could be expected while 200SMA caps as widening daily cloud (spanned between 0.7827 and 0.7923) continues to weigh.
Also, weekly cloud top lies at 0.7827 and reinforces barrier.
Bullish scenario requires break and close above the latter to signal extension of recovery leg from 0.7640 base.
Conversely, initial negative signal could be expected on violation of higher base at 0.7740 zone, reinforced by 30SMA and underpinned by rising 10SMA.
Sustained break below these supports would signal recovery stall and shift near-term focus lower.
Res: 0.7789, 0.7813, 0.7827, 0.7851
Sup: 0.7760, 0.7740, 0.7715, 0.7693
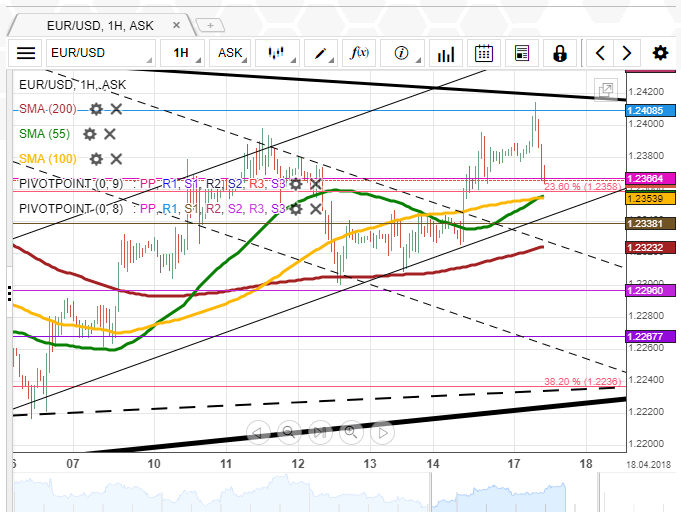
EUR/USD Falls Short From 1.24
The Euro gained enough momentum to dash through the 55– and 100-hour SMAs and a short-term channel down early on Monday. The pair surged 63 pips within a couple of hours and halted shortly before the weekly R1 near 1.24.
Taking into account bullish technical indicators, the Euro might continue edging higher for the eighth consecutive session. This surge, however, is likely to be limited by the weekly R1 or the senior channel near 1.24.
Subsequently, the pair should edge lower down to the combined support of the 55– and 100-hour SMAs, the 23.60% Fibonacci retracement and the junior channel near 1.2350.
This session is full of fundamentals from the US which might introduce some volatility in the market and therefore widen the forecasted trading range.
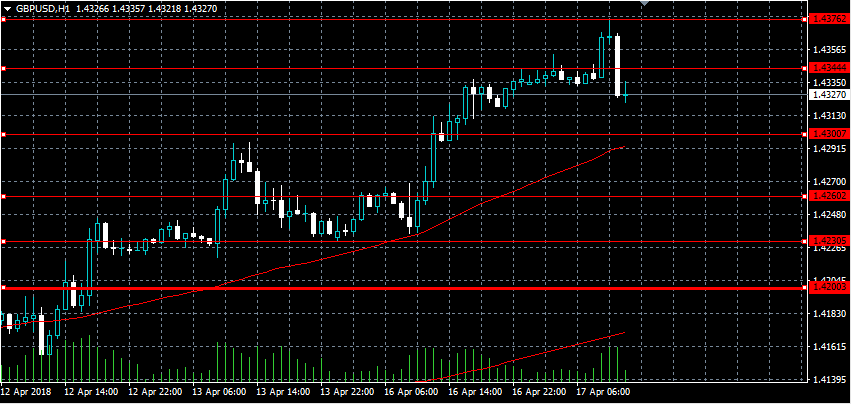
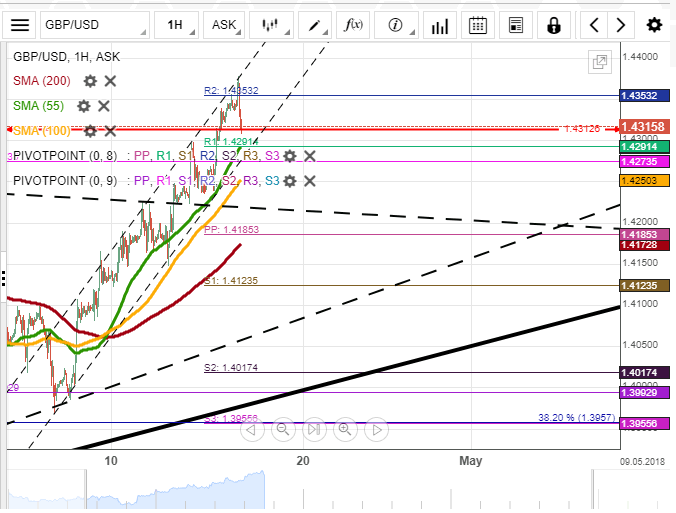
GBP/USD Reaches New 2017/2018 High
The GBP/USD currency pair closed Monday's trading session with a solid 91-pip gain. The biggest surge occurred mid-day when the Pound dashed through 1.4313 - its highest position since the Brexit vote in June 2016—and reached the weekly R1 at 1.4335 later in the evening.
As apparent on the chart, the pair has started to consolidate near this mark, indicating that bulls might need some time to regain their momentum.
Being located in the overbought territory, technical indicators have already started to move lower. Thus, even if some upward movement is apparent during the first part of the day, the pair is unlikely to reach the weekly R2 and should remain below the 1.44 mark.
Meanwhile, significant support is set by the 55– and 100-hour SMAs and the monthly R1 near 1.4260.
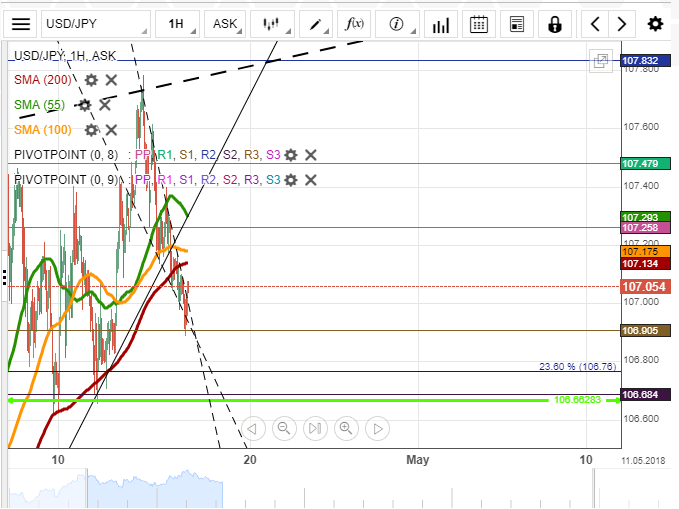
USD/JPY Trades Continues To Edge Lower
Despite technical indicators flashing bullish signals, the US Dollar was driven by strong downside momentum on Monday. During this time, the pair managed to breach the 100– and 200-hour SMAs and the prevailing seven-week channel circa 107.20.
On Tuesday morning, the nearest support was set by the weekly S1 and the 23.60% Fibonacci retracement at 106.75 and a two-week support level at 106.66. The pair is expected remain in the 106.70/107.20 range during this session. It could still edge lower within the following hours prior to reversing northwards and testing the breached moving averages.
The southern barrier should hold firm, while the 107.10 area might actually surrender under the bullish pressure if solid US fundamentals add some upside volatility to the market.
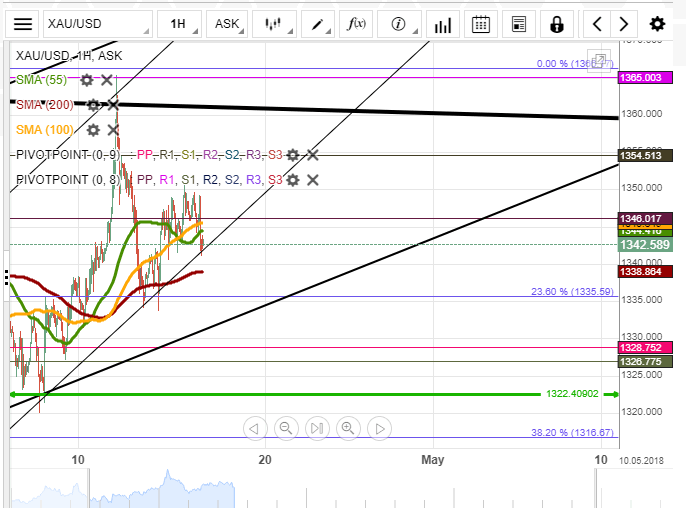
XAU/USD Trades Steady For Second Day
Gold entered a minor period of consolidation late on Friday, as a move below the 1,342.00 was restricted by the 55– and 100-hour SMAs. The same situation was apparent on Monday.
This shows that traders are rather indecisive. On the one hand, bulls are unable to push the yellow metal above the 1.350.00 mark, while the aforementioned support, also reinforced by the nearby 200-hour moving average, limits the beginning of a new wave down.
Technical indicators demonstrate that the pair should move north today towards the monthly R1 and the senior channel at 1,354.50 and 1,360.00, respectively. However, the 2017/2018 high which is located at 1,366.00 is unlikely to be reached in this session.
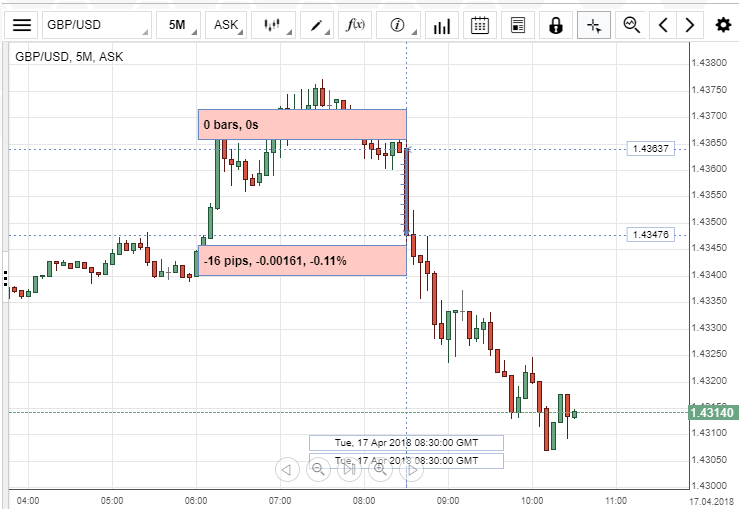
GBP/USD: US Average Earnings Index
The British Pound weakened against the Greenback, following the US Average Earnings Index data release on Tuesday. The GBP/USD currency pair lost 16 pips, or 0.11%.
The Office for National Statistics released three reports simultaneously, from which the most impactful Average Earnings Index data came out lower-than-expected and instead of growing by 3.0%, it stayed in line with the previous period's 2.8% growth rate. Claimant Count Change and Unemployment Rate data came out better-than-expected, having a growth of 11.6K and 4.2% respectively. However, jobless claims grew more than in the previous month, jobless rate decreased, indicating that more people got a job than those who claimed unemployment.
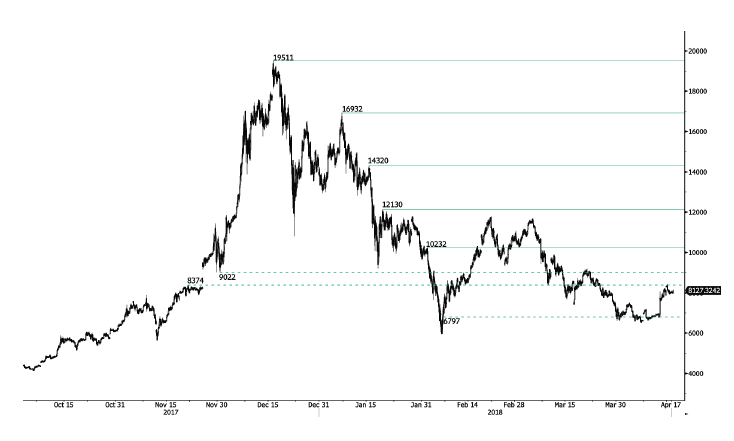
Bitcoin Choppy Bullish Trading
Bitcoin sideways trading phase started in April is interrupted, heading along the 8175 range. Bitcoin bearish pattern started in March 2018 is however maintained as long as the 9000 range is not reached. The pair is contained between hourly support and resistance given at 6306 (13/11/2017 low) and 10232 (01/02/2018 high). The technical structure suggests further shortterm increase.
In the long-term, the digital currency has had an exponential growth but also presented important downturns. There is decent likelihood that the currency could stabilize between 7'000 - 12'000 in 2018. Bitcoin is trading below its 200 DMA (7800 range).
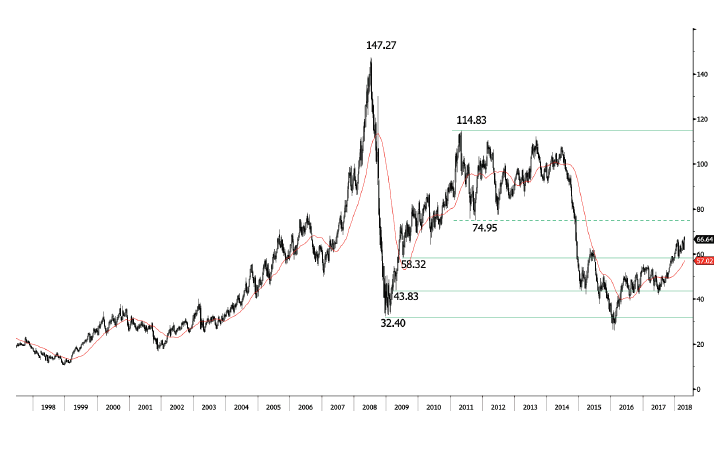
Crude Oil Bouncing Upwards
Crude oil has bounced off 58.32 support continues. Crude Oil is trading at its December 2014 high. The bullish pattern started in November 2017 is confirmed. Hourly support at 63.20 (10/04/2018 low) is distanced. The technical structure suggests short-term increase.
In the long-term, crude oil has recovered after its sharp decline last year. However, we consider that further weakness is very likely. For the time being, the pair lies in an upside trend since June 2017. Support lies at 42.20 (16/11/2016) while resistance is located at 77.83 (20/11/2014). Crude oil is trading above its 200 DMA