Sample Category Title
China Grows And Slows
The world's second largest economy grew at the steady pace of 6.8%y/y in the first quarter of 2018, in line with estimates, and making it the third-straight quarter of 6.8% expansion. Industrial production came in slightly on the soft side in March, printing at 6.0%y/y versus 6.3% expected, while retail sales beat expectation, rising 10.1%y/y versus 9.7% median forecast.
As usual, China displays solid growth figures and this despite of a gentle overall slowdown. Indeed, only a year ago industrial production was growing at an annual pace of 7.6%, while retail sales rose 10.9%y/y. However, one has to keep in mind that Beijing is trying to deleverage its economy and deleveraging inevitably leads to slower growth. Fixed asset investment rose 7.5% in the March quarter, 40bps lower than expected by market participants. State fixed assets investment fell to 7.1%y/y in March, down from 9.1% in February and 10.1% in January, while private investment has been surging continuously since mid-2016, which confirm that the government is working actively at normalising its economy.
We wouldn't say that the outlook is not rosy for China but this year will definitely be more challenging. First the deleveraging effort will continue. Second, the real estate market, which was historically one of the biggest growth driver, will continue to slow down. Finally, the normalisation that is underway - i.e. shifting toward a domestic generated growth from an export driven one – will also affect growth to the downside. However, Chinese institutions will work side by side to soften the negative impacts. Therefore, and in spite of this slightly less bright outlook, we remain confident that China will remain the main growth driver
WTI Crude Oil Futures Trades Below 3-Year High, Possibility Of Bearish Retracement
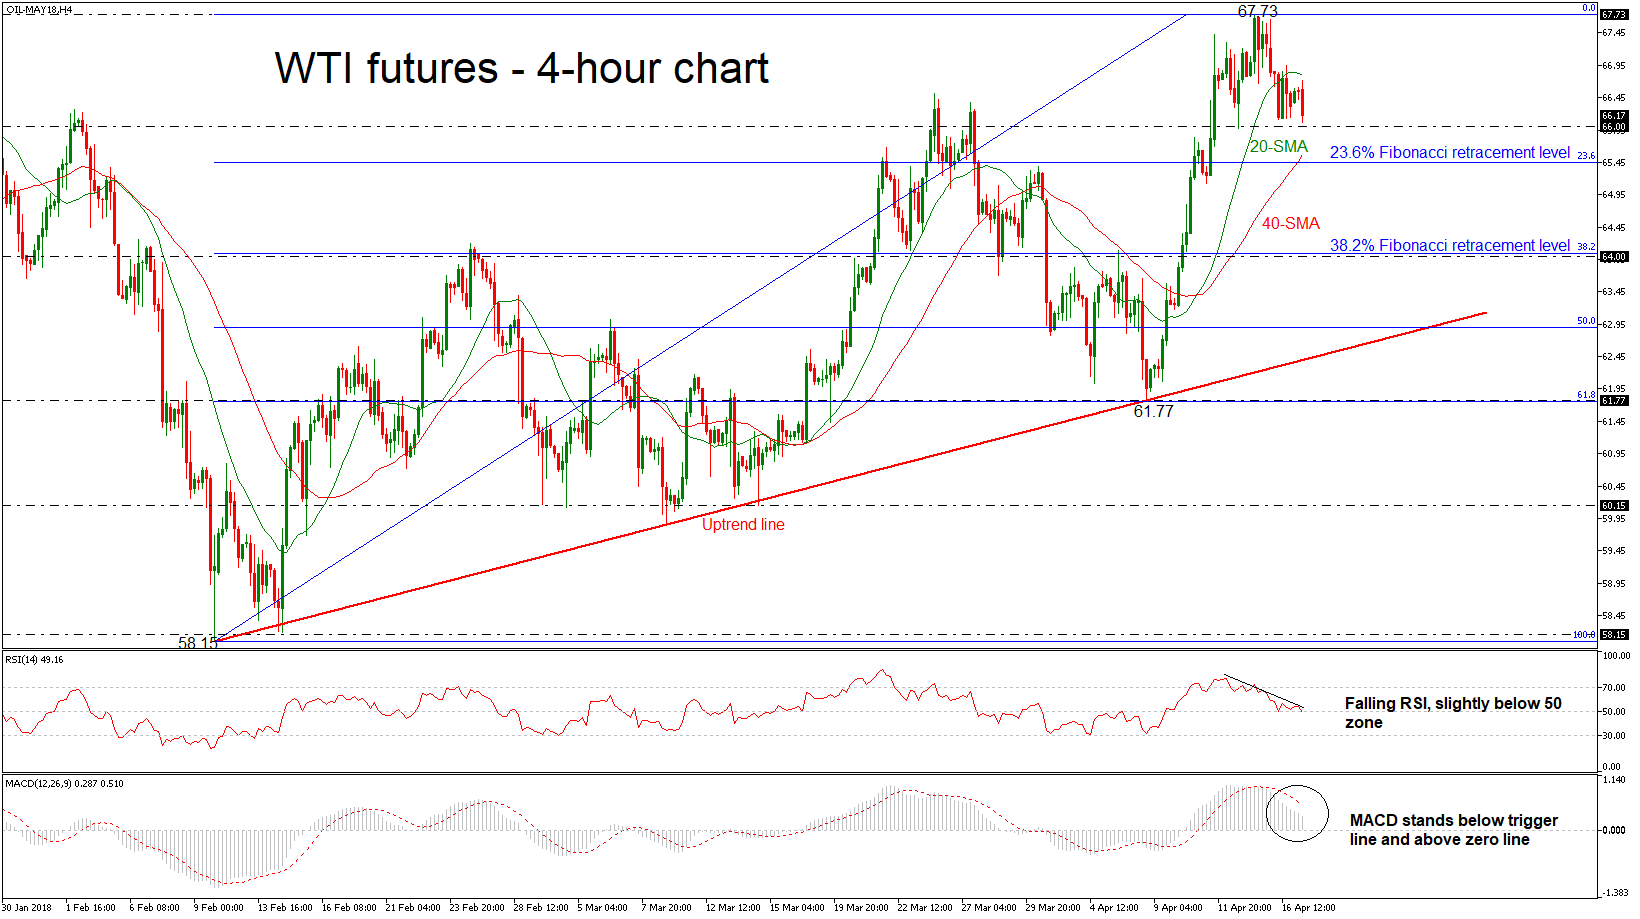
WTI crude oil futures have been underperforming in the past few hours after the pullback from the more than three-year high of 67.73. When looking at the bigger picture the price has been developing within an ascending move since February 9, retesting several times the diagonal trend line. The technical indicators, in the 4-hour chart, are confirming the bearish correction in price action.
After their deep fall, the momentum indicators turned south in the short-term. The RSI indicator is holding slightly below its threshold of 50, while the MACD oscillator is falling below its trigger line but is still standing in the positive territory. As a side note, the price is trading below the 20-simple moving average (SMA), signaling a deeper downward movement.
If prices continue to head lower and have a session close below the 66.00 psychological level, it could endorse the negative scenario and cause a run towards the next support at the 23.6% Fibonacci retracement level of 65.45 of the upleg from 58.15 to 67.76. This level stands near the 40-SMA in the 4-hour chart, which is acting as major support barrier. A decline below this area could open the way towards the 64.00 handle, which coincides with the 38.2% Fibonacci mark.
However, should an upside rally take form again, immediate resistance will likely come from the three-year high. If this area is breached, it could increase upside pressure until the next critical level of 68.00.
German ZEW: Sentiment deteriorated sharply on US trade conflicts and Syrian war
German ZEW economic sentiment dropped to 87.9 in April, down from prior 90.7 and consensus of 88.0. ZEW expectation gauge dropped to -8.2, down from 5.1, below consensus of -1. ZEW noted in the statement that "the reasons for this downturn in expectations can mainly be found in the international trade conflict with the United States and the current situation in the Syrian war. The significant decline in production, exports and retail sales in Germany in the first quarter of 2018 is also having a negative effect on the future economic development."
Eurozone ZEW economic sentiment dropped 1.9, down from 13.4, below expectation of 7.3. " The decline in economic sentiment regarding the Eurozone is likely to be down to the same factors as in Germany, with the figures for production and retail sales in the first quarter of 2018 turning out to be surprisingly negative. Furthermore, the trade conflict with the United States, together with the uncertainties resulting from the Syrian war regarding the relationship between Russia and the US were also having a negative impact on the economic expectations for the Eurozone."
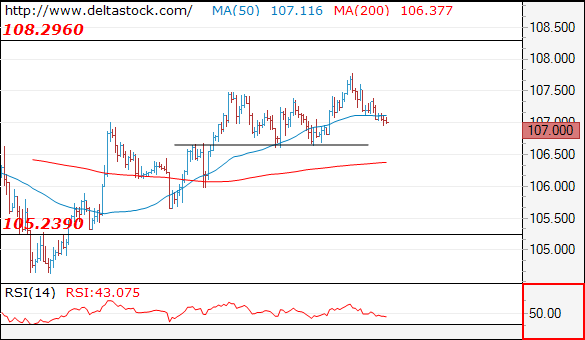
USDJPY – Strong Bearish Signal Expected On Clear Break Below Daily Cloud Base
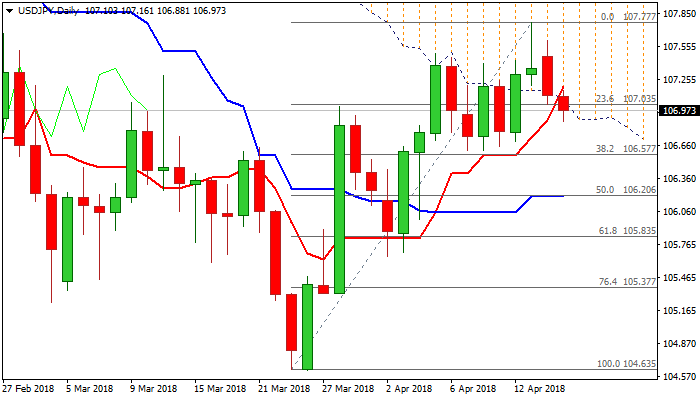
The pair stands at the back foot on Tuesday and extends pullback from new recovery high at 107.77, to probe below key support at 107.07 (daily cloud base).
Monday's close in red completed reversal pattern on daily chart, with close below the base of thick daily cloud needed to confirm and signal further weakness.
Daily bulls which were built on recent recovery rally are losing traction and 14-d momentum is in steep descend and about to enter negative territory, which could further boost pullback.
Extension on firm break below cloud base would open way towards strong supports at 106.60 zone (higher base, reinforced by Fibo 38.2% of 104.63/107.77 recovery leg) loss of which is needed to confirm reversal.
Conversely, close within daily cloud sideline immediate downside threats, however, close above cracked Fibo barrier at 107.56 (50% retracement of 110.48/104.63 bear-leg) is required to generate initial bullish signal.
Meeting of US President Trump and Japan's PM Abe is due on Wednesday and will be closely watched for fresh signals.
Res: 107.16, 107.56, 107.77, 107.97
Sup: 106.60, 106.45, 106.20, 105.83
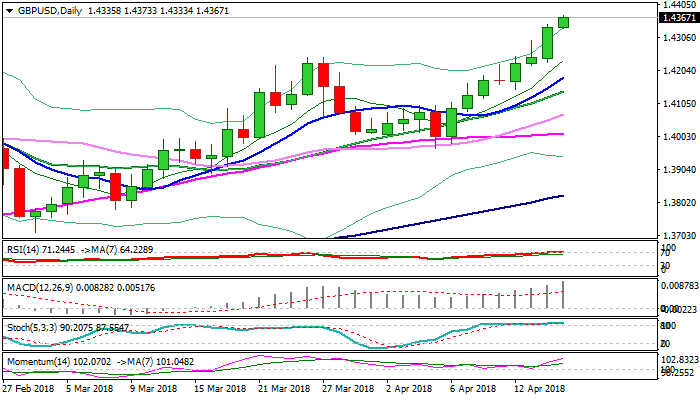
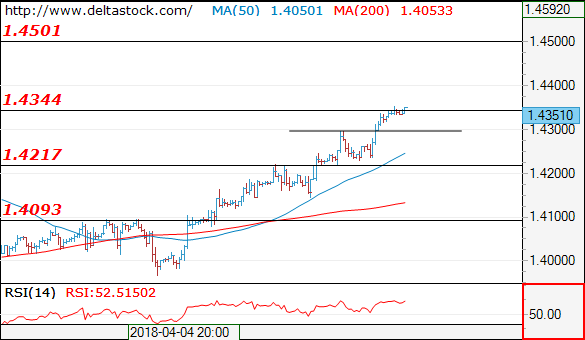
GBPUSD Hits New 2018 High And Could Extend Rally If UK Jobs Data Beat Forecasts
Cable continues to trend higher and hit new post-Brexit recovery high at 1.4369 on Tuesday as extension of Monday's strong rally broke above previous 2018 high at 1.2344 (25 Jan).
Pound remains supported on rising expectations of BoE's rate hike next month and could extend rally after triggering stops above 1.4344.
Immediate focus turns at psychological 1.4400 barrier, but bulls could stretch further and test target at 1.4508 (FE 100% of the wave C from 1.3965).
Daily techs are in full bullish setup and supportive, but overbought RSI and slow stochastic warn of pullback.
Corrective easing would offer better buying opportunities, with solid support at 1.4244 (former highs of 26/27 Mar) and rising 10SMA (1.4181) expected to contain extended dips.
UK jobs data are the key event today and could provide fresh boost for the pound on better than expected outcome. Focus is on average earnings (Feb f/c 3.0% vs 2.8% in March) and release at / above forecasted level would be supportive.
UK unemployment rate is expected to remain unchanged at 4.3% while jobless claims are expected to rise in March (13.3K f/c vs 9.2K in Feb.
Res: 1.4380, 1.4400, 1.4450, 1.4508
Sup: 1.4344, 1.4277, 1.4244, 1.4181
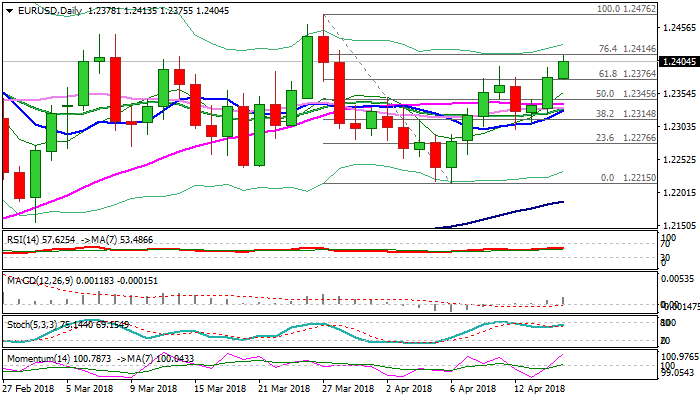
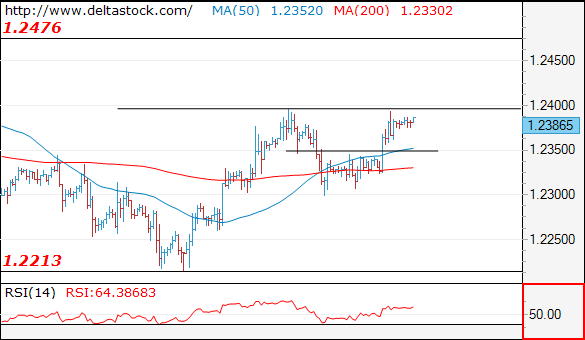
EURUSD – Bulls Extend Above 1.24 Barrier Ahead Of German ZEW Data
The Euro probes above 1.24 barrier on Tuesday and hit new three-week highs in extension of bull-leg from 1.2299 (12 Apr trough).
Bullish signal was generated on Monday’s close above 1.2377 pivot (Fibo 61.8% of 1.2476/1.2215 descend) and fresh acceleration higher cracked next barrier at 1.2414 (Fibo 76.4%).
Bulls eye 20-D upper Bollinger band at 1.2431, with key near-term barrier at 1.2476 (27 Mar high) coming in focus.
Fresh bullish momentum is building and supporting the advance, along bullishly aligned daily MA’s (rising 10SMA is attempting to form double bull-cross through converged 20/30SMA’s).
German ZEW data are eyed for fresh signals (Apr economic sentiment f/c is at -0.8% vs 5.1% in Mar).
Broken Fibo barrier at 1.2377 marks initial support, guarding a cluster of daily MA’s at 1.2330 zone, which reinforce key support provided by daily cloud top.
Res: 1.2431, 1.2446, 1.2476, 1.2500
Sup: 1.2396, 1.2377, 1.2345, 1.2330
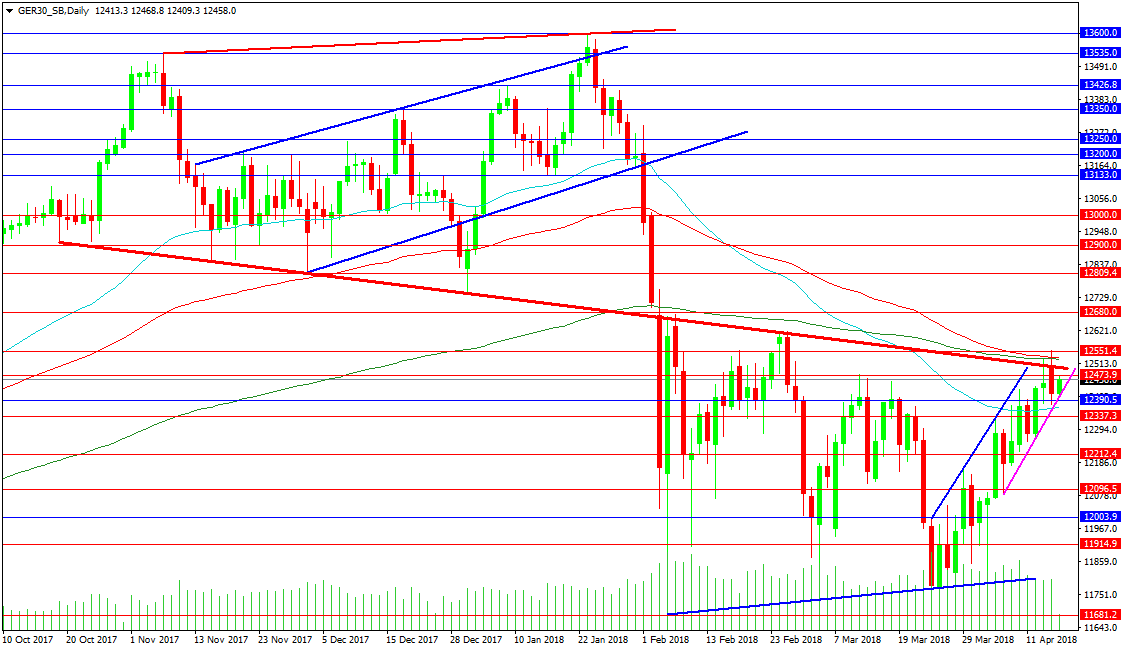
Forex Analysis: GER30 And AUDUSD
The German index has moved higher to test the falling red trend line at 12500.00 but failed to stay above the level, after running into strong resistance at 12550.00. The bullish channel that price has been trading within has held, and the index is now moving higher again towards 12500.00. A sustained break above 12550.00 would squeeze bearish positions and entice bulls to re-engage with the market, with targets at 12680.0 and 12809.40. A break above those levels targets 12900.00 and 13000.00, followed by previous support at 13133.00. A move above this level would put the high of 13600.00 in view.
Support can be seen at the 12390.00 level, followed by the 50 DMA at 12367.20. A loss here would potentially hand control back to bears, with nearby targets at 12212.40 and 12096.50, followed by 12000.00. A break below that level could be interesting, as bulls have re-entered the market between there and the 11681.20 level. However, a loss of the rising support trend line at 11810.00 could force some bulls to liquidate their long trades, sending price lower.
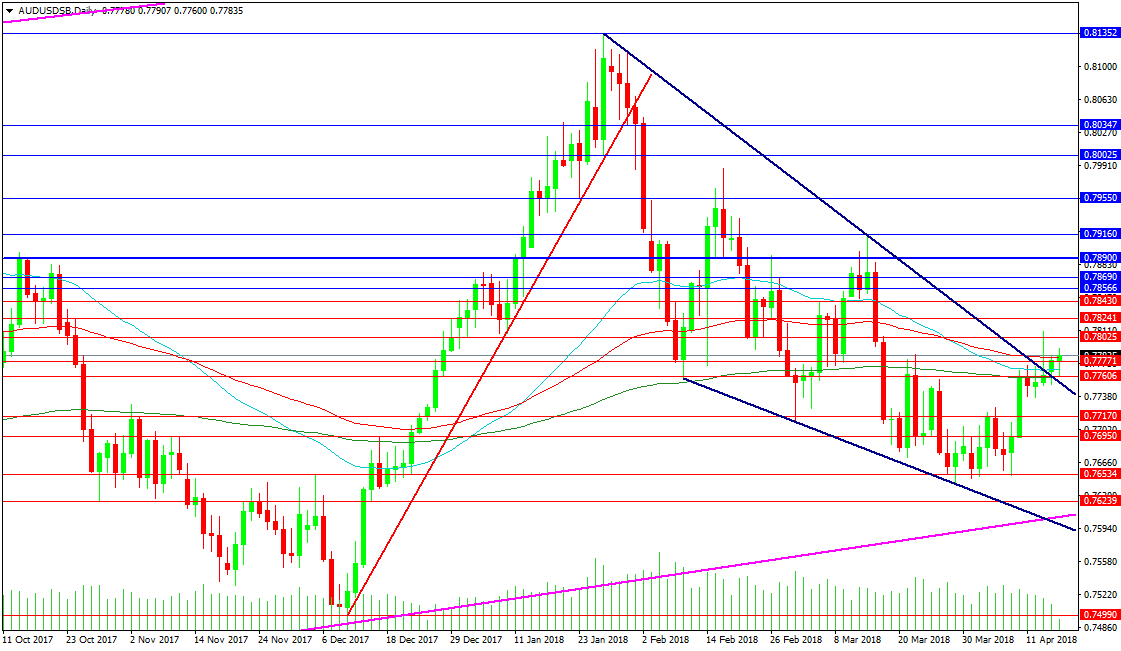
AUDUSD
The RBA released its Meeting Minutes overnight, striking a cautious tone. Also released were Chinese data showing a slight cooling in economic strength. The other driver in this pair is the prevailing USD weakness. This has led to a weak break out above the blue resistance trend line over the last couple of days. The moving averages are clustered around the trend line, which has slowed the breakout. The descending wedge pattern illustrated on the chart below is usually seen as a continuation pattern, which in this case reinforces the upward trend. A break above 0.78000 is now needed to drive the price higher and take out Friday’s high. This would put the 0.78900 level in focus, followed by 0.79550 and 0.80000. Should the pair continue to trend higher, it would target 0.80350 and the high at 0.81352.
Support is located at the broken trend line at 0.77533 today, with the 0.77170 level below. The area around 0.76534 has found buyers in the past and is a key area of support. A loss of that area would target the 0.76000 zone, followed by the previous low around 0.75000.
UK Wages And Unemployment Data Under Focus | S&P Back In Green
The Chinese economy expanded 6.8 percent
Concerns over the geological situation have eased off
The dollar index is still under pressure
Sterling has hit 1.4346 against the dollar, the highest level seen since Brexit June 2016
Traders have paid close attention to the Chinese economic data and the reaction has been mostly positive. The Chinese economy expanded 6.8 percent during the first quarter of 2018. Of course, the reason behind the optimism in the markets is because the Chinese GDP number came ahead of the forecast of 6.7%. There was some disappointment in the fixed asset investment growth number because that number fell well short of expectations. The reading was 7.5% while the forecast was 7.6% over the first quarter of 2018.
Back in the US, concerns over the geological situation have eased off and this pushed the S&P500 back into the positive territory. Investors are going to pick up the momentum where they left off yesterday and the focus will remain on the earning season.
In the currency market, the dollar index is still under pressure, thanks to the Trump's tweet which has made many speculators nervous because the word trade war has still its presence but just in another context. President Trump tweeted yesterday that both China and Russia are being unfair and devaluing their currency. This is enough of a clue for currency traders that something big could also take place for the dollar index given the nature of the President. Although, the reality paints a different picture; the Russian Ruble has sunk purely because of the sanctions and the Chinese Yuan has in fact strengthed to a level which is not seen October 2015.
Having said all this, the currency which deserves the most attention is the British pound. It has hit 1.4346 against the dollar, the highest level seen since Brexit June 2016. Traders have pushed the currency higher ahead of the important upcoming wages and unemployment data, perhaps there is a real optimism amidst them. We do think it is a bold move because most of the bets are based on the hopes that the health of the job market would permit the Bank of England to adopt a more aggressive stance towards their monetary policy. If the numbers do show that the wage data has the ability to outperform the strength in the inflation, it would firm the bullish bets on Sterling.
Forex Technical Analysis: EUR/USD, USD/JPY, GBP/USD
EUR/USD
Current level - 1.2386
Yesterday's break through 1.2350 resistance signals a positive bias and the outlook is bullish, for a rise through the 1.2395 peak, towards 1.2470 area, en route to 1.2560 weekly high. Initial support lies at 1.2350.
| Resistance | Support | ||
| intraday | intraweek | intraday | intraweek |
| 1.2395 | 1.2560 | 1.2350 | 1.2160 |
| 1.2470 | 1.2560 | 1.2300 | 1.2090 |
 USD/JPY
Current level - 107.00
The slide from 107.77 is still intact and a break through 106.60 will signal a reversal of the whole rebound above 104.60 and will target the mentioned low. Initial resistance lies at 107.15.
| Resistance | Support | ||
| intraday | intraweek | intraday | intraweek |
| 107.15 | 108.30 | 106.60 | 105.20 |
| 107.80 | 110.40 | 105.60 | 104.60 |
 GBP/USD
Current level - 1..4351
The failure at 1.4217 led to renewal of the uptrend and the pair is currently breaking through 1.4340 hurdle. The bias is positive, for a rise towards 1.4501, en route to 1.4770. Initial support is projected at 1.4295 and crucial on the downside is 1.4230.
| Resistance | Support | ||
| intraday | intraweek | intraday | intraweek |
| 1.4400 | 1.4501 | 1.4300 | 1.4090 |
| 1.4501 | 1.4770 | 1.4230 | 1.3960 |
GBPUSD Stands Around 22-Month High, Strongly Bullish
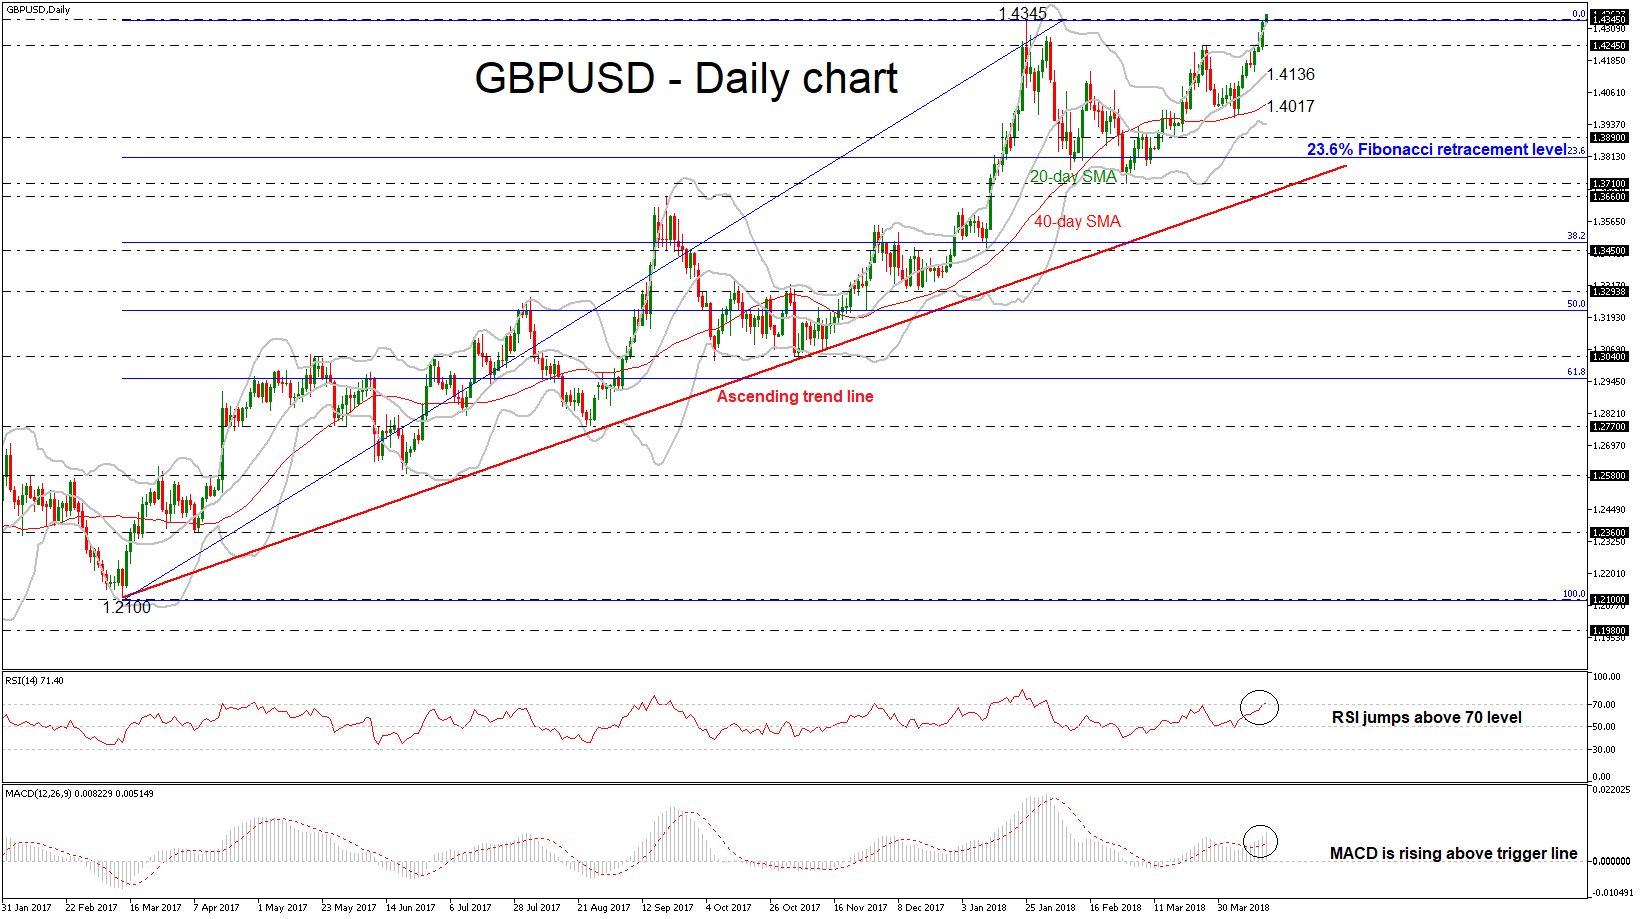
GBPUSD was one of the best-performing currencies on Monday, which raced above the 1.4300 handle, extending a rally that has not created a retracement in the past seven trading days. The cable reached a fresh 22-month high of 1.4362 during today’s Asian session, signaling that the pair is ready for a bullish run and point to more strength in the market.
In the daily timeframe, prices rebounded off the mid-level of the Bollinger band (20-day SMA) and the 40-day simple moving average (SMA) and extended their rally, and based on the technical indicators, momentum is to too strong to provide a sustained move higher. The RSI indicator is approaching the overbought zone and is touching the 70 level, while the MACD oscillator is holding above its red-trigger line.
If price action remains above the 1.4345 (immediate support), taken from the high on January 25, there is scope to test the 50.0% Fibonacci retracement level of 1.4575 of the significant downward movement on the weekly timeframe from 1.7180 to 1.1980. Clearing this key level would see additional gains towards 1.4770. This is considered to be a strong resistance area which has been tested a few times in the past.
If the price falls below the 1.4345 – 1.4245 support zone, then the focus would shift to the downside towards the 20- and 40-SMAs at 1.4136 and 1.4017 respectively. In case of a successful drop below these levels, it could open the door for the 1.3890 support followed by the 23.6% Fibonacci mark of 1.3815 of the upleg from 1.2100 to 1.4345 could act as critical support.