Sample Category Title
EUR/JPY Daily Outlook
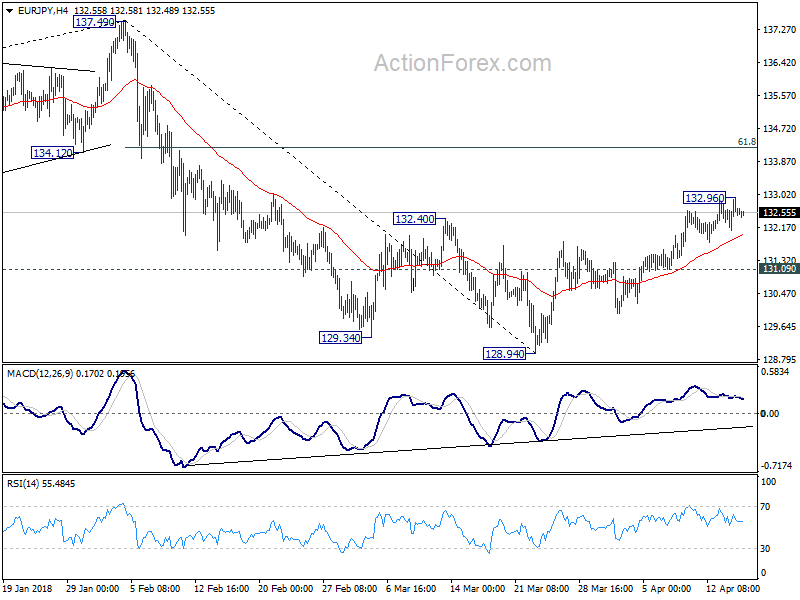
Daily Pivots: (S1) 132.14; (P) 132.56; (R1) 133.00; More....
EUR/JPY edged higher to 132.96 but upside momentum is unconvincing as seen in 4 hour MACD. Intraday bias stays neutral first. In case of another retreat, downside should be contained by 131.09 minor support to bring rebound resumption. Above 132.96 will extend the rebound from 128.94 to 61.8% retracement of 137.49 to 128.94 at 134.22 and above. On the downside, below 131.09 will indicate that the rebound is completed and bring retest of 128.94 low instead.
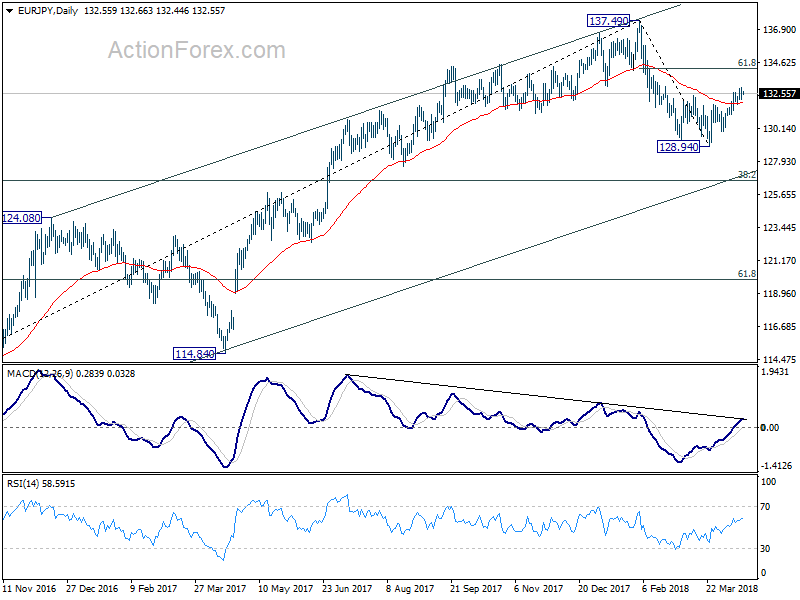
 In the bigger picture, price action from 137.49 medium term top are developing into a corrective pattern. Strong support from 55 week EMA (now at 129.91) suggests that the first leg has completed at 128.94 already. Nonetheless, break of 137.49 is needed to confirm resumption of the rise from 109.03 (2016 low). Otherwise, we'd expect more corrective range trading, with risk of another fall to 38.2% retracement of 109.03 to 137.49 at 126.61 before completion.
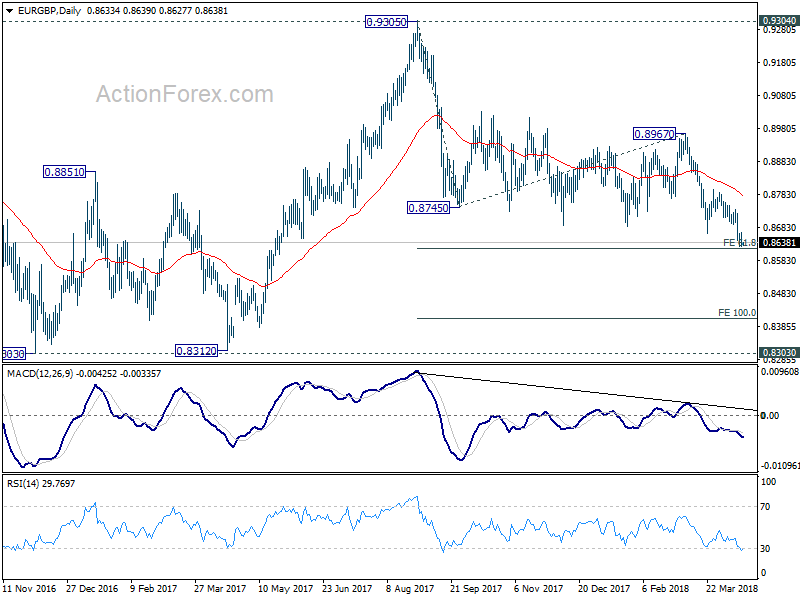
EUR/GBP Daily Outlook
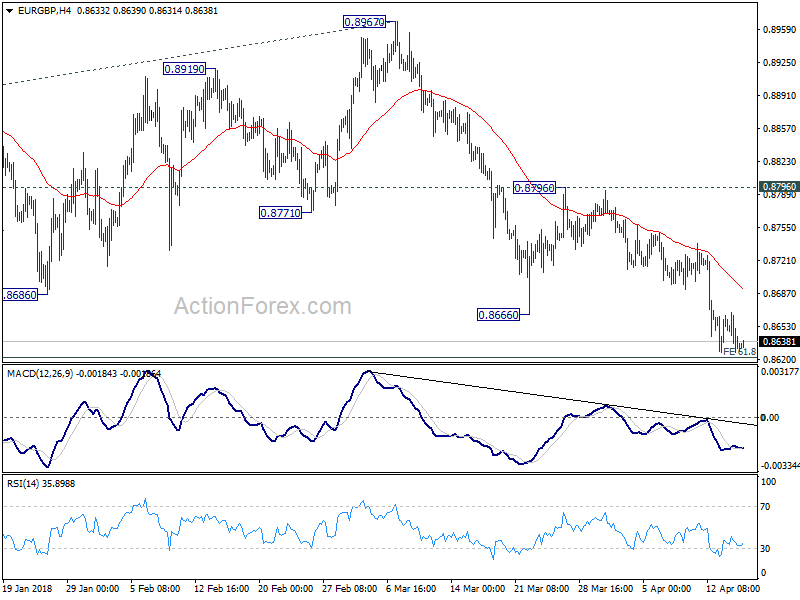
Daily Pivots: (S1) 0.8617; (P) 0.8643; (R1) 0.8658; More...
Intraday bias in EUR/GBP remain neutral and more consolidations could be seen. Another recovery cannot be ruled out. But upside should be well below 0.8796 resistance to bring fall resumption. Break of 61.8% projection of 0.9305 to 0.8745 from 0.8967 at 0.8621 will pave the way to 100% projection at 0.8407.
 In the bigger picture, there are various ways to interpret price actions from 0.9304 high. But after all, firm break of 0.9304/5 is needed to confirm up trend resumption. Otherwise, range trading will continue with risk of deeper fall. And in that case, EUR/GBP could have a retest on 0.8303. But we'd expect strong support from 0.8116 cluster support (50% retracement of 0.6935 to 0.9304 at 0.8120) to contain downside.
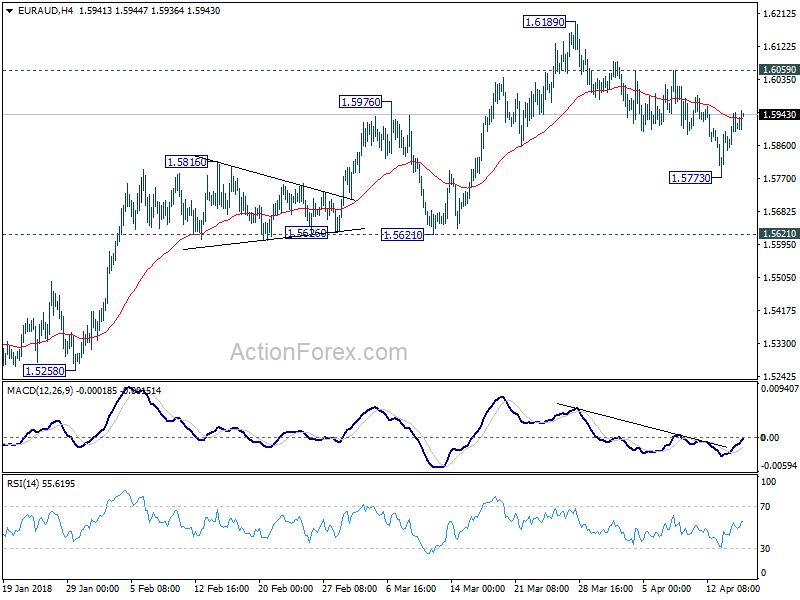
EUR/AUD Daily Outlook
Daily Pivots: (S1) 1.5854; (P) 1.5901; (R1) 1.5953; More....
At this point, intraday bias in EUR/AUD remains neutral. We'd expect upside of recovery to be limited below 1.6055 minor resistance to bring another fall. Break of 1.5773 will target 1.5621 support first. Decisive break there will be another indication of medium term trend reversal. However, break of 1.6059 will turn focus back to 1.6189 high instead.
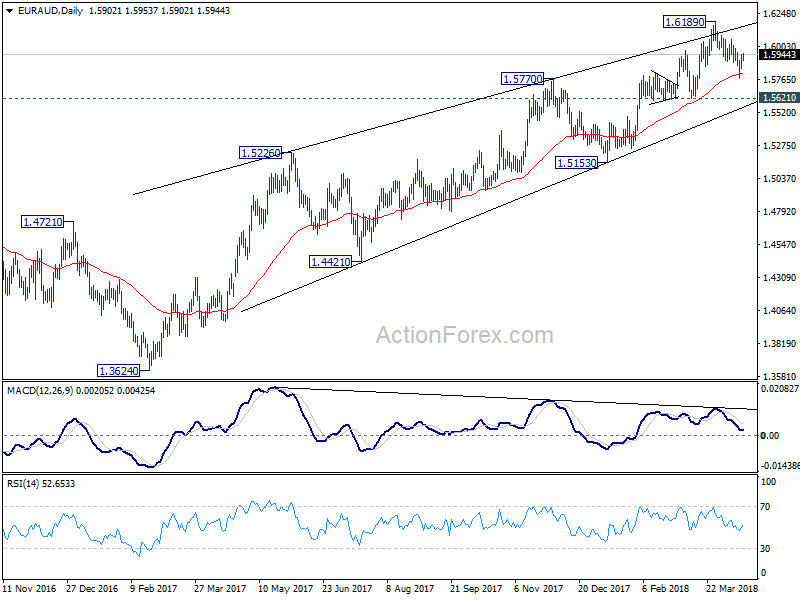
 In the bigger picture, the case for medium term reversal is building up in EUR/AUD. Bearish divergence condition in daily MACD indicates further loss of upside momentum ahead of 1.6587 key resistance (2015 high). Break of 1.5621 should confirm medium term topping and bring deeper fall back to 1.5153 and possibly below. Meanwhile, even in case of up trend resumption, we'd be cautious on strong resistance from 1.6587 to limit upside and bring reversal.
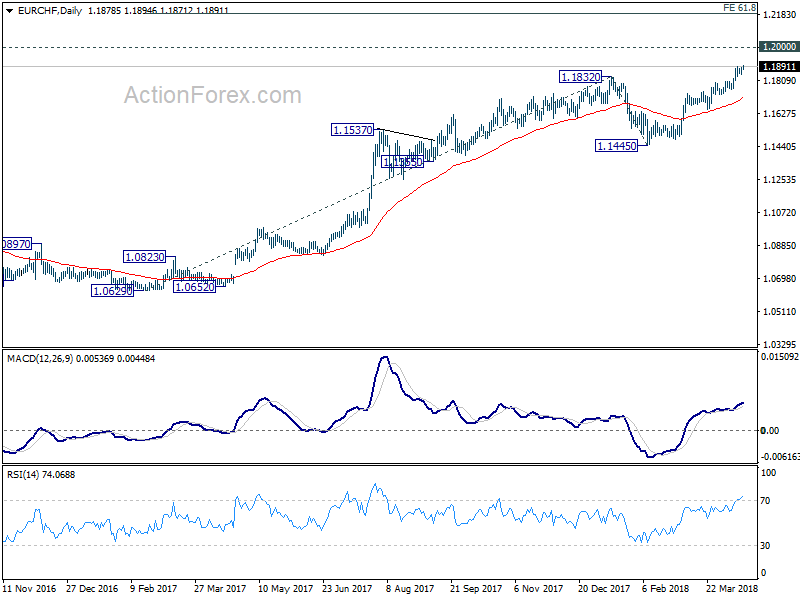
EUR/CHF Daily Outlook
Daily Pivots: (S1) 1.1861; (P) 1.1873; (R1) 1.1892; More...
EUR/CHF's rally resumed after brief consolidation and reaches as high as 1.1894 so far. Intraday bias is back on the upside for 1.2 handle. Break there will extend the medium term up trend to 61.8% projection of 1.0629 to 1.1832 from 1.1445 at 1.2188. On the downside, below 1.1847 minor support will turn intraday bias neutral and bring consolidation, below staging another rally.
 In the bigger picture, decisive break of 1.1832 should now extend the medium term up trend through prior SNB imposed floor at 1.2000. 2013 high at 1.2649 should be the next target. Outlook will remain bullish as long as 1.1445 support holds, even in case of deep pull back.
China’s March Data Distorted by Holiday and Weather Effects
China’s macroeconomic data showed a mixed picture in March.
Growth in industrial production (IP) eased to +6% y/y, compared with consensus of +6.9% and January- February’s +7.2%. The inflation report released last week also showed that headline CPI slowed markedly to +2.1% y/y in March, from February’s +2.9%. Urban fixed asset investment (FAI) grew +7.5% y/y in the first three months of the year, missing consensus of +7.7%. Expansion, slowing from +7.9% in the first two months of the year, continued to the downtrend as the authority implemented deleveraging measures.
Separately, retail sales expanded +10.1% y/y in March, better than consensus of, and January- February’s, +9.7%.
 On the other hand, GDP growth steadied at +6.8% in 1Q18, in line with expectations.
 We believe seasonal factor – Lunar New Year in the second half of February, was the key reason for the mixed picture in March. More evidence in April and May are need to determine whether Chinese economic growth would slow this year.
The following explains how seasonal and temporary factors might have distorted China’s IP and CPI data:
The disappointing headline IP growth was probably driven by two factors. First, production in January and February was driven by higher heating demand amidst cold weather. Meanwhile, cold weather accompanied with strong wind created less pollution so that the government eased restrictions on factory works. As such weather conditions dissipated in March, production declined as a result of less demand and more stringent measures by the government.
Lunar New Year this year occurred in the second half of February. Due to the conventional practice that Chinese factories extend the holiday after (rather than before) the public holidays, suspension of production was seen in early March.
 Headline CPI fell to +2.1% y/y in March, after spiking to +2.9% in the prior month. For the first quarter as a whole, CPI inflation improved to +2.2% y/y from +1.8% in 4Q17. Look at the details in March, food prices increased +2.1% y/y, easing significantly from +4.4%. The slowdown was a result of the Lunar New Year holiday effects which lifted food prices in February.
Key components in the food baskets showed moderation in price increase. For instance, vegetable prices grew +8.8% y/y in March, decelerating markedly from +17.7% in February, while inflation in eggs and aquatic products slowed to +17.6% and +5.6%, from +22.5% and +8.7% in February, respectively. Pork price deflation continued.
This might facilitate China to go ahead with tariff on US soybean exports, though. Non-food CPI eased to +2.1% y/y from 2.5% in February. Core inflation decelerated to 2% y/y from 2.5% in February. The strong reading in February was mainly a result of tourism expenses which expanded +13.5% during Lunar New Year holiday.
 The Chinese government maintains its growth target at “about +6.5%” for 2018. While we still expect growth to meet target, we do not feel surprised if it comes in weaker than +6.9% in 2017 as the authority would keep up the efforts of deleveraging and dealing with pollution. Meanwhile, US-China trade tensions have inevitably raised uncertainty in the growth outlook.
AUD/USD Daily Outlook
Daily Pivots: (S1) 0.7761; (P) 0.7772; (R1) 0.7792; More...
AUD/USD is staying in range of 0.7725/7809 and intraday bias remains neutral. Further rise is mildly in favor with 0.7725 minor support intact. Above 0.7809 will target 0.7915 resistance first. Break there will confirm that whole decline from 0.8135 has completed. However, below 0.7725 will bring retest of 0.7642 low instead.
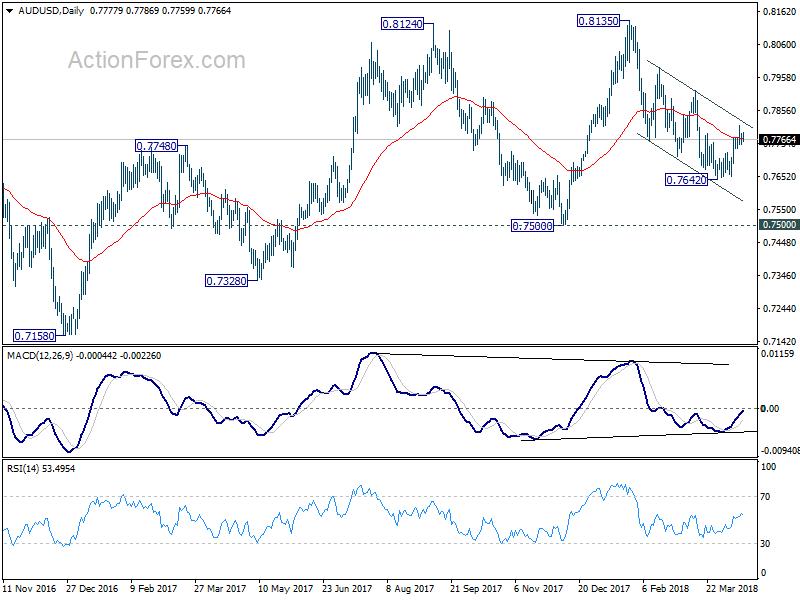
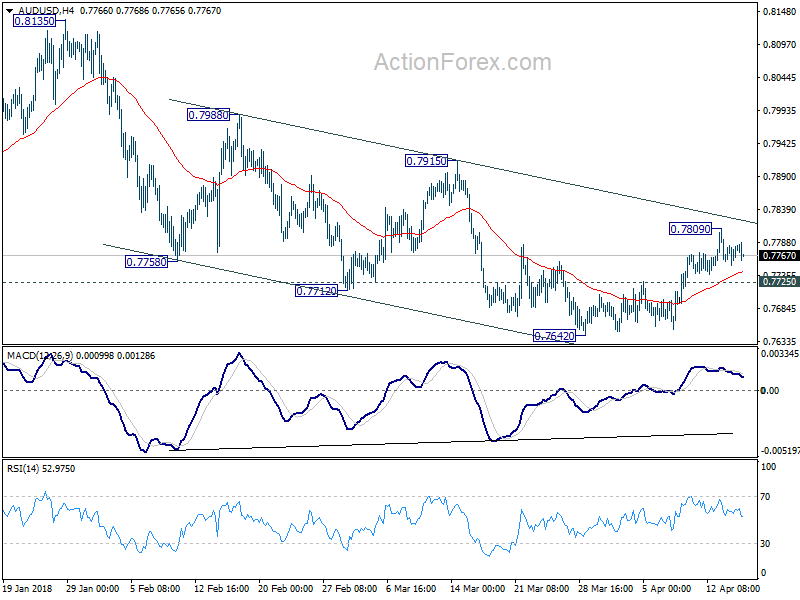 In the bigger picture, medium term rebound from 0.6826 is seen as a corrective move. It might still extend higher but we'd expect strong resistance from 38.2% retracement of 1.1079 to 0.6826 at 0.8451 to limit upside to bring long term down trend resumption. On the downside, break of 0.7500 support will now be an important signal that such corrective rebound is completed. In that case, AUD/USD would be heading back to 0.6826 low in medium term.
USD/CAD Daily Outlook
Daily Pivots: (S1) 1.2544; (P) 1.2584; (R1) 1.2603; More....
USD/CAD is staying in consolidation above 1.2544 temporary low. Intraday bias remains neutral first. In case of another recovery, upside should be limited by 1.2730 minor resistance to bring another fall. On the downside, break of 1.2544 will extend the decline from 1.3124 and target 1.2061/2246 support zone.
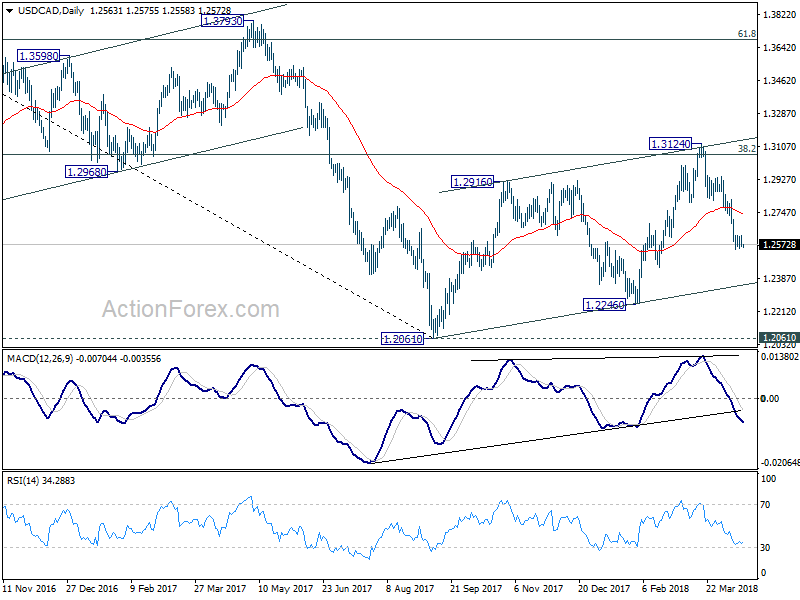
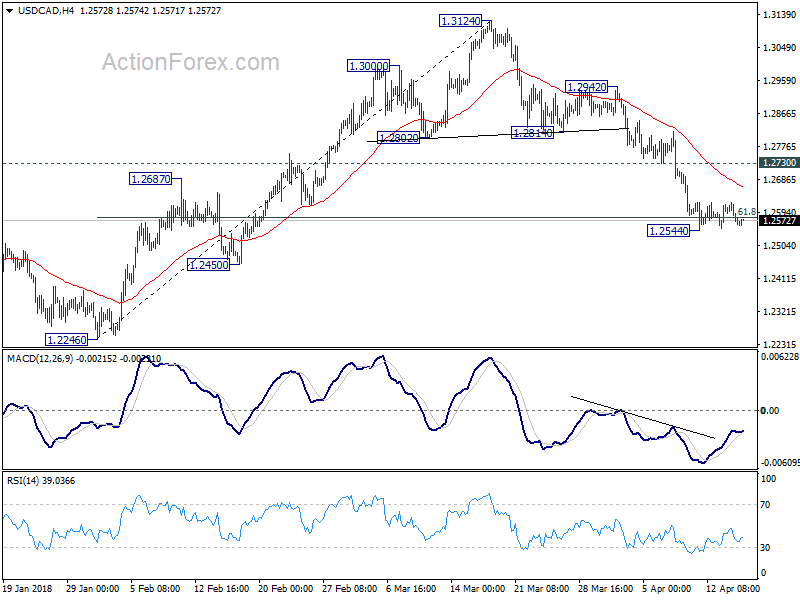 In the bigger picture, current development turns favors to the case that rise from 1.2061 is a corrective three wave pattern. It could have completed at 1.3124 after hitting 38.2% retracement of 1.4689 to 1.2061 at 1.3065. Focus is now back on 1.2061 and 50% retracement of 0.9406 (2011 low) to 1.4689 (2015 high) at 1.2048. Decisive break there will resume larger down trend from 1.4689 (2016 high) to 61.8% retracement of 0.9406 to 1.4689 at 1.1424.
Officials Upbeat On Economy, But See No Strong Case For Near-Term Rate Hike: RBA Minutes
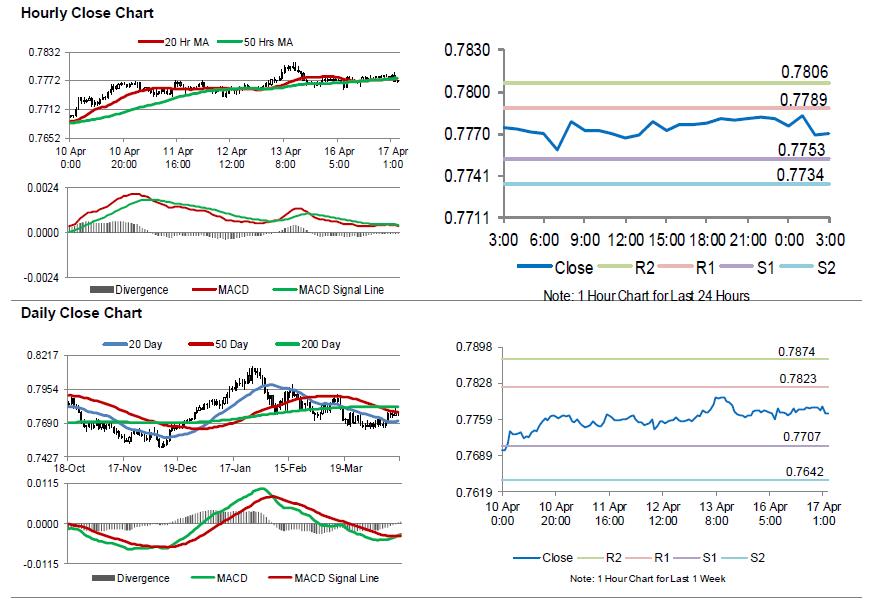
For the 24 hours to 23:00 GMT, the AUD rose 0.12% against the USD and closed at 0.7781.
LME Copper prices declined 0.27% or $18.5/MT to $6811.5/MT. Aluminium prices rose 1.44% or $33.5/MT to $2358.5/MT.
In the Asian session, at GMT0300, the pair is trading at 0.7771, with the AUD trading 0.13% lower against the USD from yesterday's close.
The minutes of the Reserve Bank of Australia's (RBA) April monetary policy meeting showed that policymakers are in no rush for a near-term move in monetary policy, as inflation is likely to remain subdued in the face of sluggish wage growth. Nevertheless, the minutes indicated that next move in interest rates was more likely to be up, as officials expect the Australian economic growth to “exceed potential” in the near-term.
Elsewhere in China, Australia's largest trading partner, gross domestic product (GDP) climbed 6.8% on an annual basis in the first three months of 2018, at par with market expectations, driven by robust consumer spending. In the prior quarter, GDP had registered a similar rise. Moreover, the nation's retail sales grew more-than-expected by 10.1% YoY in March, compared to an advance of 9.4% in the prior month, while markets were expecting for a gain of 9.7%. Meanwhile, the nation's industrial production advanced 6.0% on an annual basis in March, undershooting market expectations for a rise of 6.3%. Industrial production had risen 6.2% in the previous month.
The pair is expected to find support at 0.7753, and a fall through could take it to the next support level of 0.7734. The pair is expected to find its first resistance at 0.7789, and a rise through could take it to the next resistance level of 0.7806.
Looking ahead, Australia's Westpac leading index for March, set to release overnight, will be on investors' radar.
The currency pair is showing convergence with its 20 Hr and 50 Hr moving averages.
Euro Trading Flat, Ahead Of The ZEW Economic Sentiment Survey Across The Euro-Zone
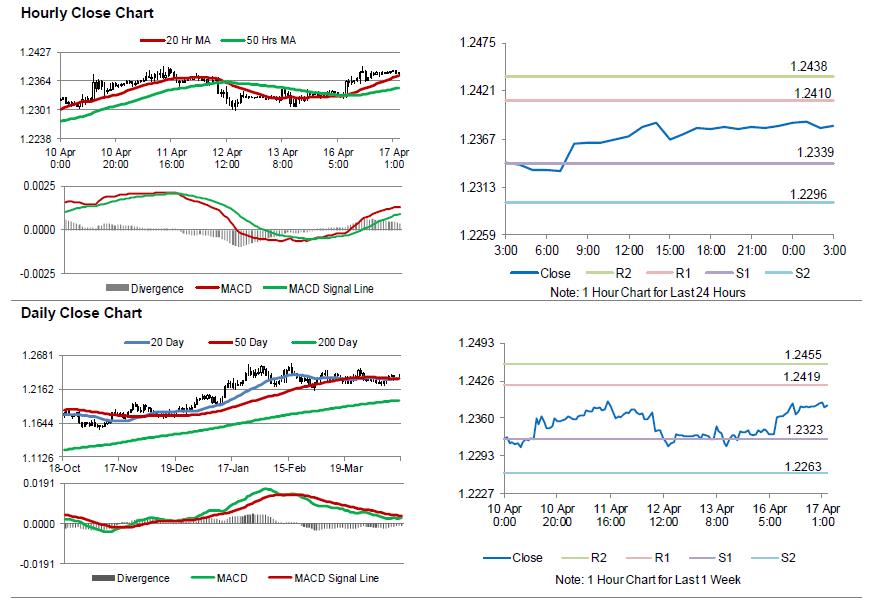
For the 24 hours to 23:00 GMT, the EUR rose 0.39% against the USD and closed at 1.2382.
The US Dollar declined against its major counterparts, amid renewed geopolitical tensions after the US President, Donald Trump, accused Russia and China of playing the currency devaluation game in order to gain unfair trade advantages.
On the economic front, data indicated that advance retail sales in the US rebounded more-than-anticipated by 0.6% on a monthly basis in March, rising for the first time in 4 months, thus easing concerns that consumer spending, a key driver of economic growth, could act as a drag on the world’s largest economy in the first quarter of 2018. In the prior month, advance retail sales had recorded a drop of 0.1%, while investors had envisaged for an advance of 0.4%. Additionally, the nation’s business inventories climbed 0.6% on a monthly basis in February, meeting market expectations and compared to a similar rise in the prior month.
On the other hand, the US NAHB housing market index recorded an unexpected drop to a level of 69.0 in April, deteriorating for the fourth consecutive month and confounding market consensus for the index to remain steady at a level of 70.0. Further, the nation’s New York Empire State manufacturing index declined to a level of 15.8 in April, after recording a reading of 22.5 in the previous month. Market participants had expected the index to drop to a level of 18.4.
In the Asian session, at GMT0300, the pair is trading at 1.2382, with the EUR trading flat against the USD from yesterday’s close.
The pair is expected to find support at 1.2339, and a fall through could take it to the next support level of 1.2296. The pair is expected to find its first resistance at 1.2410, and a rise through could take it to the next resistance level of 1.2438.
Ahead in the day, traders would keep a close watch on the ZEW economic sentiment survey data, scheduled to release across the Euro-zone in a few hours. Moreover, the US housing starts, building permits, industrial as well as manufacturing production data, all for March, slated to release later today, will keep investors on their toes.
The currency pair is showing convergence with its 20 Hr moving average and trading above its 50 Hr moving average.
Pound Trading A Tad Higher, Ahead Of UK’s ILO Unemployment Rate Data
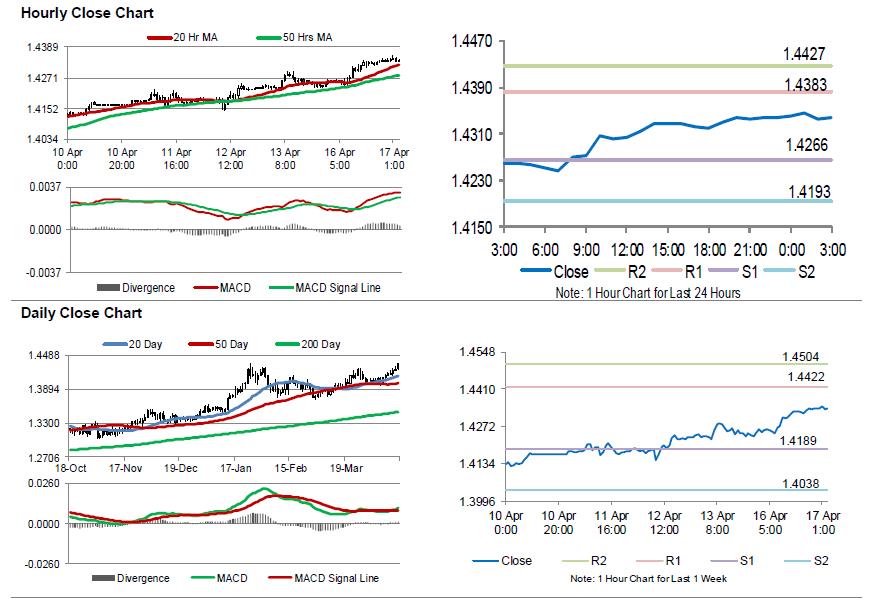
For the 24 hours to 23:00 GMT, the GBP rose 0.60% against the USD and closed at 1.4338, ahead of UK's post-Brexit trade negotiations with the EU starting this week.
In the Asian session, at GMT0300, the pair is trading at 1.4339, with the GBP trading slightly higher against the USD from yesterday's close.
The pair is expected to find support at 1.4266, and a fall through could take it to the next support level of 1.4193. The pair is expected to find its first resistance at 1.4383, and a rise through could take it to the next resistance level of 1.4427.
Trading trend in the Pound today is expected to be determined by the release of UK's ILO unemployment rate data for the three months to February, due to release in a few hours.
The currency pair is trading above its 20 Hr and 50 Hr moving averages.