

Sample Category Title
EU 50 Stock Index Builds Base around 7-Week High; Sideways Channel in Near Term
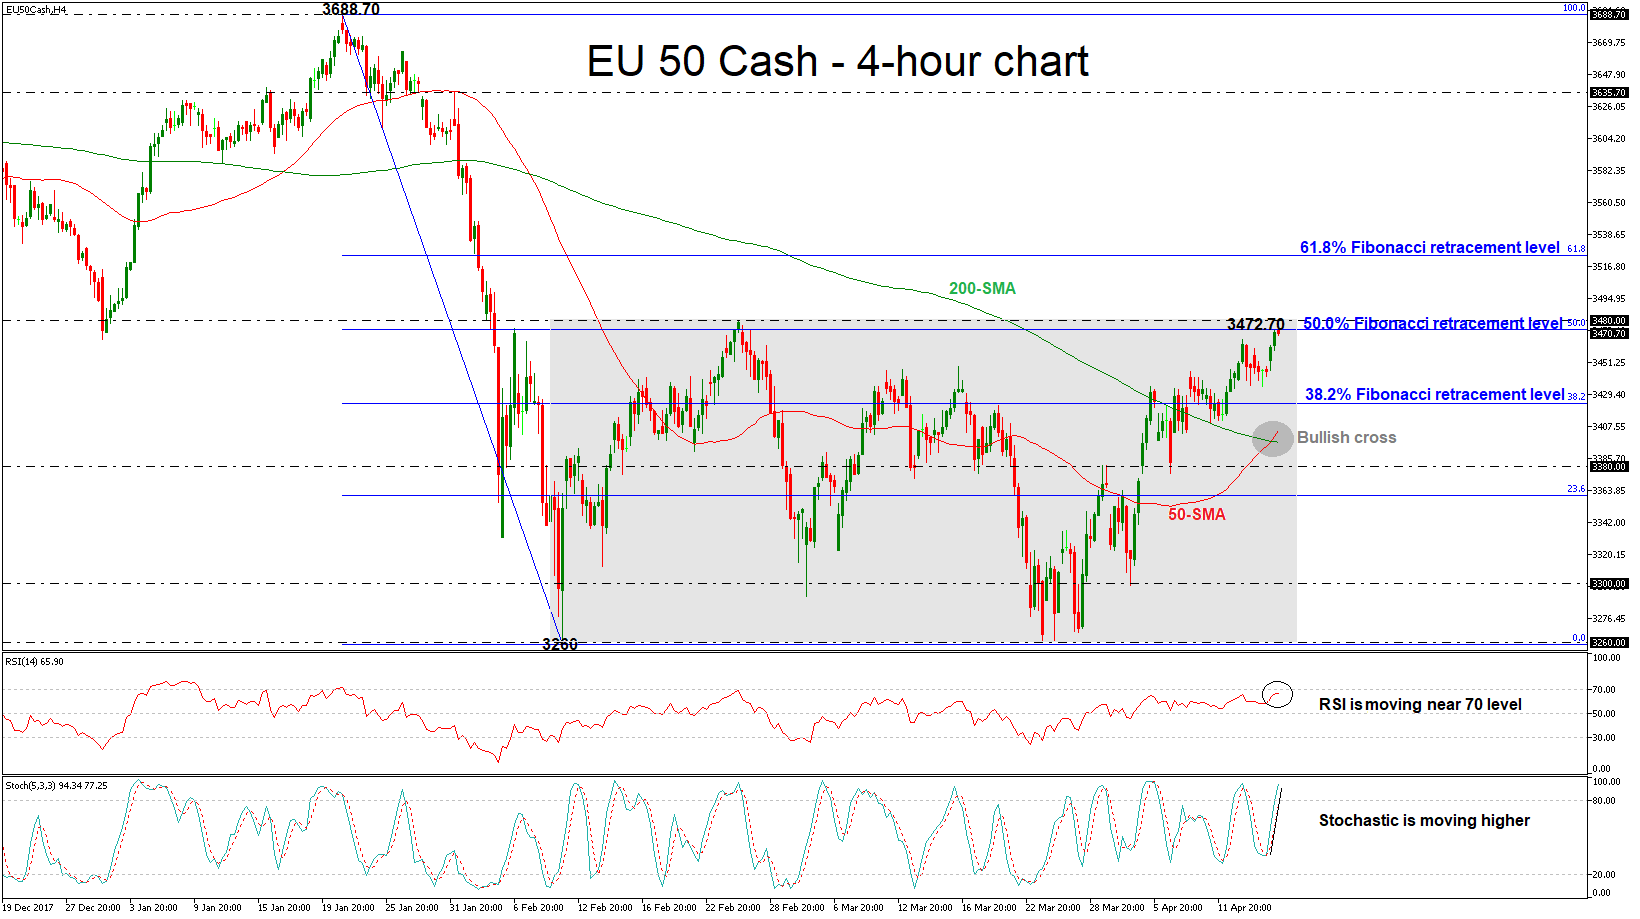
EU 50 stock index has advanced considerably since roughly the end of March, hitting a seven-week high during Tuesday’s session. Price action is at the moment taking place not far below this peak. The index is developing within a trading range the last couple of months with upper boundary the 3472.70 resistance and lower boundary the 3260 support. The technical picture supports that the bullish run remains in the near-term as both are holding in the positive zone.
Looking at momentum indicators, the RSI indicator is moving near the overbought level, while it is flattening. Also, the stochastic oscillator is heading higher and the %K line is moving well above its %D line, signaling further gains in the 4-hour chart. It is worth mentioning that in the medium-term, the 50-simple moving average (SMA) posted a bullish cross with the 200-SMA, indicating strong buying interest.
Currently, the price is touching the 50.0% Fibonacci retracement level of 3472.70 of the downleg from 3688.70 to 3260. In the wake of positive pressures, the market could hit the next immediate resistance of 3480. A successful jump above the aforementioned zone could open the door towards the 61.8% Fibonacci near 3524.
On the flip side, a move to the downside could see support at the 38.2% Fibonacci mark of 3423. A stronger barrier, though, could be found at the bullish cross of the 50- and 200-day moving averages around 3397 at the time of writing. In case of more declines, 3380 is acting as a major support level.
EURUSD Holds in Red in Early US hours; Downbeat German ZEW Weighs
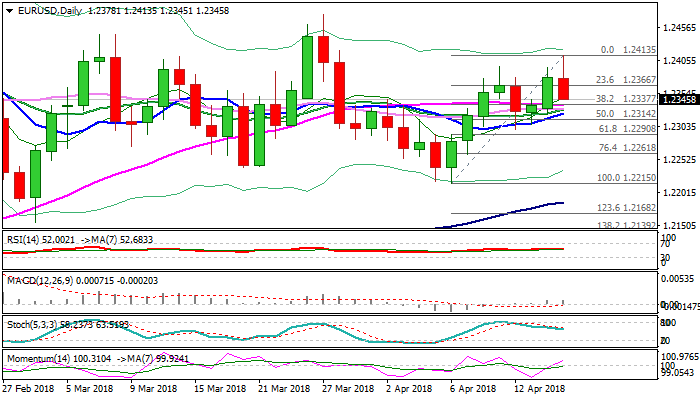
The Euro entered US session at the back foot, hitting daily low at 1.2345, in extension of weakness from the European trading, when German ZEW miss (Apr -8.2 vs -0.8 f/c, the lowest since November 2012) increased pressure on the single currency.
Probe above 1.24 barriers was so far short-lived, with return below cracked Fibo barrier at 1.2377, further weakening near-term structure.
Fresh easing pressures strong supports at 1.2330 zone (cluster of daily MA’s/daily cloud top) which is expected to hold and keep in play bulls on daily chart for fresh attempts higher.
The pair may hold in extended consolidation between cloud top and 1.2400 barrier before generating clearer direction signal.
Repeated close above 1.2377 (Fibo 61.8% of 1.2476/1.2215 bear-leg) is needed to generate fresh bullish signal for renewed probe above 1.2414 (session high / Fibo 76.4%) and final push towards key 1.2476 barrier (27 Mar high).
Bearish scenario would require break and close below daily cloud top (1.2327) to shift near-term focus lower for further retracement of 1.2215/1.2414 bull-leg.
Res: 1.2377; 1.2414; 1.2446; 1.2476
Sup: 1.2345; 1.2330; 1.2290; 1.2261
US: Strength in Multifamily Homebuilding Drives Better-than-Expected Results in Q1
The rebound in U.S. housing starts beat market expectations, up 1.9% in March to 1.319 million new homes. That came on top of upward revisions to January and February, with the level of starts over the first two months of the year 7% higher than previously reported. Permits also rebounded 2.5% in March, from a 4.1% drop in February.
The details were slightly softer than the headline suggests, with the strength coming entirely from a 14.4% pop in the volatile multifamily segment. Single-family starts were down 3.7% in March, but they are still 5.2% higher than a year ago. Multi-family housing starts have been up strongly over the past two quarters, after a period of weakness earlier in 2017.
Permits for single-family homes also fell 5.5% in March. Multifamily permits were up 19% in March, and are typically quite volatile.
Results were mixed on a regional basis. Housing starts rose in the Northeast (+0.8%) and Midwest (+22.4%), while declining in the South (-0.6%) and the West (-1.5%). Weaker homebuilding in the South and West comes after period of strength in both regions over the previous six months.
Key Implications
The stronger-than-expected result for housing starts in March was due to the multifamily segment, which has staged something of a comeback in recent months. Strength in multifamily homebuilding has been concentrated in the South and West. The drop in single-family permits is concerning, but it likely represents a bit of a breather after a stronger period in late 2017. Homebuilding outperformed our expectations for the first quarter as a whole, although it is unclear how much of this represented a pulling forward of activity due to warm weather in many parts of the country.
We expect housing starts to continue to gain ground through 2018, supported by positive fundamentals such as low unemployment and healthy wage increases, which are expected to offset higher mortgage rates. At the same time, tight inventories and rising prices will continue to support homebuilding.
But, barriers to homebuilding activity remain. These include a continued labor shortage in the construction industry and a lack of buildable lots. This may be partly behind the decline in homebuilder sentiment we have seen since December. Additionally, tax reforms that cap the state and local tax deduction and lower the mortgage interest deduction will likely shift demand to lower priced segments of the market. That won't alter the number of housing starts, but will push the market toward smaller, lower-priced options.
Autos lead a Canadian Manufacturing Sales Rebound in February
Canadian manufacturing sales roared back to life in February, up 1.9% month-on-month after a (downwardly revised) 1.3% decline in January. The gain was entirely down to volumes, which rose an impressive 2.0% in February.
Unsurprisingly, durable goods producers led the way (+3.4%, or 3.3% in volume terms), with a recovery in motor vehicle sales (+8.9%; volumes +9.3%) leading the way. This came after a roughly 8% drop January. The volatile aerospace product category also performed well, with sales up 4.2% in February (volumes: 2.5%). Rounding out the top performers was primary metals, up 4.8% on the month (volumes: 4.6%). Non-durable goods manufacturers reported a mixed month, with overall sales up just 0.3%, (volumes up 0.4%).
As one would expect, given the industry mix, Ontario led sales growth, up 3.0% in February. Quebec was not far behind, gaining 2.2%. Alberta also reported a sales gain (+0.3%), while B.C. saw a 1.3% pullback, marking a fourth straight monthly decline in manufacturing sales.
Manufacturing inventories hit a record high at $77.5 billion after climbing for a fifth straight month. Statistics Canada attributed the gain to the transportation equipment sector, as well as primary and fabricated metals. Despite this climb, sales were strong enough to bring the inventory-to-sales ratio down a tick to 1.39 (from 1.40).
Indicators of future sales were robust. Unfilled orders rose 3.0% in February on strength in aerospace (volumes: +2.1%), while new orders were up 5.0% (1.4% in volume terms – the third straight month of improvement).
Key Implications
As expected, January's softness gave way to a rebound in February, with manufacturing sales volumes up a respectable 1.9% on the month. The resolution of earlier disruptions in the auto sector helped the gain, but solid performances in other durable-goods categories helped generate a relatively broad-based gain, as 14 of 21 industries, or roughly 70% of the manufacturing sector saw sales rise in February. It was also encouraging to see continued improvement in order books.
Today's report may not be enough to materially alter our view of first quarter growth (current tracking: 1.6%), but it does help make the case that a stepped up pace of growth in the second quarter is likely. Indeed, the solid forward-looking components of the report and a healthy U.S. outlook both bode well for the manufacturing sector as the year progresses.
With February's recovery widely anticipated, it is unlikely to alter the Bank of Canada's thinking going into tomorrow's interest rate decision. Caution will likely rule the day, but with a second quarter growth surge beginning to take shape (helped as well by a still optimistic business outlook) and core inflation sitting at the 2% target, the Bank will likely set the stage for further rate hikes.
EUR/USD Mid-Day Outlook
Daily Pivots: (S1) 1.2335; (P) 1.2364 (R1) 1.2408; More....
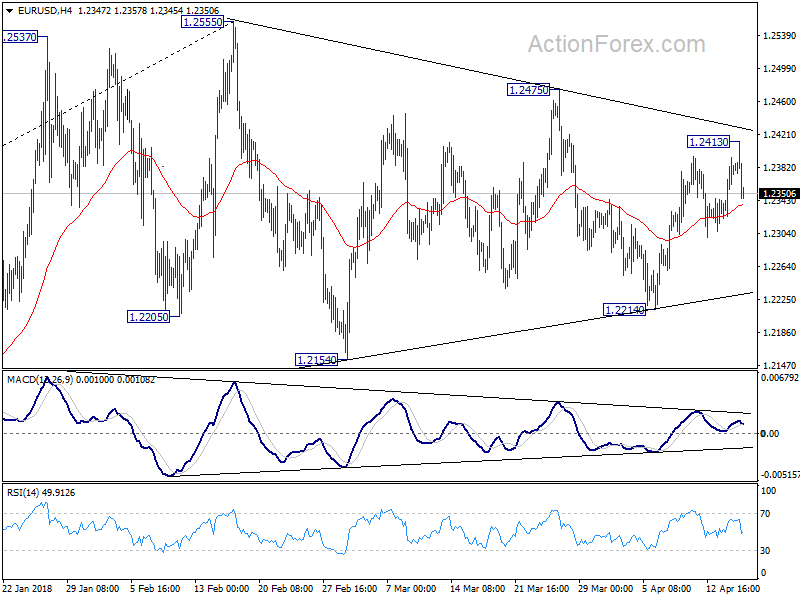
Despite edging higher to 1.2413, EUR/USD failed to break through near term trend line resistance and retreated. Intraday bias remains neutral first. On the upside, above 1.2413 will extend the rebound from 1.2214 to 1.2475 resistance. Break will target 1.2516/2555 key resistance zone. On the downside, however, break of 1.2214 will revive the case of trend reversal and turn outlook bearish.
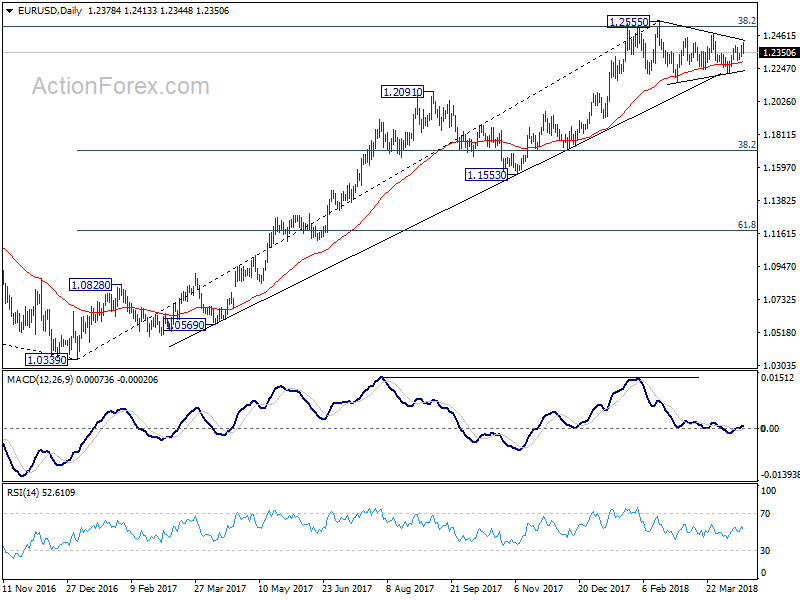
 In the bigger picture, key fibonacci level at 38.2% retracement of 1.6039 (2008 high) to 1.0339 (2017 low) at 1.2516 remains intact despite attempts to break. Hence, rise from 1.0339 medium term bottom is still seen as a corrective move for the moment. Rejection from 1.2516 will maintain long term bearish outlook and keep the case for retesting 1.0039 alive. Firm break of 1.1553 support will add more medium term bearishness. However, sustained break of 1.2516 will carry larger bullish implication and target 61.8% retracement of 1.6039 to 1.0339 at 1.3862 in medium term.
GBP/USD Mid-Day Outlook
Daily Pivots: (S1) 1.4261; (P) 1.4302; (R1) 1.4379; More...
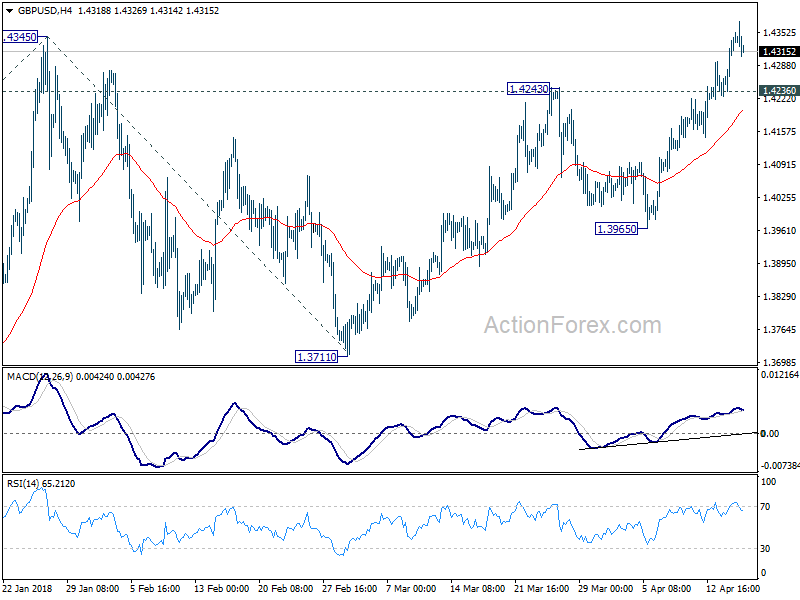
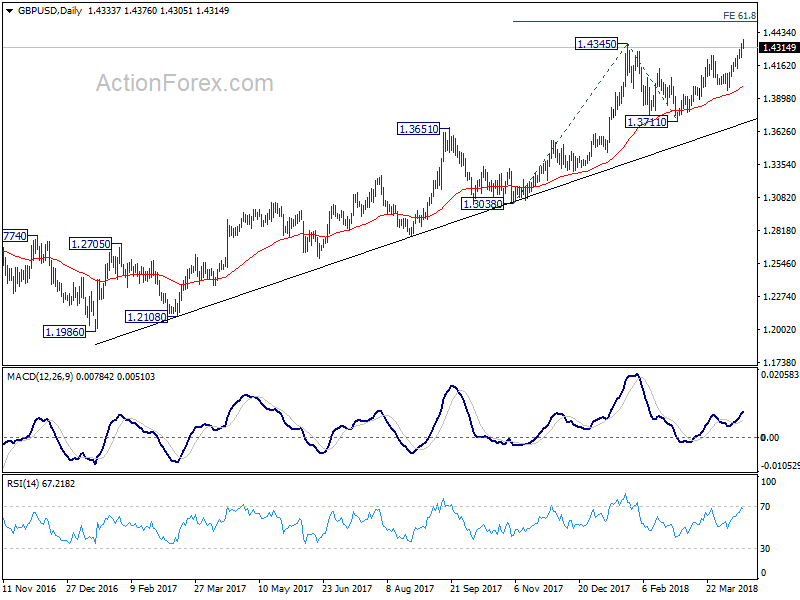
GBP/USD retreats after hitting 1.4376. But with 1.4236 minor support intact, intraday bias remains on the upside. Prior break of 1.4345 indicates resumption of medium term up trend. Further rise should be seen to 61.8% projection of 1.3038 to 1.4345 from 1.3711 at 1.4519 next. On the downside, below 1.4236 minor support will turn intraday bias neutral again. But retreat should be contained well above 1.3964 support to bring another rally.
 In the bigger picture, rise from 1.1946 (2016 low) is in progress and resuming. It is at least correcting the long term down trend from 2007 high at 2.1161. Further rally would be seen back to 38.2% retracement of 2.1161 (2007 high) to 1.1946 (2016 low) at 1.5466. We'd continue to favor this medium term bullish view as long as 1.3711 support holds, even in case of deep pull back.
USD/JPY Mid-Day Outlook
Daily Pivots: (S1) 106.89; (P) 107.24; (R1) 107.46; More...
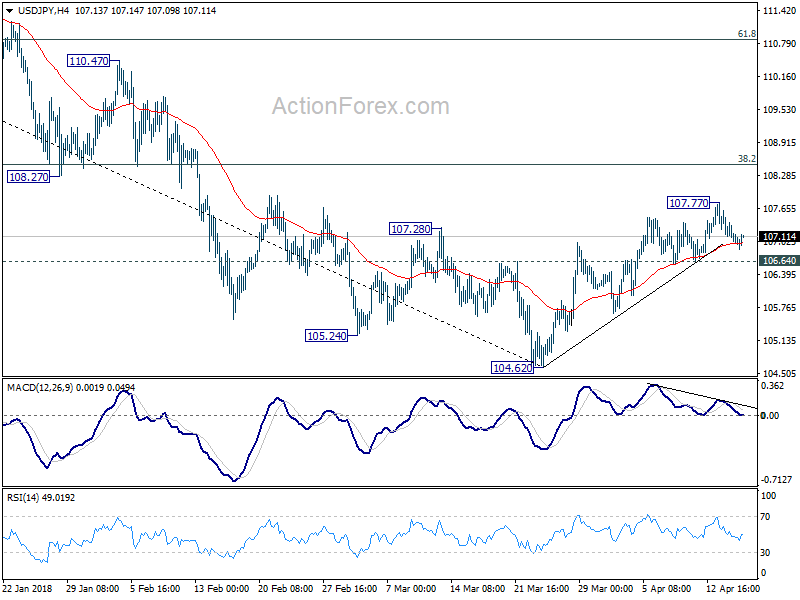
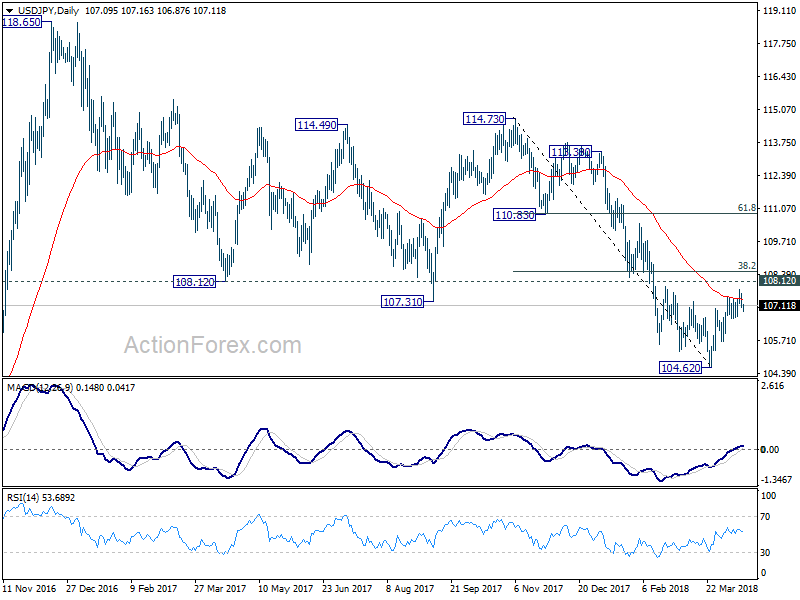
USD/JPY is staying in range of 106.64/107.77 and intraday bias remains neutral first. Another rise is mildly in favor and break of 107.77 will target 38.2% retracement of 114.73 to 104.62 at 108.48 which is close to 108.12. This level is crucial in determining the medium outlook. On the downside, break of 106.64, however, will indicate the rebound from 104.62 has completed. And in that case, bias will be turned back to the downside for retesting 104.62.
 In the bigger picture, as long as 108.12 support turned resistance holds, the medium term down trend from 118.65 (2016 high) should still continue lower, at least to retest 98.97 (2016 low). However, sustained break of 108.12 will be an early sign of medium term reversal. In that case, further rise would be seen to 114.73 resistance to confirm completion of the fall from 118.65.
USD/CHF Mid-Day Outlook
Daily Pivots: (S1) 0.9571; (P) 0.9604; (R1) 0.9631; More...
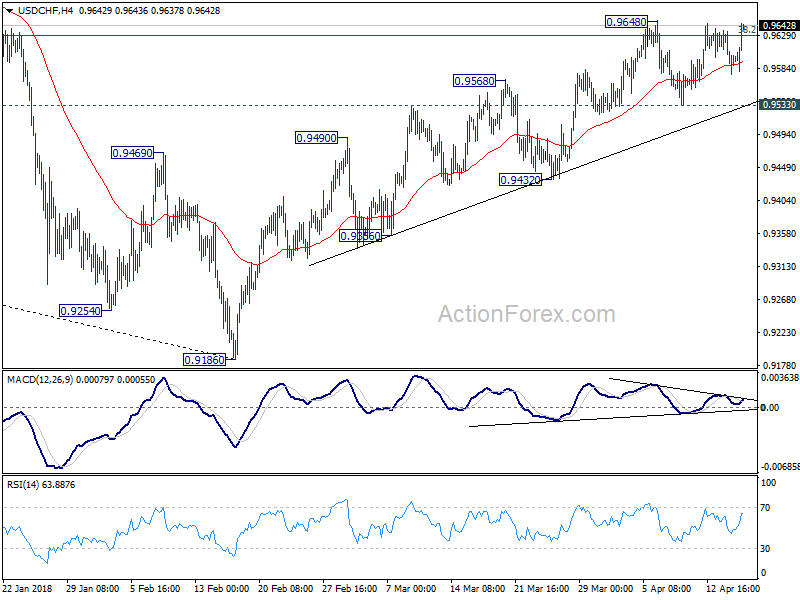
Dollar's strong rebound today now put 0.9648 resistance in focus. Decisive break there and sustained trading above 0.9626 key fibonacci level will add to the case of larger reversal. In that case, rise from 0.9186 will target next fibonacci level at 0.9900. On the downside, again, break of 0.9533 minor support should indicate rejection by 0.9626 key fibonacci resistance. Intraday bias would then be turned to the downside side for 0.9432 support. Further break there will turn near term outlook bearish for retesting 0.9186 low.
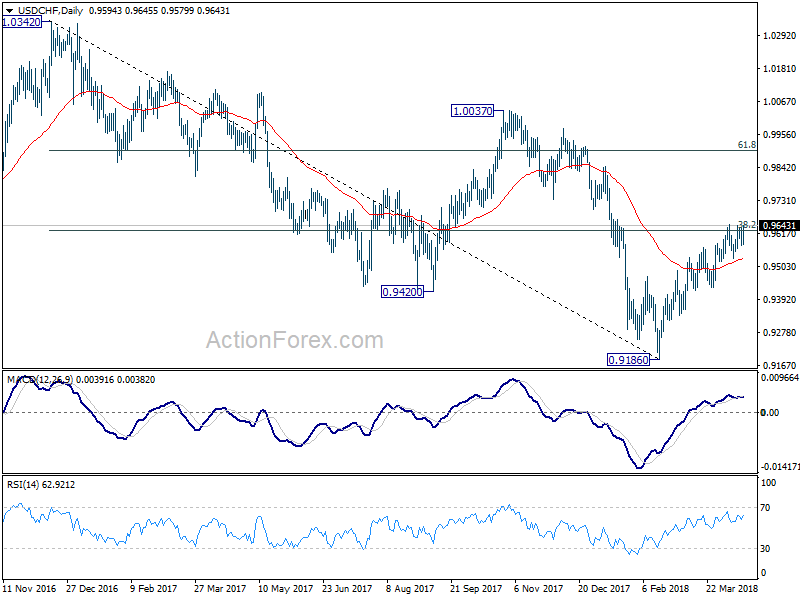
 In the bigger picture, fall from 1.0342 is seen as a medium term down trend. Main focus is on 38.2% retracement of 1.0342 (2016 high) to 0.9186 (2018 low) at 0.9626. Sustained break there will add to the case of trend reversal and target 61.8% retracement at 0.9900 and above. However, rejection from 0.9626 will maintain medium term bearishness for another low below 0.9186.
Sterling and Euro Reverse Gains after Disappointing Data, Dollar Rebounds Broadly
Sterling and Euro strengthened earlier today but both reversed earlier gains after disappointing economic data. On the other hand, Dollar is trying to make a come back as buying accelerates in early US session. It's more a coincidence than a response. But the greenback picks up momentum after US Treasury Secretary Steven Mnuchin repeated President Donald Trump's tweet regarding Russia and China devaluation. The reversal in fortune in European majors today now put USD/CHF into the spotlight. 0.9648 in USD/CHF will be a focus for the rest of the day.
Mnuchin: Trump fired warning shot to Russia and China on currency devaluation
Mnuchin talked to CNBC today and he mentioned Trump's tweet regarding Russia and China currency devaluation. Mnuchin said that was a "warning shot at China and Russia about devaluation. China has devalued their currency in the past." Mnuchin added that "they've used a lot of their reserves to actually support the currency. The president wants to make sure they don't change their plans, and he's watching it."
Regarding the economy, Mnuchin said "we're now at a point where we're comfortably within our 3 percent or higher sustained economic growth". He added that "we literally have met with hundreds of executives, small companies, big companies, and thousands of workers. We're beginning to see the impact of the tax cuts, specifically people investing large amounts of money back into the United States." Also, "The difference between 2.2 and 3 percent will pay for the tax cuts."
Regarding rejoining TPP, Mnuchin just said that Trump would opt to join only when there are more favorable terms to the US. And Mnuchin is "cautiously optimistic.
Released from the US, housing starts rose to 1.32m annualized rate in March. Building permits rose to 1.35m. Industrial production rose 0.5% mom in March, capacity utilization rose to 78.0%.
Canada manufacturing sales rose 1.9% mom in February. International Securities Transactions dropped to CAD 3.96b in February.
UK employment hit record, but wage growth disappointed
UK unemployment rate dropped to 4.2% in February, down from 4.3% and beat expectation of 4.3%. That's also the lowest level since 1975. Employment also rose to a record high between December and February, adding 55k jobs. However, average weekly earnings grew only 2.8% 3moy, unchanged from January's reading. That's a disappointing to markets who expected 3.0% 3moy growth. Sterling traders were clearly disappointed with the data as the pound pared back some gains after the release.
However, UK Chancellor of Exchequer Philip Hammond sounded upbeat on employment and productivity outlook. He point the parliament to " record levels of employment in the economy, record-high employment figures". Hammond expected these factors to "drive the productivity performance of the UK economy."
German ZEW: Sentiment deteriorated sharply on US trade conflicts and Syrian war
German ZEW economic sentiment dropped to 87.9 in April, down from prior 90.7 and consensus of 88.0. ZEW expectation gauge dropped to -8.2, down from 5.1, below consensus of -1. ZEW noted in the statement that "the reasons for this downturn in expectations can mainly be found in the international trade conflict with the United States and the current situation in the Syrian war. ZEW also warned that " significant decline in production, exports and retail sales in Germany in the first quarter of 2018 is also having a negative effect on the future economic development." Eurozone ZEW economic sentiment dropped 1.9, down from 13.4, below expectation of 7.3. The deterioration were similar to those dragged the Germany readings.
China GDP grew 6.8% in Q1, March data mixed
Released from China, Q1 GDP grew 6.8% yoy, same as prior quarter and met expectation. However, March data were mixed. Retail sales rose 10.1% yoy in March, up from prior 9.7% yoy and beat expectation of 9.7% yoy. Industrial production, on the other hand, rose 6.0% yoy, slowed from prior 7.2% yoy and missed expectation of 6.9% yoy. Fixed assets investment also slowed to 7.5% yoy, down from 7.9% yoy and missed expectation of 7.7% yoy. Seasonal factor - Lunar New Year in the second half of February, was the key reason for the mixed picture in March. More evidence in April and May are need to determine whether Chinese economic growth would slow this year.
More in China's March Data Distorted by Holiday and Weather Effects
China's PBoC lowers RRR by 1% release CNY 400b funding to small and micro businesses
In a move to increase support for small and micro businesses, the People's Bank of China lowered Reserve Requirement Ratio for most commercial and foreign banks by 1%, effective April 26. On the same day, those banks included could use the funds released by RRR reduction to repay borrowing from the PBoC, on the basis of "borrowed first, repaid first".
PBoC went further to explain that China's small and micro businesses still face difficulties in financing and expensive financing. Lowering the RRR for some banks could release funding to support these businesses. The move could also increase long terming funding and lower costs of the funds. CNY 400B in funds will be released and these funds are required to be used mainly for loans to small and micro businesses
RBA minutes: Growth to exceed potential, but still not strong case for near term hike
Minutes of April RBA meeting appeared to be rather balance. RBA sounded upbeat and said over 2018, GDP growth was expected to "exceed potential. CPI inflation was expected to "increase gradually" to a little above 2% target. Also, leading indicators continued to point to "above-average growth in employment" in the period ahead.
However, RBA also warned that "the possibility of an escalation in trade restrictions represented a risk to the global outlook that needed to be monitored closely". Additionally, "the high level of debt in China and the significant share of financial market activity in unregulated sectors continued to pose important risks to the outlook for the Chinese economy".
Regarding exchange range, RBA reiterated that "an appreciation of the Australian dollar would be expected to result in a slower pick-up in economic activity and inflation than forecast." On monetary policy, RBA also reiterated that the next move "would be up, rather than down". But still, "there was not a strong case for a near-term adjustment in monetary policy".
USD/CHF Mid-Day Outlook
Daily Pivots: (S1) 0.9571; (P) 0.9604; (R1) 0.9631; More...
Dollar's strong rebound today now put 0.9648 resistance in focus. Decisive break there and sustained trading above 0.9626 key fibonacci level will add to the case of larger reversal. In that case, rise from 0.9186 will target next fibonacci level at 0.9900. On the downside, again, break of 0.9533 minor support should indicate rejection by 0.9626 key fibonacci resistance. Intraday bias would then be turned to the downside side for 0.9432 support. Further break there will turn near term outlook bearish for retesting 0.9186 low.
In the bigger picture, fall from 1.0342 is seen as a medium term down trend. Main focus is on 38.2% retracement of 1.0342 (2016 high) to 0.9186 (2018 low) at 0.9626. Sustained break there will add to the case of trend reversal and target 61.8% retracement at 0.9900 and above. However, rejection from 0.9626 will maintain medium term bearishness for another low below 0.9186.
Economic Indicators Update
| GMT | Ccy | Events | Actual | Forecast | Previous | Revised |
|---|---|---|---|---|---|---|
| 01:30 | AUD | RBA April Meeting Minutes | ||||
| 02:00 | CNY | GDP Y/Y Q1 | 6.80% | 6.80% | 6.80% | |
| 02:00 | CNY | Retail Sales YTD Y/Y Mar | 10.10% | 9.70% | 9.70% | |
| 02:00 | CNY | Industrial Production YTD Y/Y Mar | 6.00% | 6.90% | 7.20% | |
| 02:00 | CNY | Fixed Assets Ex Rural YTD Y/Y Mar | 7.50% | 7.70% | 7.90% | |
| 04:30 | JPY | Industrial Production M/M Feb F | 0.00% | 4.00% | 4.10% | |
| 08:30 | GBP | Jobless Claims Change Mar | 11.6k | 13.3k | 9.2k | |
| 08:30 | GBP | ILO Unemployment Rate 3Mths Feb | 4.20% | 4.30% | 4.30% | |
| 08:30 | GBP | Average Weekly Earnings 3M/Y Feb | 2.80% | 3.00% | 2.80% | |
| 09:00 | EUR | German ZEW Economic Sentiment Apr | 87.9 | 88 | 90.7 | |
| 09:00 | EUR | German ZEW Expectations Apr | -8.2 | -1 | 5.1 | |
| 09:00 | EUR | Eurozone ZEW Economic Sentiment Apr | 1.9 | 7.3 | 13.4 | |
| 12:30 | CAD | International Securities Transactions (CAD) Feb | 3.96B | 7.24B | 5.68B | 5.63B |
| 12:30 | CAD | Manufacturing Sales M/M Feb | 1.90% | 1.00% | -1.00% | -1.30% |
| 12:30 | USD | Housing Starts Mar | 1.32M | 1.27M | 1.24M | 1.30M |
| 12:30 | USD | Building Permits Mar | 1.35M | 1.33M | 1.30M | 1.32M |
| 13:15 | USD | Industrial Production M/M Mar | 0.50% | 0.40% | 1.10% | 0.90% |
| 13:15 | USD | Capacity Utilization Mar | 78.00% | 77.90% | 78.10% | 77.70% |
As Expected, Chinese Economic Activity Slowed to a 6.8% (Year-on-Year) in the First Quarter
Chinese real gross domestic product (GDP) rose by 6.8% (year-on-year) in the first quarter of 2018, in line with consensus expectations. On a quarter-over-quarter basis, growth slowed to a 1.4% (5.7% annualized) pace, reflecting disruptions in activity due to the Lunar New Year holiday period. Small but largely offsetting revisions to economic growth in the first and second quarters of 2017 have little impact on estimated annual growth for last year.
Nominal GDP grew 10.2% (y/y) in the first quarter, somewhat slower than the 11.1% pace recorded in the fourth quarter. The GDP deflator rose 3.2% y/y, a full percentage point less than the previous quarter.
On an industry basis, growth was broad-based. Primary industry (e.g. agriculture and mining) registered a 7.6% advance, while activity in the secondary industry (construction and manufacturing) rose 6.5% - the fastest pace in a year. Growth in tertiary (services) industries, the largest sector of the Chinese economy, registered a 7.6% y/y advance, but was the weakest pace recorded since the third quarter of 2016.
Monthly activity indicators were somewhat mixed. The reading for fixed asset investment (excluding rural areas) in March was below consensus expectations (+7.5% y/y vs. 7.7%), and remained at a sub-8.0% pace (reported on a year-over-year, year-to-date basis) for the third consecutive quarter. Fixed asset investment has been slowing consistently since early-2013 when it was rising by around 20% per year, reflecting the shift away from investment toward services. Industrial production for March also missed consensus expectations (+6% y/y vs. 6.4%), but retail sales beat expectations (+10.1% y/y vs. 9.7%).
Key Implications
The Chinese economy slowed largely as expected in the first quarter, as seasonal disruptions panned out in line with consensus forecasts. Looking ahead, we anticipate that growth on a year-on-year basis should hold at roughly the same pace before slowing further in the second half of the year, as tightening credit conditions constrain growth. Overall, we continue to anticipate economic activity to advance at a 6.5% pace this year, in line with the target set by Chinese authorities, but notably weaker than the near 7.0% increase from last year.
Tighter credit conditions have resulted in a material slowdown in credit growth. Quarterly growth in social financing to the real economy declined for the second consecutive quarter in 18Q1, helping to stabilize the aggregate debt-to-GDP ratio at an all-time high of about 280%. But, there's still much work to be done, such as the ongoing elimination of overcapacity in some manufacturing industries (e.g. steel) and the resolution of bad debts more broadly. As such, we anticipate policymakers will continue to maintain a tightening bias in domestic credit conditions this year as they have since the second half of 2015.
Aside from slowing credit growth, the threat of further tariffs against Chinese goods by the U.S. administration together with its WTO complaint on China's intellectual property violations is acting to keep global and domestic policy uncertainty elevated. Although the only tariffs imposed thus far are those on steel and aluminum with very limited impact on China, an escalation of tensions is likely to delay investment decisions, with global supply chains suffering collateral damage.