

Sample Category Title
Eco Data 4/18/18
[php_everywhere instance="1"]
Economic Growth Once Again Holds Steady in China
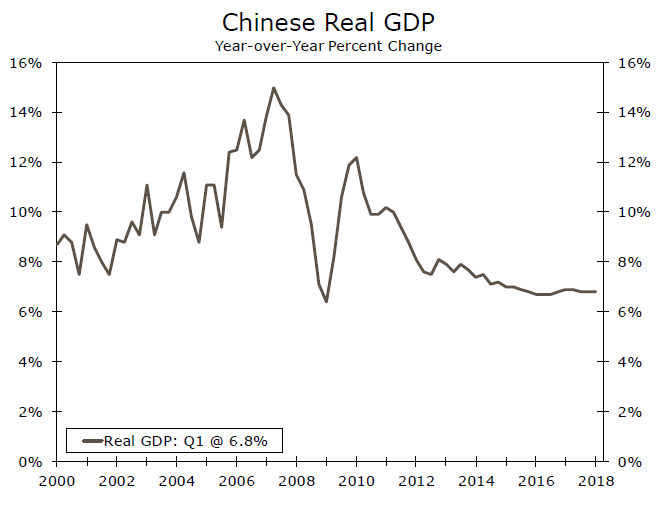
Real GDP growth in China was 6.8 percent year over year in Q1, the third consecutive print of this magnitude. Decelerating investment spending presages a gradual slowdown in economic growth in the coming quarters.
Chinese Growth Continues to Hold Firm
Real GDP growth in China met expectations for Q1-2018, matching the Bloomberg consensus forecast of 6.8 percent year over year. Economic growth in China has been remarkably stable over the past couple of years as policymakers have worked to engineer a "soft landing" as the economy enters a more mature phase of its development (top chart). Retail sales growth rebounded strongly in Q1 after hitting a mild soft patch to end Q4-2017. In the press release from the National Bureau of Statistics of China, the agency noted an acceleration in services output in March, suggesting solid momentum heading into Q2. However, investment spending and industrial production both decelerated in March. In part, this reflects a conscious effort by Chinese policymakers to shift the economy towards a more consumptionoriented model of growth. Trade also likely contributed to growth in Q1. Data through February showed robust export volumes, with year-over-year growth of 17.1 percent on a three-month moving average basis.
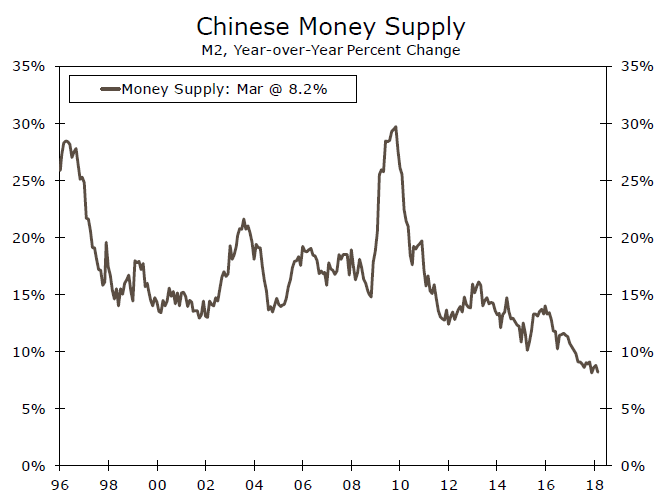
On balance, today's report reaffirms our outlook for the Chinese economy. Economic growth remains firm, boosted by the cyclical-upturn in the global economy. However, we believe structural factors will continue to weigh on economic growth over time. Decelerating investment spending and an aging population are the ingredients for slowing potential growth. In addition, Chinese policymakers recognize the possible threat from high leverage in the nonfinancial corporate sector and have taken steps to slow credit growth. Money supply growth as measured by M2 continues to slow (middle chart). These factors underpin our forecast for economic growth in China to slow gradually over the remainder of this year and next.
China a Treasury Buyer Before Trade Troubles
In a report released yesterday, data on international capital flows showed net purchases of U.S. Treasury securities by foreign investors increased in February by the most in nearly a year. Both private and public institutions were net buyers, and foreign official buying returned in force, rising $19.1 billion, the most since June 2014. Treasury does not provide a private/official breakdown for individual countries, but as a whole Chinese buyers saw a sizable increase in the month, up $8.5 billion on net.
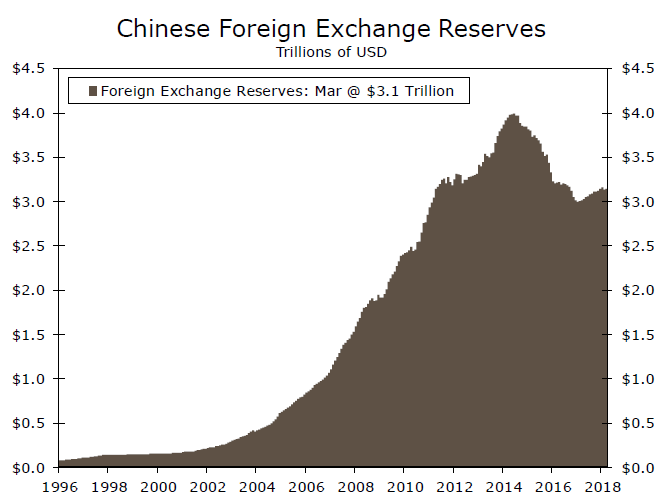
China is the largest foreign holder of U.S. Treasury securities, with about $1.2 trillion in holdings (or about 8 percent of U.S. debt held by the public). On the public side, China holds U.S. Treasury securities largely to back its sizable war chest of FX reserves (bottom chart). In our view, it seems unlikely the rising trade tensions between China and the United States have materially impacted China's Treasury buying thus far. That said, what is debt to one person is an asset to another, and China's considerable Treasury asset holdings represent yet another way in which the fortunes of these two economic powerhouses are intertwined.
Bank of Canada to Remain on Hold, May Retain a Cautious Bias for Now
The Bank of Canada (BoC) will announce its monetary policy decision on Wednesday at 1400 GMT, and expectations are for policymakers to refrain from raising rates for the second meeting in a row. While inflation edged up recently, the economy slowed and trade risks have remained elevated, presenting a dilemma for the Bank. On balance, officials may retain a cautious bias for now, while they monitor both economic data and trade developments.
The BoC appeared quite cautious when it last met, indicating that trade developments are “an important and growing source of uncertainty” – referring of course to the tariffs announced by the US and the ongoing NAFTA negotiations. On the economy, officials noted that Q4 GDP was disappointing. The lack of hawkish signals triggered a negative reaction in the Canadian dollar, as investors pared back their rate-hike expectations.
Ever since, developments have been mixed. On the one hand, the economy appears to have slowed further in Q1, as GDP growth turned negative in January. And while there have been some encouraging headlines suggesting progress in the NAFTA talks recently, there hasn’t been any concrete agreement the Bank can rely on. Trade risks are still present, and the BoC is unlikely to dismiss them because “the likelihood” for a deal may have risen. Not to mention that non-NAFTA trade uncertainties have increased notably over the past month as well.
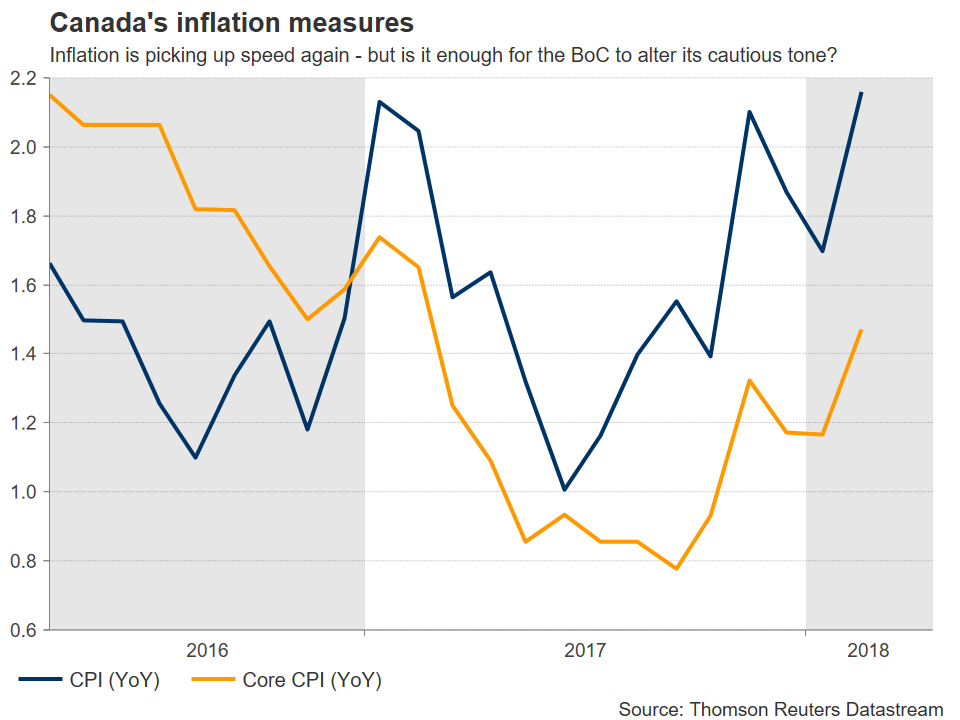
On the other hand, inflation is on the rise. The CPI rate surprisingly surged to 2.2% in February, a touch above the mid-point of the BoC’s 1-3% target band, while the core rate that excludes the effects of volatile items reached 1.5%, its highest level in a year. While the Bank expected inflation to head north in its latest set of forecasts, as the effects of past declines in energy prices faded, the magnitude and speed of the increase may have caught policymakers off guard. That said, there’s a possibility the Bank “looks through” this surge as being owed to temporary factors, such as recent minimum wage hikes and a surge in internet service pricing.
 Bearing the above in mind, policymakers have a challenging task at hand. Disappointing economic growth and elevated trade risks argue for rates to stay unchanged for a while, while mounting inflationary pressures argue for rate hikes to come sooner rather than later, and the Bank must strike a balance between the two.
On the margin, the BoC appears to have more incentives to remain cautious for now, as opposed to striking an optimistic tone. It may continue to signal that any future rate hikes will be gradual, taking its time to monitor whether the economy’s recent slowdown is transitory and how the NAFTA negotiations play out. In the meantime, if inflation continues to soar higher, the Bank could always reassess its outlook and raise rates in a more aggressive pace in the future.
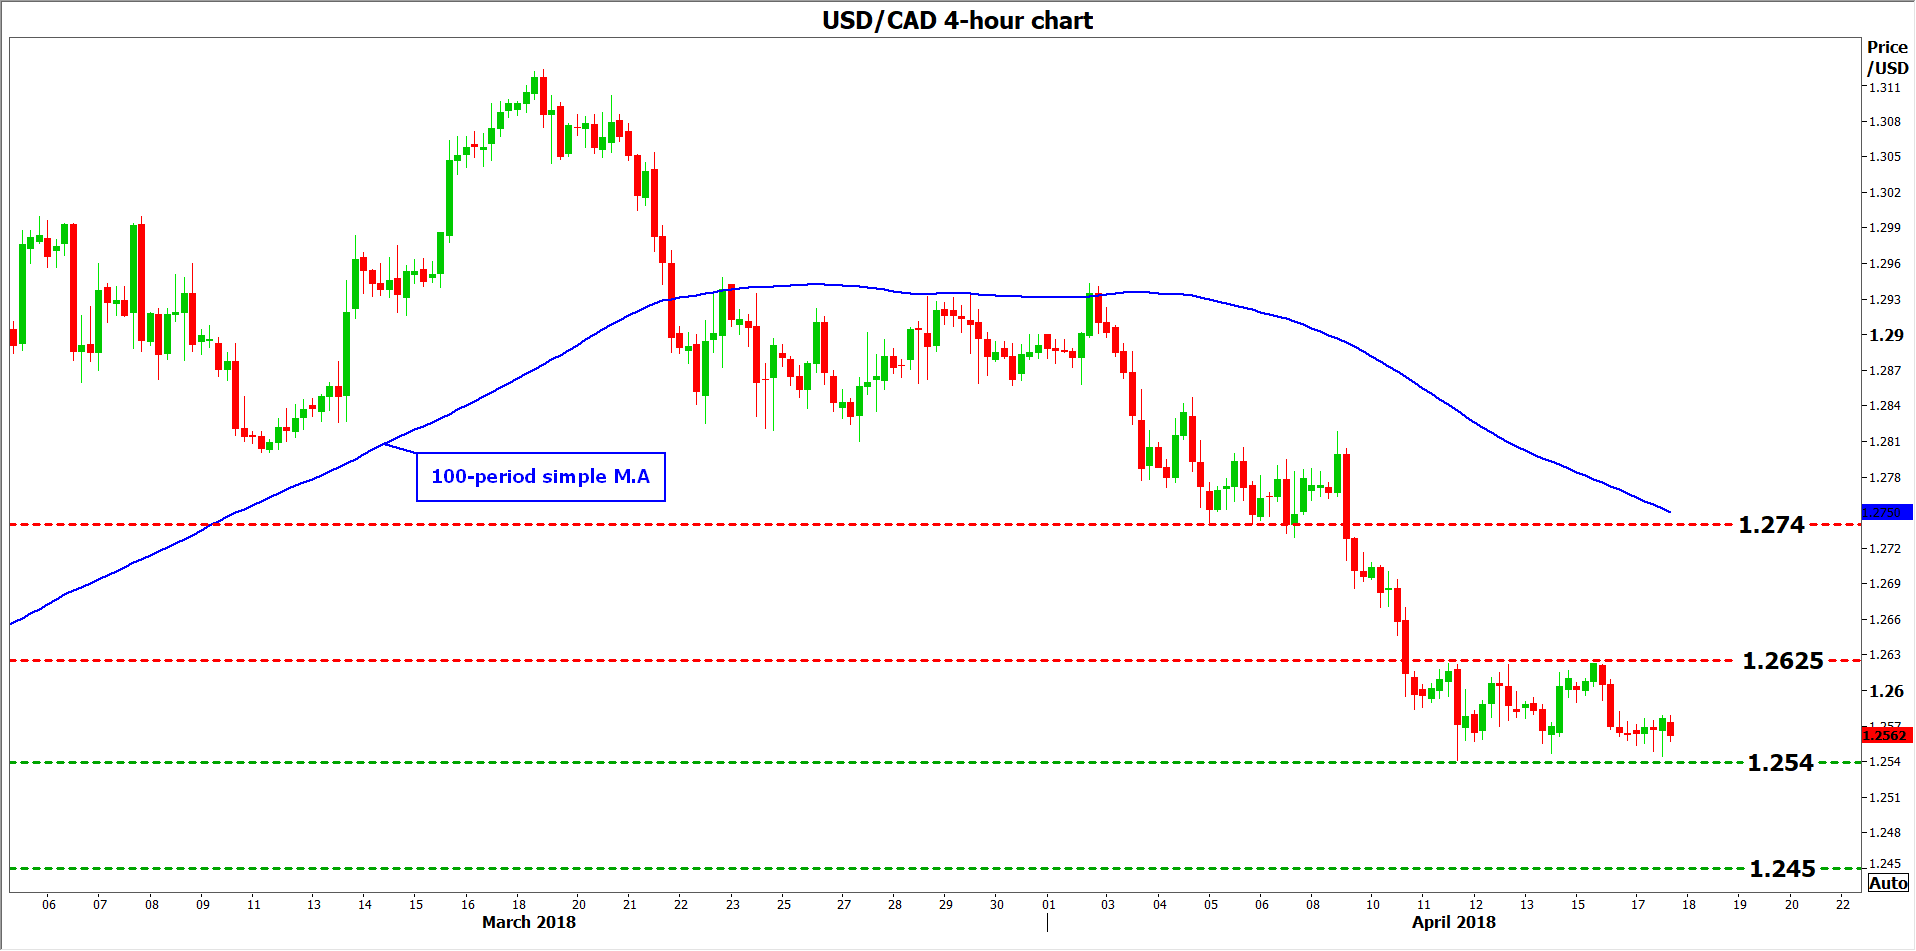 Looking at market pricing, while investors see only a 10% probability for a rate hike at this meeting, that number jumps to 44% for an increase at the May meeting, while a hike in July is virtually fully priced in according to overnight index swaps. Should the Bank retain a cautious bias, markets could begin to doubt whether a July hike will indeed materialize, pushing the loonie lower. In this case, dollar/loonie could edge higher and challenge the 1.2625 zone, which acted as a reliable barrier to price advances in recent days. An upside break of that area may open the way for a test of the 1.2740 hurdle – notice that the 100-period moving average on the 4-hour chart lies not far above, at 1.2750.
Conversely, if the Bank appears more worried about the pickup in inflation, hinting that more rate hikes are looming, then the loonie could extend its recent gains. Dollar/loonie could edge lower, with immediate support likely to come around 1.2540, a level that has managed to resist a downside violation on numerous occasions lately. Sharper declines would shift the focus to 1.2450, defined by the low of February 16.
Last but not least, besides the rate decision, the Bank will also release updated economic forecasts for the Canadian economy, and Governor Poloz will hold a press conference after the meeting at 1515 GMT. Both of these could also impact price action in dollar/loonie.
Japanese Yen Subdued, US Building Permits Beats Estimate
USD/JPY is trading sideways in the Tuesday session. In North American trade, USD/JPY is trading at 107.16, up 0.04% on the day. On the release front, Japanese Revised Industrial Production improved to 0.0%, but fell short of the estimate of 4.0%. Later in the day, Japan releases trade balance, with is expected to improve to 0.10 JPY trillion. In the US, the focus was on construction data. Building Permits improved to 1.35 million, beating the forecast of 1.33 million. Housing Starts climbed to 1.32 million, above the estimate of 1.27 million.
Syria remains a geopolitical hotspot after a US-led missile strike destroyed three chemical weapons sites on the weekend. Predictably, Syria and Russia strongly condemned the attack, with Russian President Putin warning that the attack would lead to global “chaos”. Still, a Russian response is unlikely, despite the strong rhetoric. Investors did not show much reaction to the attack, as the markets had already priced in a strike. After the weekend attack, President Trump declaration of “mission accomplished” means that things will remain relatively quiet in Syria. However, further chemical attacks by the Syrian regime could trigger a response from the US and its allies, which could result in volatility in the markets, similar to what occurred last week. If tensions are reignited, traders can expect the safe-haven yen to record strong gains.
In Japan, a government’s monthly economic report was cautiously optimistic about economic conditions. The report indicated that the economy was “gradually recovering”, identical to the statement a month earlier. The report also noted that consumer spending was “recovering”. The economy continues to expand, but the markets are braced for a slowdown in the first quarter. Annualized growth in the fourth quarter was 1.6%, but that is expected to fall sharply to 0.5% in Q1 of 2018. Inflation has been hovering around 1%, well short of the Bank of Japan target of 2 percent. Until inflation gathers steam, the BoJ is unlikely to tighten its ultra-accommodative monetary policy.
US: Housing Starts Rose Solidly in the First Quarter
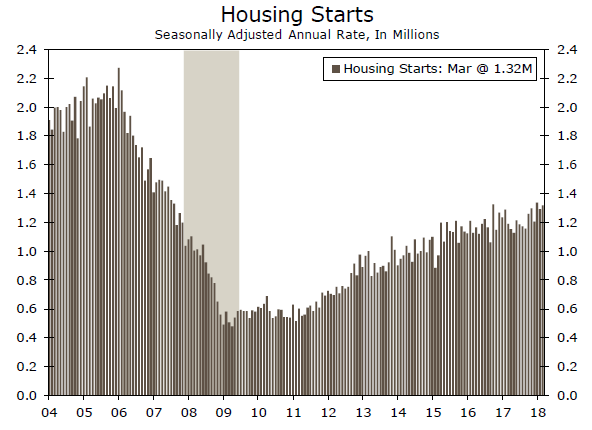
Housing starts rose 1.9 percent in March to a 1.32-million unit pace, while permits increased 2.5 percent. Revisions to previously published data show that starts and permits were stronger during the first quarter.
Revisions Should Put Some Doubts to Rest
Housing starts rose 1.9 percent in March, with all of the gain coming in the volatile multifamily category. Multifamily starts jumped 14.4 percent during the month, while single-family starts fell 3.7 percent. Despite the dip in single-family starts, the data for the first three months of the year are unambiguously positive and indicate that new home construction has more momentum than previous reports had indicated. Data for February were revised up significantly and now show starts falling less than half as much as the preliminary figures indicated. Housing permits were also revised up significantly.
We have repeatedly noted that preliminary data for the early part of the year are notoriously volatile and that volatility can be heightened by swings in the weather. Early data from this seasonally slow time of the year are often incomplete, which appears to have been the case this year. The new data show homebuilding is off to a strong start, with overall starts through the first three months of this year running 8.0 percent ahead of the same period one year ago. Single-family starts through March are 7.0 percent higher than they were in Q1-2017, while multifamily starts are up 10.2 percent.
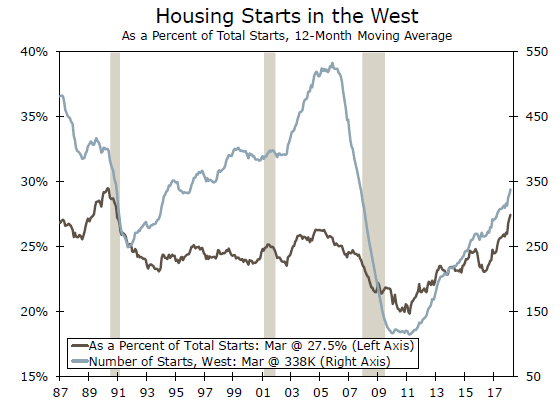
The improved data appear to be mostly due to stronger growth in the West, where starts through the first three months of the year are up a whopping 34.2 percent from last year and single-family starts are up 26.5 percent. The West is where economic growth has been the strongest and homebuilding has generally lagged behind population and employment growth. With home prices soaring, governments have become more proactive at trying to pave the way for more residential development, even in California. Home buyers out West are also seeking out more affordable markets in California's Inland Empire, the Central Valley, and in Nevada, Arizona and Utah.
The harsh winter weather in the East and Midwest is still evident in the housing data. Overall starts in the Midwest through March are down 6.3 percent from one year ago and single-family starts are down 3.0 percent. The Northeast has fared somewhat better. Overall starts through the first three months of the year are up 9.0 percent, but single-family are down 4.8 percent. Moreover, overall permits through March in the Northeast are down 1.5 percent and single-family permits have fallen 3.6 percent. We would expect these data to improve once things warm up in May and June.
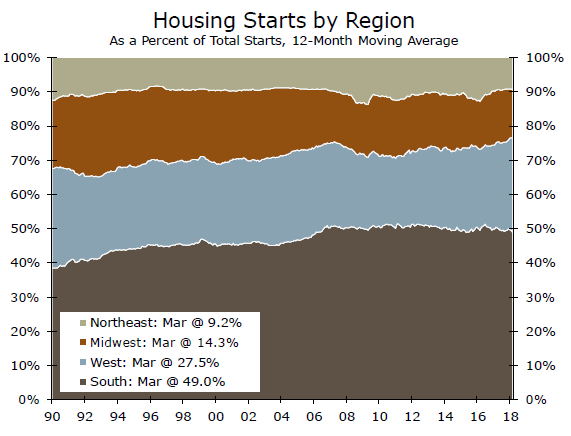
Housing starts fell 0.6 percent in the South during March, pulled down by a huge 9.8 percent drop in single-family starts. Through the first three months of 2018, overall starts in the South are running 0.5 percent below their yearago pace, while single-family starts are running 2.7 percent higher. The South and the West have accounted for a near-record 76.5 percent of housing starts over the past year. The unusually high concentration of housing starts in these two regions may be heightening concerns about shortages of lots, labor and building materials.
GBPUSD – Initial Reversal Signal is Developing on Daily Chart on Failure through Key 1.4344 Barrier after UK Wages...
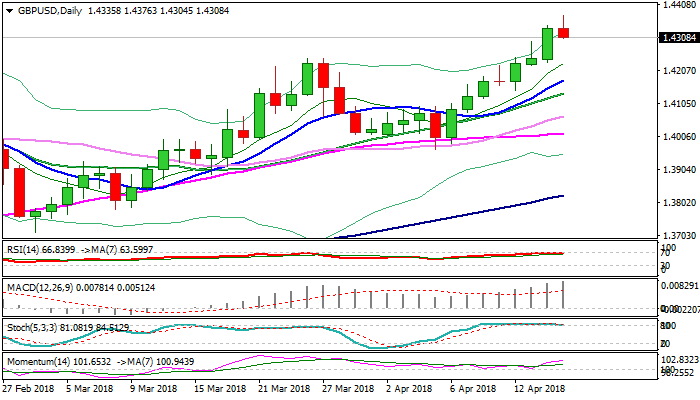
Cable dipped back to 1.4300 zone, where the pair traded at the beginning of American session, after pulling back from new multi-month high at 1.4376 on disappointing UK earnings numbers. Wages in the UK did not rise in expected pace, coming unchanged at 2.8% in Feb vs forecasted 3.0%.
Sterling rallied in twelve consecutive days from 1.3965 trough and left an series of higher highs and higher lows, which could be interrupted, as negative signal is building on daily chart.
Overbought slow stochastic is attempting to reverse and has already formed bearish divergence, which could stronger influence bulls and signal correction.
Today’s close in red, on failure to clearly break above former recovery top at 1.4344 would be initial bearish signal for deeper pullback.
On the other side, dips are expected to be limited as pound remains well supported on expectations of BoE’s rate hike on policy meeting next month.
Pullback would face solid support at 1.4244 (former highs) and should be ideally contained above rising 10SMA (1.4176) to keep intact overall bulls.
Tomorrow’s release of UK inflation data is seen as another key event for sterling which could provide fresh direction signal.
Res: 1.4344; 1.4376; 1.4400; 1.4450
Sup: 1.4300; 1.4277; 1.4244; 1.4176
New Zealand Inflation Expected to Fall to Lower Target Band as Kiwi Stalls at $0.74
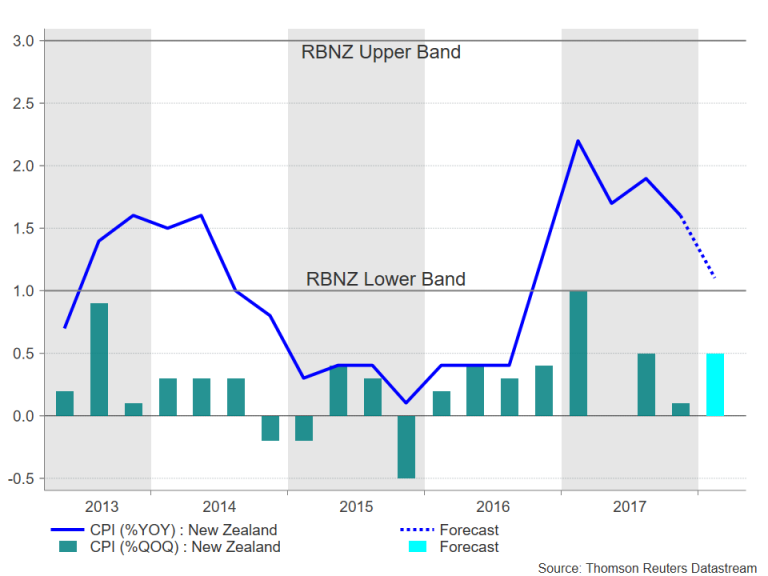
Quarterly inflation numbers out of New Zealand on Thursday are expected to show the country’s CPI rate moving back towards the lower end of the Reserve Bank of New Zealand’s target band. The data (due at 22:45 GMT on Wednesday) would likely reaffirm expectations that the RBNZ will be on hold for a while longer.
After spiking to 2.2% in the first three months of 2017, annual inflation has been steadily slowing. It is forecast to fall to 1.1% in the March quarter, taking the CPI rate to the lowest since the third quarter of 2016 and to just inside the RBNZ’s target band of 1-3%. On a quarter-on-quarter basis, CPI is anticipated to accelerate from 0.1% in the final three months of 2017 to 0.5% in the first quarter.
 The RBNZ could see the pick-up in the quarterly rate as an encouraging sign that price pressures are not about to weaken further and stick to its neutral stance. The central bank’s new governor, Adrian Orr, who took the helm on March 27, has signalled there won’t be any significant shift to monetary policy after the RBNZ’s mandate was revised last month, which now includes “maximizing sustainable employment” in addition to the inflation goal. Speculation that the planned reforms would lead to looser policy had contributed to the sell-off that led the New Zealand dollar to 1½-year lows below $0.68 back in November 2017. However, Orr’s comments helped the kiwi climb close to the $0.74 level last week.
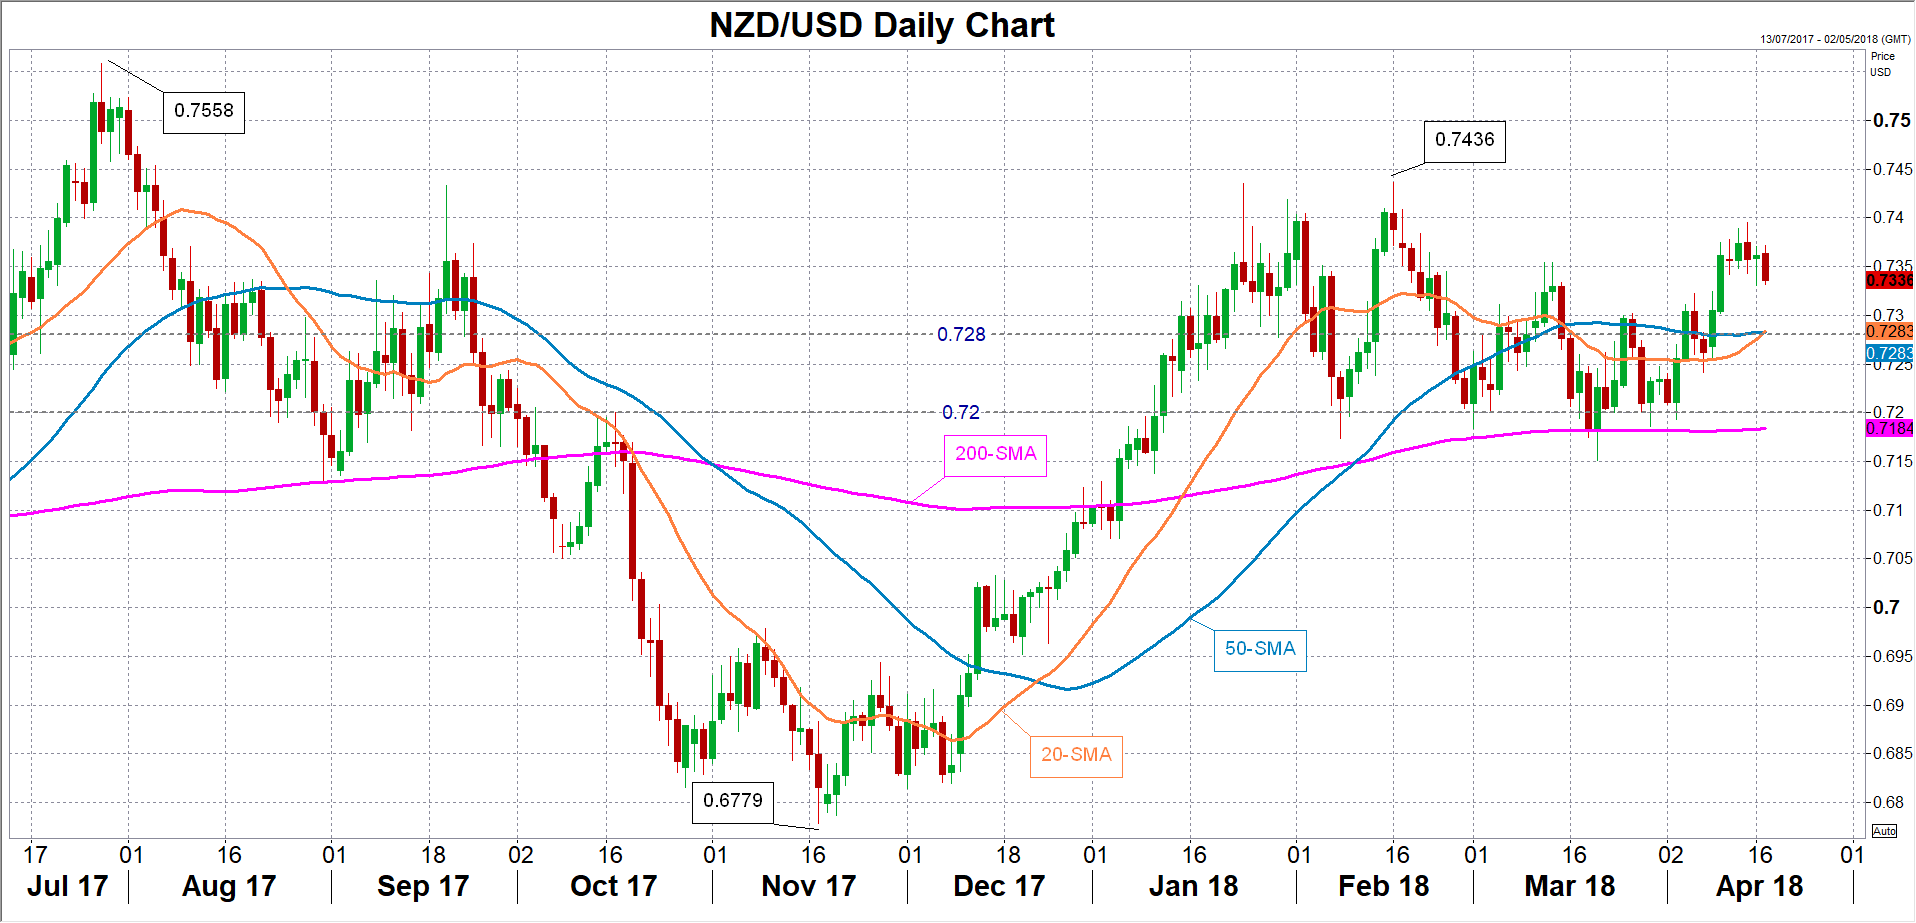
If the inflation data comes in above expectations, the kiwi may make another attempt at challenging the $0.74 barrier. A break above this resistance would bring into scope the February top of $0.7436, followed by the July 2017 top of $0.7558. However, a weaker-than-expected reading where the CPI misses the 1% lower target band could raise speculation that the RBNZ’s next move will be down rather than up. A subsequent sell-off could see the kiwi heading towards support around the $0.7280 level, which is where the 20- and 50-day moving averages are currently converging. A breach of this support could lead to a test of the $0.72 handle.
 Any surprise to the data is unlikely to see a very big reaction however, as traders would probably want to wait until the RBNZ’s next policy meeting on May 10 to get a better idea about the new Governor’s views and the bank’s response to the quarterly inflation data.
Chinese Economy Growing Steadily
Q1 was overall good for China, although not in each and every aspect. The Chinese GDP rose by 6.8% YoY between Jan and Mar, quite in line with the expectations. This is the same rate as in Q4 2017.
Meanwhile, manufacturing production declined compared to the previous value, rising only by 6% against 7.2%, and even against the forecast at 6.4%. Retail sales jumped by 10.1% YoY, heavily beating the expectations. Investments were rising by 7.5% YoY, a bit short of the previous December value at 7.9% and failing to meet expectations.
The overall fundamental outlook shows that Chinese economy has at least some room for growth, while according to some signals a slowdown may occur moving forward. Some positive things includes Xi Jinping's ecology and wellbeing program, as well as the rising global demand, but, as we head into the end of the year, some negative circumstances may appear as well.
The US trade war is something the investors might become wary of, while the macroeconomics show some signs of the infrastructure and real estate activity decline. Still, the economy being stable and steady is the most important thing for the yuan now.
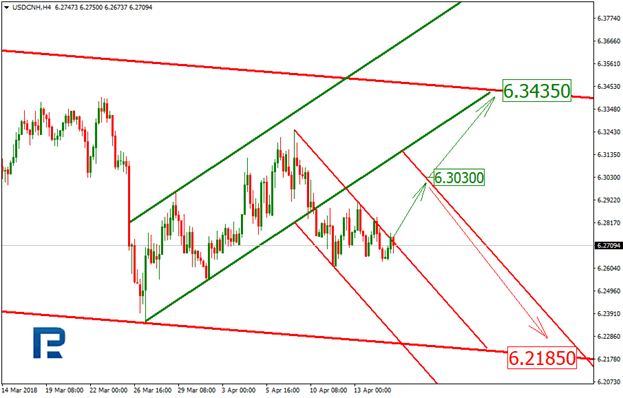
Technically, the USDCNH is downtrending, while the price is slow at making new lows, which means the momentum is fading out. The current target of this downtrend is the support 6.2185. In the short term, the latest internal uptrend stopped without reaching its target at the resistance. Currently, the market is heading lower, and the short term downtrend is testing the resistance for the third time. This, in its turn, may lead to the price moving to the projection channel and aiming for 6.3030. On the other hand, if the ascending trend gains momentum, the major projection channel resistance may get broken out, with the price reaching 6.3435.
IMF Obstfeld: Some governments pursue reforms, trade disputes divert others
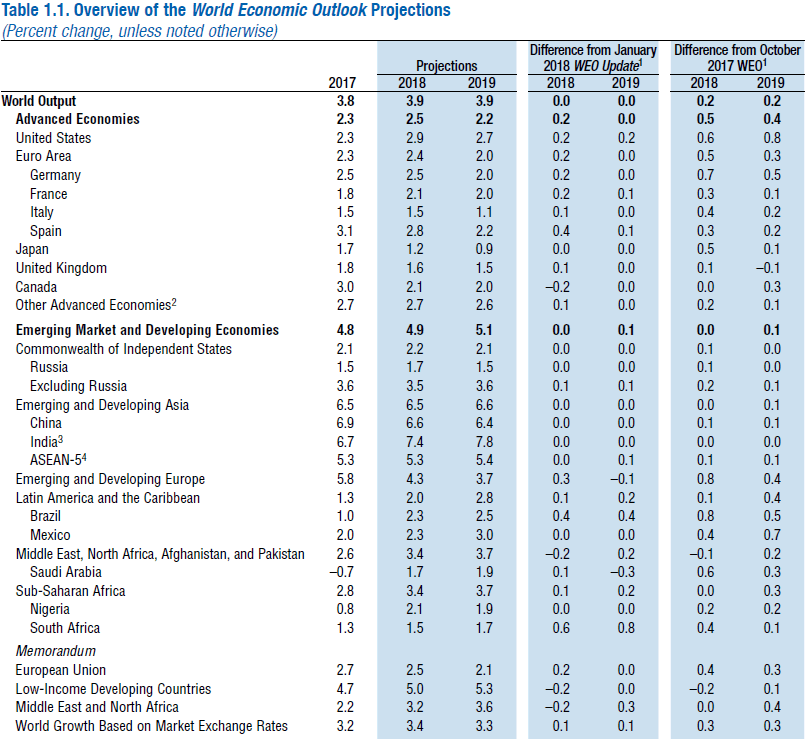
In the new World Economic Outlook released today IMF kept global growth forecast unchanged at 3.9% in 2018 and 3.9% in 2019.
For advanced economies, growth projections for 2018 were generally revised up except Japan and Canada. For 2019, projections were largely unchanged with upward revision in US, France and Spain.
China's growth projection was kept unchanged at 6.6% in 2018 and 6.4% in 2019.
Here is the summary table.
In a blog post by Maurice Obstfeld, Economic Counsellor and Director of Research at the IMF, it's noted that "the world economy continues to show broad-based momentum. Against that positive backdrop, the prospect of a similarly broad-based conflict over trade presents a jarring picture."
Obstfeld said that "prospect of trade restrictions and counter-restrictions threatens to undermine confidence and derail global growth prematurely." And, without naming who, he added that "while some governments are pursuing substantial economic reforms, trade disputes risk diverting others from the constructive steps they would need to take now to improve and secure growth prospects."
Referring to intensification of trade tensions since US announcement of steel and aluminum tariffs, Obstfeld said "these initiatives will do little, however, to change the multilateral or overall U.S. external current account deficit, which owes primarily to a level of aggregate U.S. spending that continues to exceed total income."
The full blog post can be found here. Global Economy: Good News for Now but Trade Tensions a Threat
Sunset Market Commentary
Markets:
Core bonds consolidated in a narrow range today with German Bunds slightly outperforming US Treasuries. Improving European risk sentiment didn’t weigh, neither did a stronger WS opening on the back of strong Q1 earnings (Netflix, Goldman Sachs and Johnson & Johnson). Eco data were mixed with disappointing German ZEW investor sentiment, but better than forecast US housing data and US industrial production. SF Fed Williams, who replaces Dudley at the helm of the NY Fed in the near future, sounded in favour of a gradual rate hike path. He added though that the Fed closely watches inflation with wages ratcheting up and that the eco outlook is very positive. His comments suggest that, if any, he is keeping the door open to more than 2 additional hikes this year. German yields decline between -0.5 bps (2-yr) and -1.3 bps (5-yr) at the time of writing. US yields add 1.3 bps (2-yr) to 0.7 bps (30-yr), marginally bear flattening the curve.
Dollar weakness prevailed of late as markets pondered the consequences of geopolitical uncertainty and of the trade dispute between the US and China. Euro skepticism rather than dollar doubts returned to the forefront today. German ZEW confidence disappointed again. Especially the sharp decline of the expectations component was a good reason for euro longs to become more cautious. At the same time, recent Fed comments can be considered as slightly USD supportive. Even dovish members continue to support the scenario of policy normalization as set out at the March meeting/dots. EUR/USD filled offers in the 1.2410/15 area this morning, but in two waves returned to the 1.2350 area. The gain of USD/JPY remains modest. The pair trades in the 107.10 area. In a broader perspective, both cross rates are still in consolidation modus. The scenario of an acceleration of USD losses (especially against the euro) looks to be rejected, at least for now.
Sterling extensively tested key resistance against the euro (EUR/GBP 0.8650 area) and the dollar (Cable 1.4345 previous top) over the previous days. It looked that sterling longs would be able to force a break, especially against the dollar. UK labour market data didn’t provide a clear trigger. The unemployment rate declined to 4.2% and job growth was as expected. However, (headline) wage growth (2.8% Y/Y vs 3.0% Y/Y expected) was marginally softer than expected. The impact on sterling was modest. The decline of EUR/GBP slowed temporary, but the pair dropped back to the 0.8630 area on overall euro softness later in the session. In the same move, cable dropped off the intraday top (1.4375 area) and trades currently in the 1.4325 area. This setback was partially GBP softness after the labour market data, but mirrored even more the intraday USD rebound. The UK CPI (tomorrow) and to a lesser extent the March UK retail sales (Thursday) might contain some additional clues for sterling trading.
News Headlines:
April German ZEW investor sentiment disappointed. The headline index declined from 90.7 to 87.9, marginally below 88 consensus, but the forward looking “expectations” index crashed from 5.1 to -8.2, the weakest reading since November 2012 (-1 expected). The setback probably reflects fears over global trade and signals that the German growth peak could be behind us.
Turkey’s government said it’s considering a request from a leading ally to bring forward landmark presidential and parliamentary elections to August 26 from November 2019. The Turkish lira felt new selling pressure with EUR/TRY spiking from 5.06 to 5.11.
The IMF predicts the strong world economic upswing will continue for the next two years (3.9%; unchanged from January forecast), but warned the seeds of its demise have already been planted. The fund raised the US growth outlook by 0.2 percentage points both this years and next, to 2.9% and 2.7% respectively.