Sample Category Title
EUR/JPY Daily Outlook
Daily Pivots: (S1) 132.05; (P) 132.40; (R1) 132.71; More....
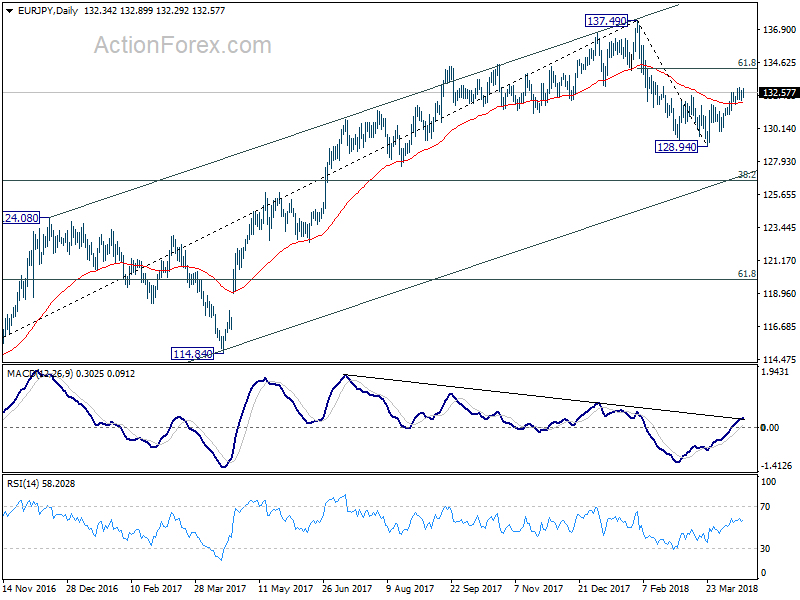
EUR/JPY is staying in consolidation below 132.96 and intraday bias remains neutral. In case of another retreat, downside should be contained by 131.09 minor support to bring rebound resumption. Above 132.96 will extend the rebound from 128.94 to 61.8% retracement of 137.49 to 128.94 at 134.22 and above. On the downside, below 131.09 will indicate that the rebound is completed and bring retest of 128.94 low instead.
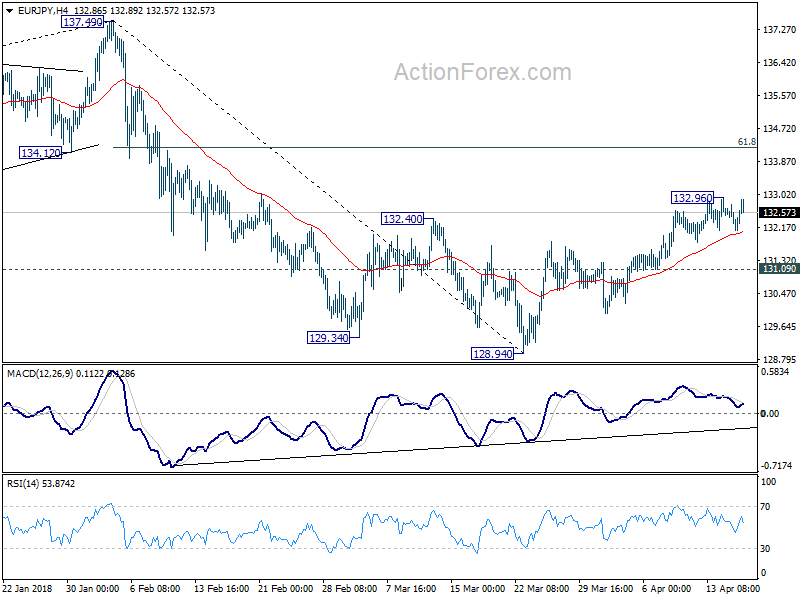 In the bigger picture, price action from 137.49 medium term top are developing into a corrective pattern. Strong support from 55 week EMA (now at 129.91) suggests that the first leg has completed at 128.94 already. Nonetheless, break of 137.49 is needed to confirm resumption of the rise from 109.03 (2016 low). Otherwise, we'd expect more corrective range trading, with risk of another fall to 38.2% retracement of 109.03 to 137.49 at 126.61 before completion.
EUR/GBP Daily Outlook
Daily Pivots: (S1) 0.8629; (P) 0.8645; (R1) 0.8669; More...
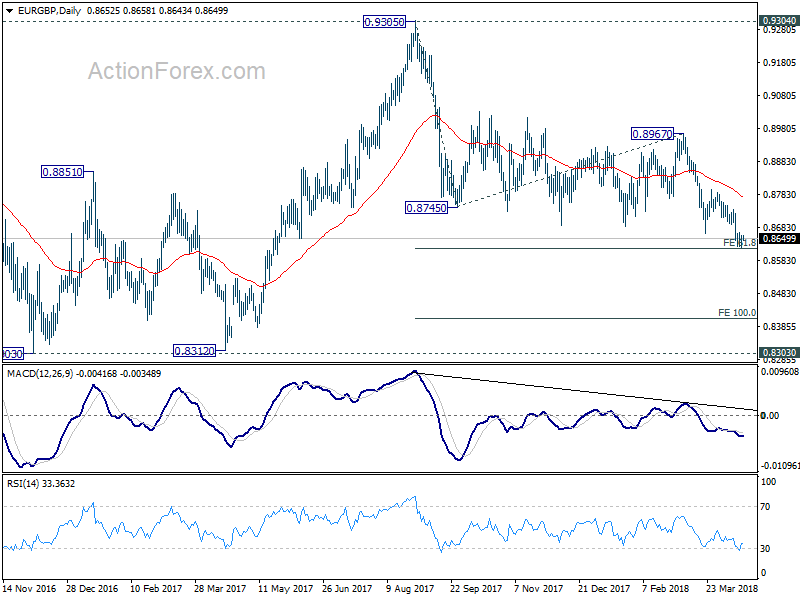
EUR/GBP attempted to break 61.8% projection of 0.9305 to 0.8745 from 0.8967 at 0.8621 but quickly recovered. Intraday bias remains neutral for more consolidative trading. In case of stronger recovery, we'd expect upside to be limited by 0.8739 resistance to bring fall resumption. Firm break of 0.8621 will pave the way to 100% projection at 0.8407.
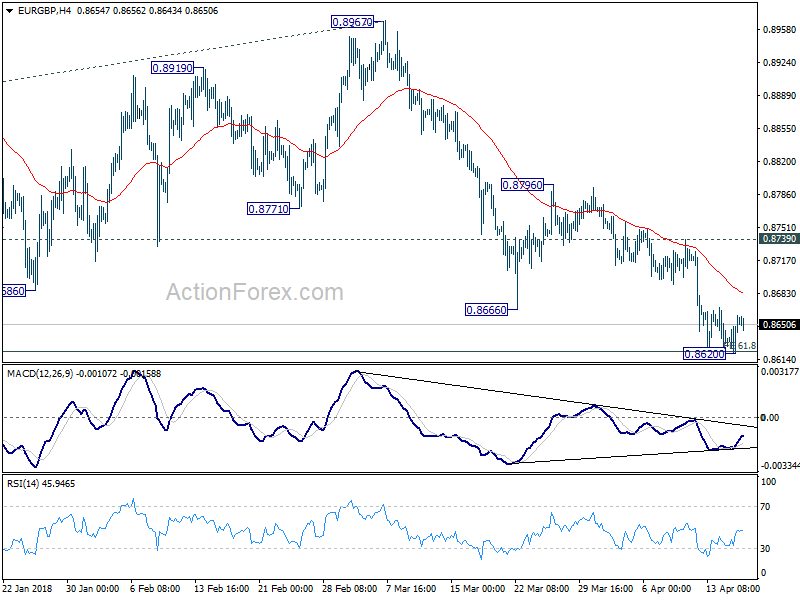 In the bigger picture, there are various ways to interpret price actions from 0.9304 high. But after all, firm break of 0.9304/5 is needed to confirm up trend resumption. Otherwise, range trading will continue with risk of deeper fall. And in that case, EUR/GBP could have a retest on 0.8303. But we'd expect strong support from 0.8116 cluster support (50% retracement of 0.6935 to 0.9304 at 0.8120) to contain downside.
EUR/AUD Daily Outlook
Daily Pivots: (S1) 1.5880; (P) 1.5917; (R1) 1.5955; More....
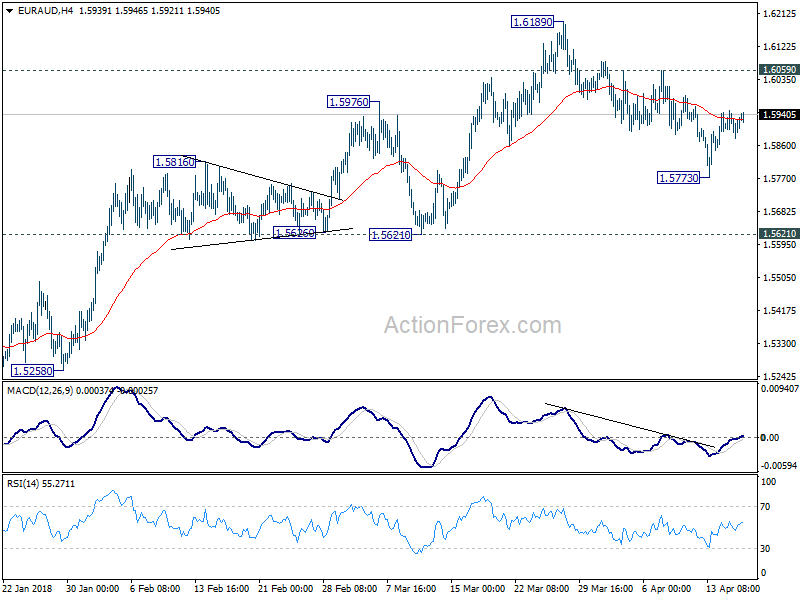
At this point, intraday bias in EUR/AUD remains neutral. We'd expect upside of recovery to be limited below 1.6055 minor resistance to bring another fall. Break of 1.5773 will target 1.5621 support first. Decisive break there will be another indication of medium term trend reversal. However, break of 1.6059 will turn focus back to 1.6189 high instead.
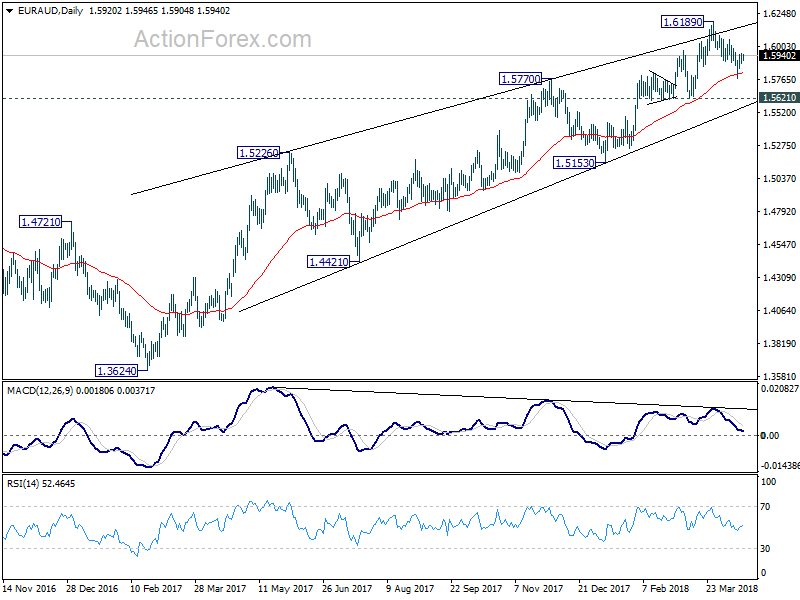
 In the bigger picture, the case for medium term reversal is building up in EUR/AUD. Bearish divergence condition in daily MACD indicates further loss of upside momentum ahead of 1.6587 key resistance (2015 high). Break of 1.5621 should confirm medium term topping and bring deeper fall back to 1.5153 and possibly below. Meanwhile, even in case of up trend resumption, we'd be cautious on strong resistance from 1.6587 to limit upside and bring reversal.
EUR/CHF Daily Outlook
Daily Pivots: (S1) 1.1898; (P) 1.1925; (R1) 1.1978; More...
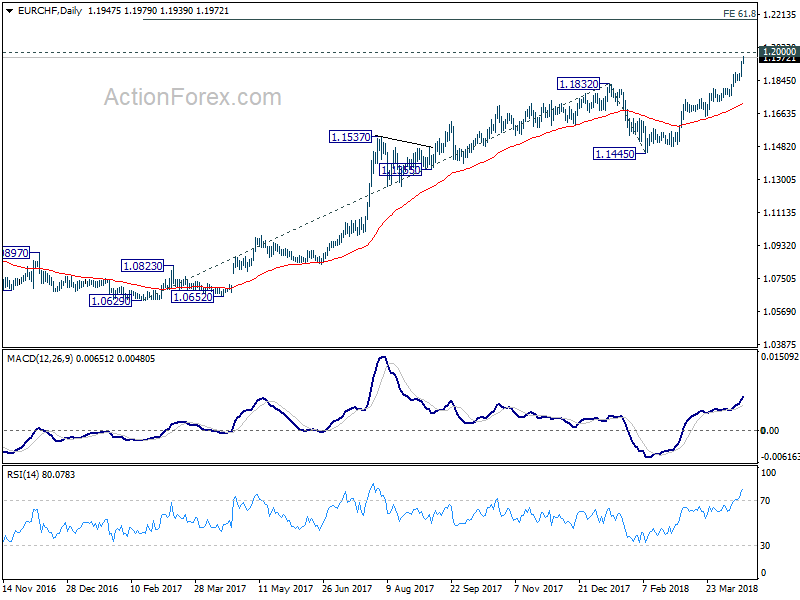
EUR/CHF rises to as high as 1.1979 so far as up trend extends. Intraday bias remains on the upside for 1.2 handle. Sustained break there will target o 61.8% projection of 1.0629 to 1.1832 from 1.1445 at 1.2188. On the downside, below 1.1910 minor support will turn intraday bias neutral and bring consolidation, below staging another rally.
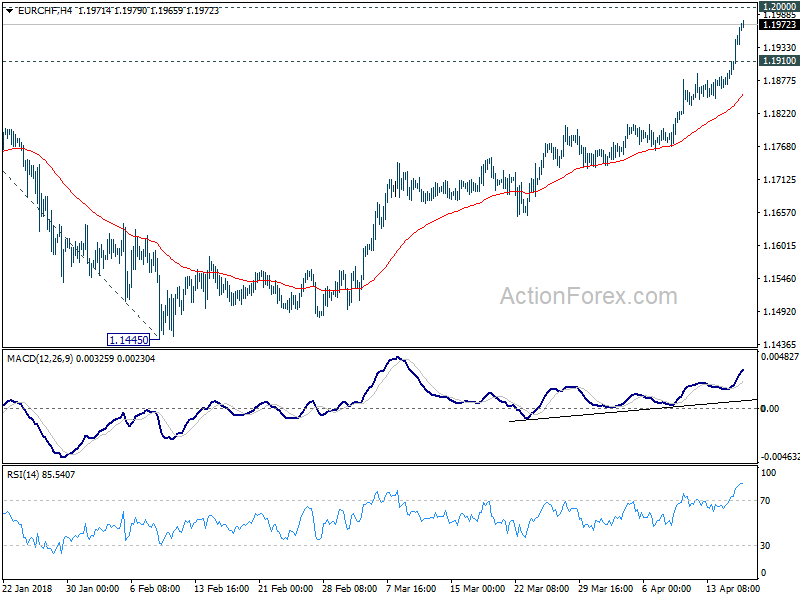 In the bigger picture, decisive break of 1.1832 should now extend the medium term up trend through prior SNB imposed floor at 1.2000. 2013 high at 1.2649 should be the next target. Outlook will remain bullish as long as 1.1445 support holds, even in case of deep pull back.
EUR/USD Daily Outlook
Daily Pivots: (S1) 1.2332; (P) 1.2372 (R1) 1.2410; More....
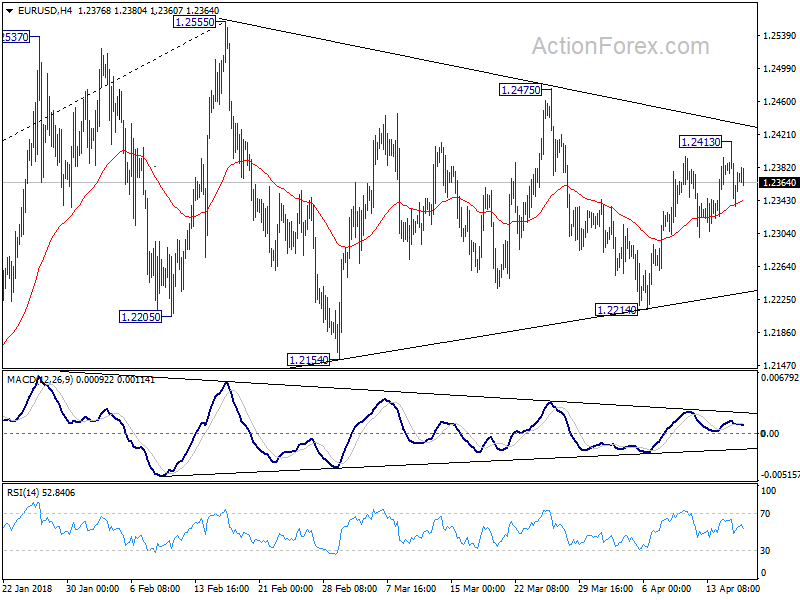
Intraday bias in EUR/USD remains neutral for the moment. On the upside, above 1.2413 will extend the rebound from 1.2214 to 1.2475 resistance. Break will target 1.2516/2555 key resistance zone. On the downside, however, break of 1.2214 will revive the case of trend reversal and turn outlook bearish.
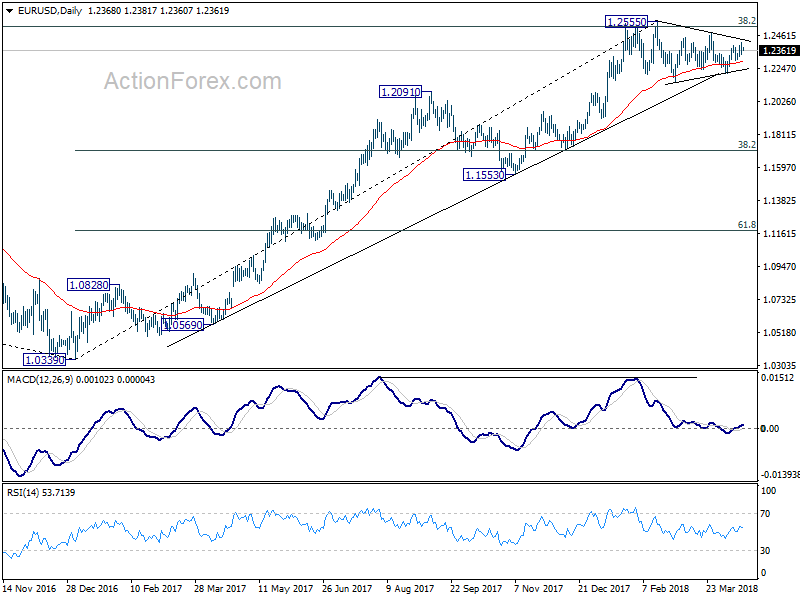
 In the bigger picture, key fibonacci level at 38.2% retracement of 1.6039 (2008 high) to 1.0339 (2017 low) at 1.2516 remains intact despite attempts to break. Hence, rise from 1.0339 medium term bottom is still seen as a corrective move for the moment. Rejection from 1.2516 will maintain long term bearish outlook and keep the case for retesting 1.0039 alive. Firm break of 1.1553 support will add more medium term bearishness. However, sustained break of 1.2516 will carry larger bullish implication and target 61.8% retracement of 1.6039 to 1.0339 at 1.3862 in medium term.
GBP/USD Daily Outlook
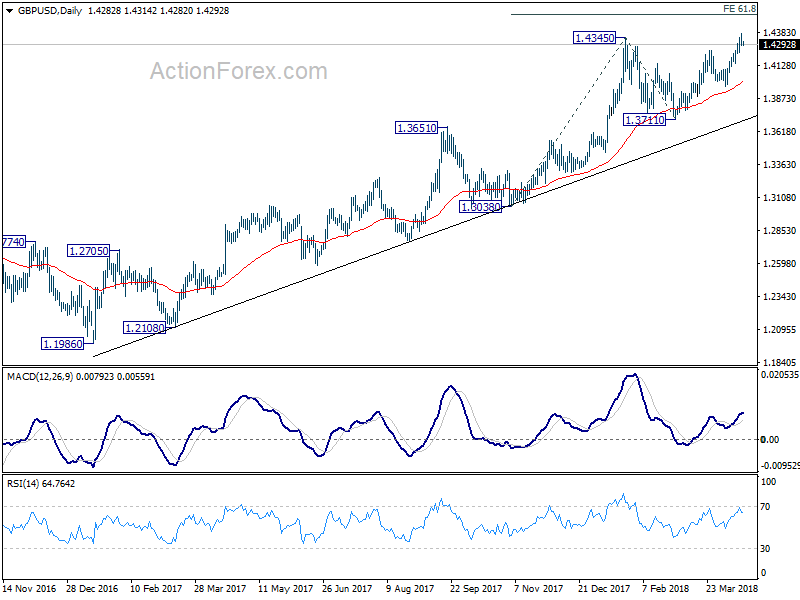
Daily Pivots: (S1) 1.4255; (P) 1.4316; (R1) 1.4350; More...
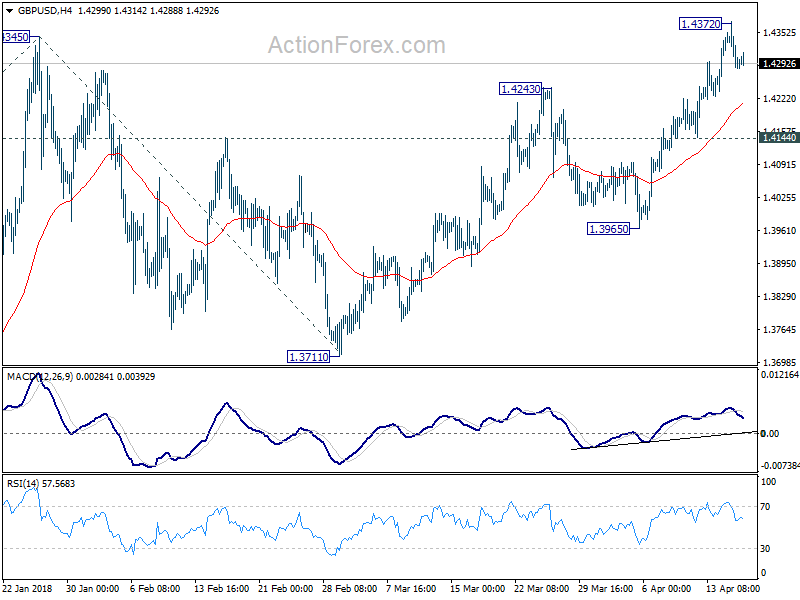
Intraday bias in GBP/USD is turned neutral with a temporary top in place at 1.4372. Some consolidations could be seen. But downside should be contained by 1.4144 minor support to bring another rally. On the upside, break of 1.4372 will resume medium term rise to 61.8% projection of 1.3038 to 1.4345 from 1.3711 at 1.4519 next. However, break of 1.4144 will be and early sign of medium term topping and turn focus back to 1.3965 support first.
 In the bigger picture, rise from 1.1946 (2016 low) is in progress and resuming. It is at least correcting the long term down trend from 2007 high at 2.1161. Further rally would be seen back to 38.2% retracement of 2.1161 (2007 high) to 1.1946 (2016 low) at 1.5466. We'd continue to favor this medium term bullish view as long as 1.3711 support holds, even in case of deep pull back.
USD/CHF Daily Outlook
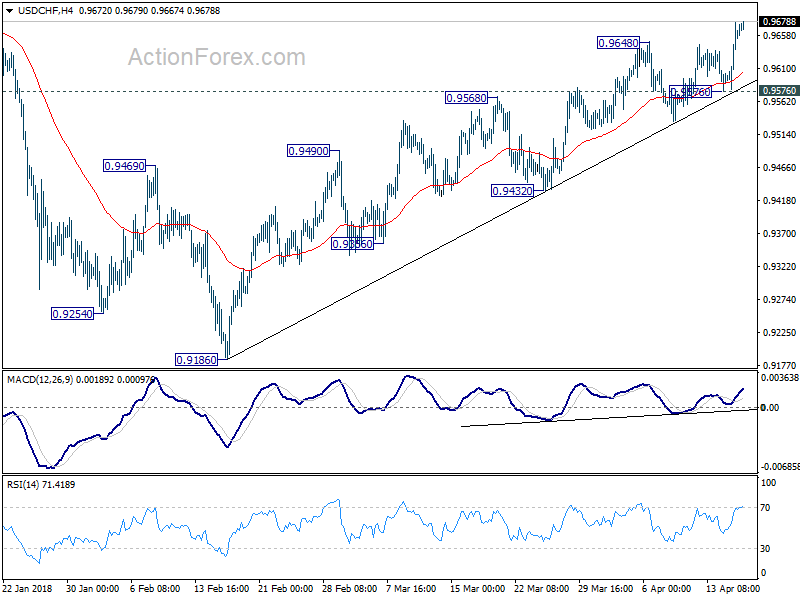
Daily Pivots: (S1) 0.9571; (P) 0.9604; (R1) 0.9631; More...
USD/CHF surges to as high as 0.9677 as rise from 0.9186 resumed. The break of 0.9626 key fibonacci resistance as more credence to the case of medium term reversal. Intraday bias stays on the upside and further rise should be seen to 0.9900 fibonacci level next. On the downside, break of 0.9576 minor support is needed to be the first sign of short term topping. Otherwise, outlook will remain bullish in case of retreat.
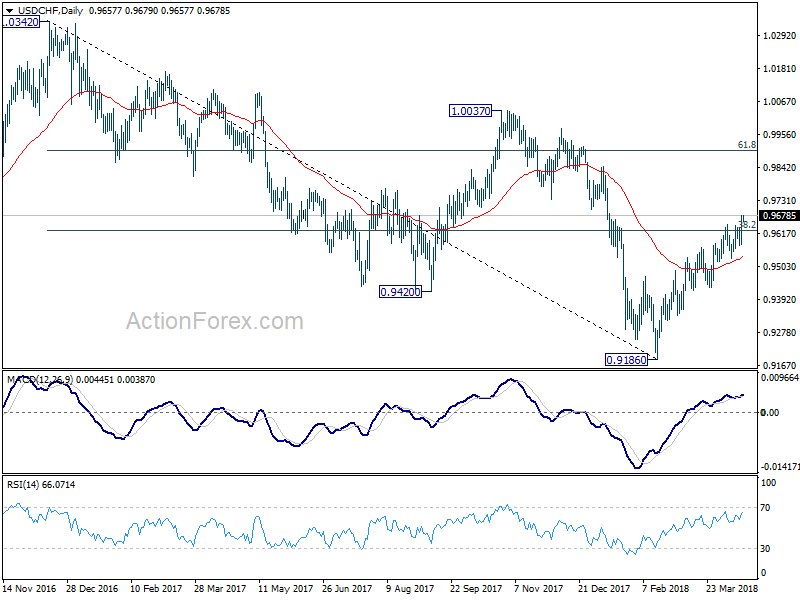
 In the bigger picture, fall from 1.0342 is seen as a medium term down trend. The break of 38.2% retracement of 1.0342 (2016 high) to 0.9186 (2018 low) at 0.9626 suggests that it's likely completed at 0.9186 already. Further rally would be seen back to 61.8% retracement at 0.9900 and above. Sustained break there would pave the way to retest 1.0342 key resistance next.
USD/JPY Daily Outlook
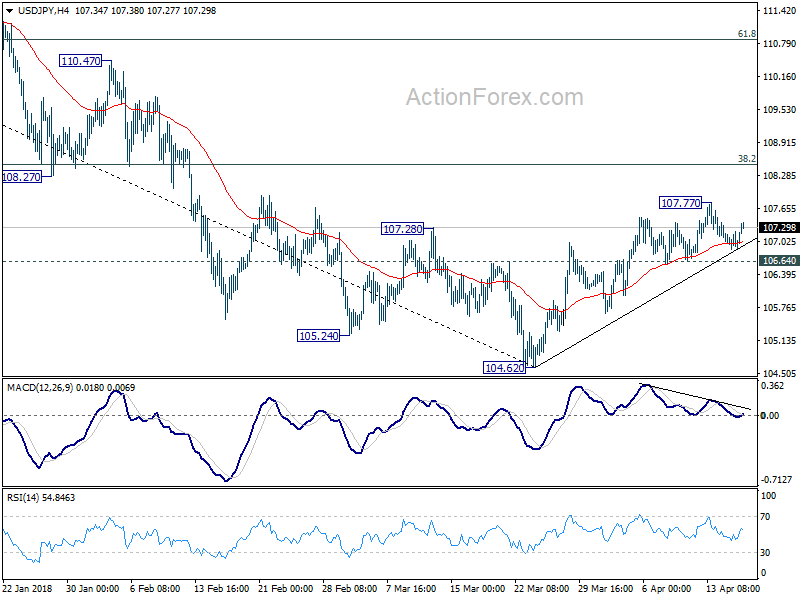
Daily Pivots: (S1) 106.85; (P) 107.03; (R1) 107.18; More...
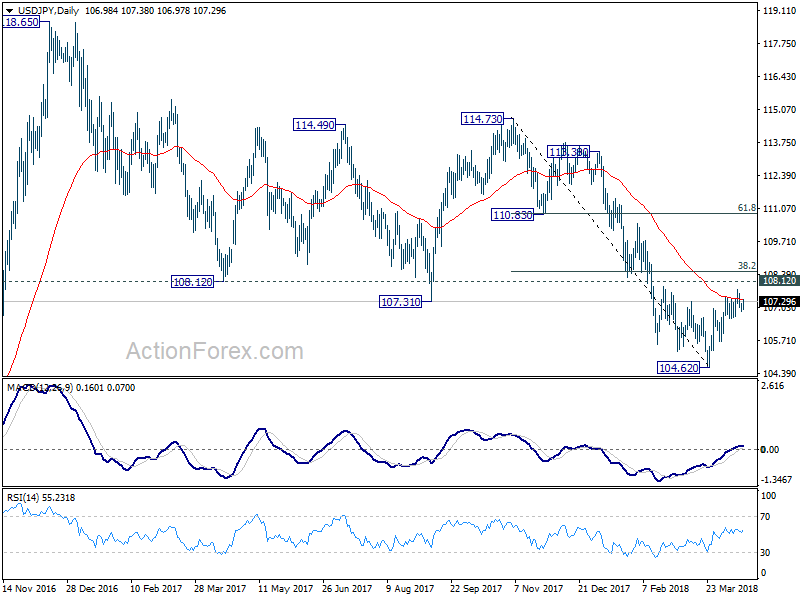
USD/JPY is drawing support from 4 hour 55 EMA again and recovered. But it's staying in range of 106.64/107.77. Intraday bias remains neutral first. Another rise is mildly in favor and break of 107.77 will target 38.2% retracement of 114.73 to 104.62 at 108.48 which is close to 108.12. This level is crucial in determining the medium outlook. On the downside, break of 106.64, however, will indicate the rebound from 104.62 has completed. And in that case, bias will be turned back to the downside for retesting 104.62.
 In the bigger picture, as long as 108.12 support turned resistance holds, the medium term down trend from 118.65 (2016 high) should still continue lower, at least to retest 98.97 (2016 low). However, sustained break of 108.12 will be an early sign of medium term reversal. In that case, further rise would be seen to 114.73 resistance to confirm completion of the fall from 118.65.
AUD/USD Daily Outlook
Daily Pivots: (S1) 0.7755; (P) 0.7773; (R1) 0.7786; More...
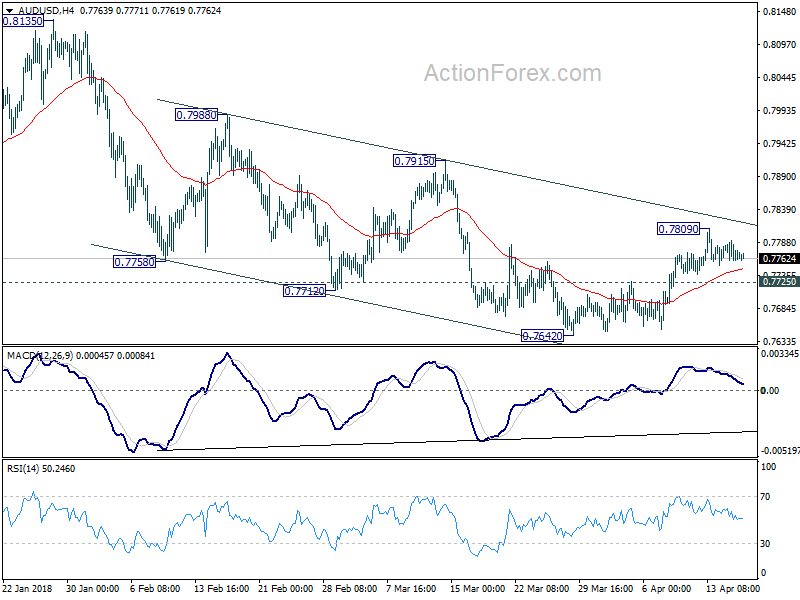
Intraday bias in AUD/USD remains neutral at this point. Further rise remains mildly in favor with 0.7725 minor support intact. Above 0.7809 will target 0.7915 resistance first. Break there will confirm that whole decline from 0.8135 has completed. However, below 0.7725 will bring retest of 0.7642 low instead.
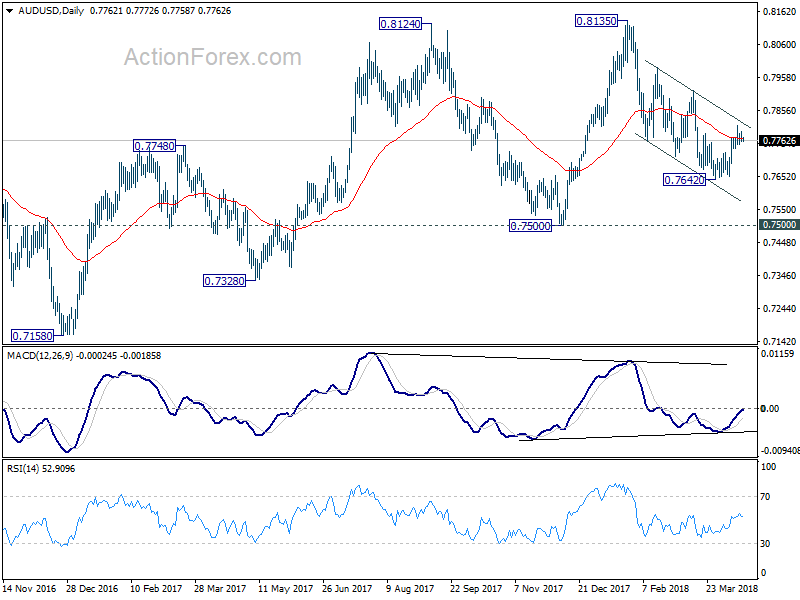
 In the bigger picture, medium term rebound from 0.6826 is seen as a corrective move. It might still extend higher but we'd expect strong resistance from 38.2% retracement of 1.1079 to 0.6826 at 0.8451 to limit upside to bring long term down trend resumption. On the downside, break of 0.7500 support will now be an important signal that such corrective rebound is completed. In that case, AUD/USD would be heading back to 0.6826 low in medium term.
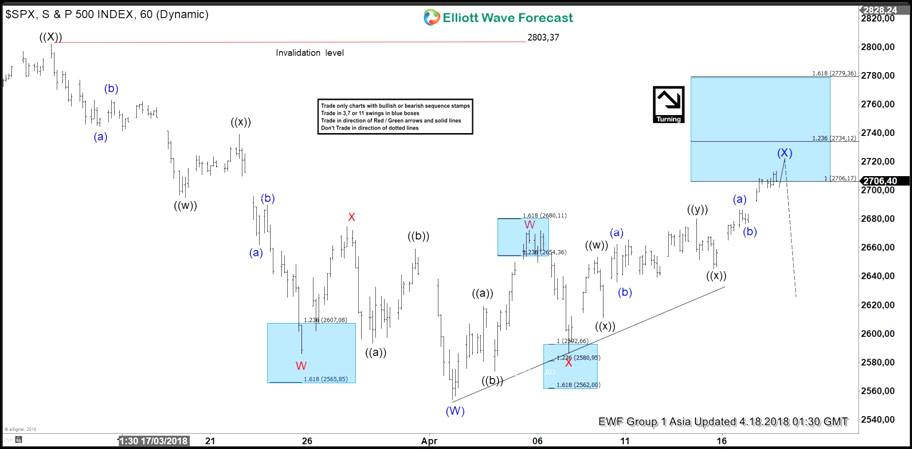
Elliott Wave View: SPX Calling Reaction Lower Soon
SPX Elliott Wave view in short-term cycles suggest that the bounce to 3/13 high (2803.37) ended primary wave ((X)). Down from there, primary wave ((Y)) remains in progress as a double three Elliott Wave structure. The internal distribution of wave ((Y)) shows overlapping structure, thus favored it to be a corrective sequence i.e either W.X.Y or W.X.Y.X.Z.
Down from 3/13 high (2803.37), Intermediate wave (W) of ((Y)) ended at 2553.53 low as double three structure. Above from there, Intermediate wave (X) bounce remains in progress to correct cycle from 3/13 high. The internals of Intermediate wave (X) bounce is also unfolding as Elliott Wave Double Three structure where Minor wave W ended in 3 swings at 2672.08 and Minor wave X ended at 2586.27. Above from there, Minor wave Y remains in progress as Triple three structure, which has already reached the 100%-123.6% Fibonacci extension area of W-X at 2706.17-2734.12. The internals of wave Y ended Minute wave ((w)) at 2653.55, Minute wave ((x)) at 2610.79, Minute wave ((y)) ended at 2680.26, and Minute second wave ((x)) ended at 2645.05 low. Near term, as far as a pivot from 3/13 high (2803.37) remains intact, expect Index to resume lower in intermediate wave (Y) or pullback in 3 swings at least. We don’t like selling it.
SPX Elliott Wave 1 Hour Chart