Sample Category Title
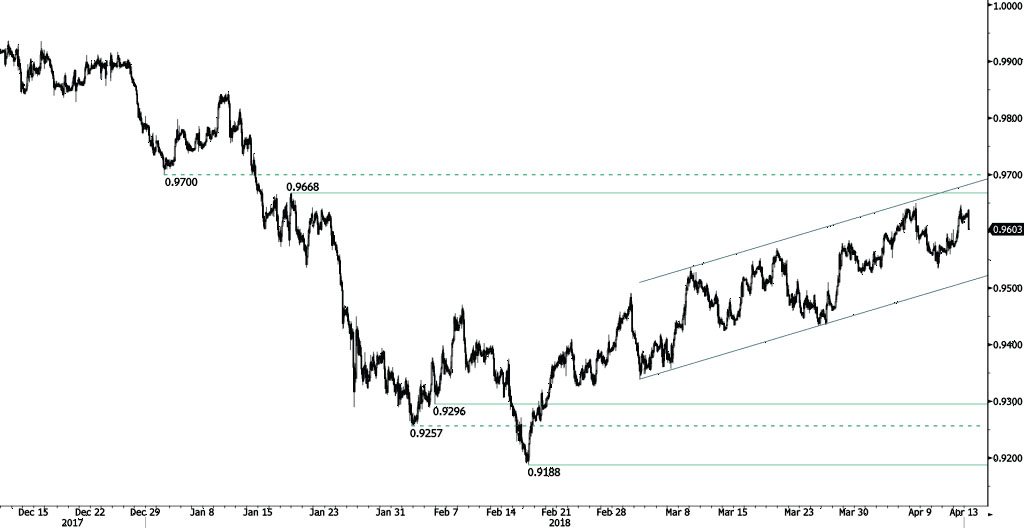
USD/CHF Weakening
USD/CHF is weakening from 0.9646 low, heading along the 0.96 range. The bullish pattern started from 0.9188 (16/02/2018 low) continues. The pair is contained between hourly support and resistance given at 0.9296 (05/02/2018 low) and 0.9668 (17/01/2018 high). The technical structure suggests short-term downward moves.
In the long-term, the pair is still trading in range since 2011 despite some turmoil when the SNB unpegged the CHF. Key support lies at 0.9072 (07/05/2015 low) while resistance at 1.0344 (15/12/2016 high) is distanced. The technical structure favours a long term bullish bias since the unpeg in January 2015.
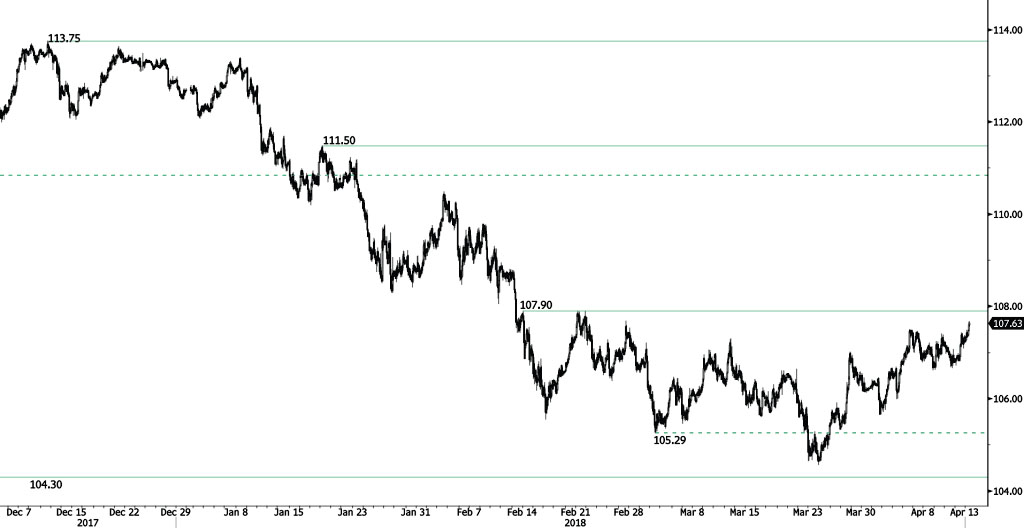
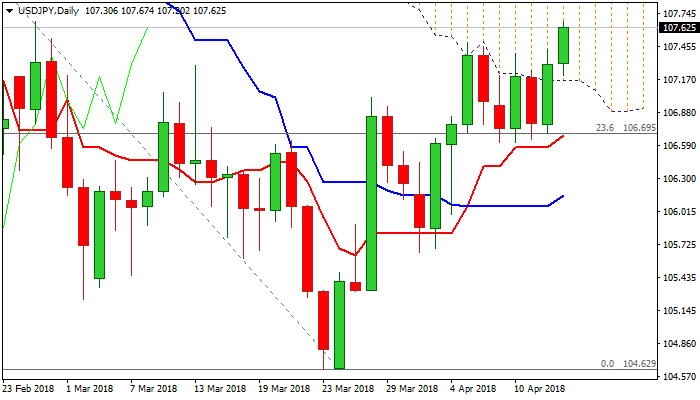
USD/JPY Strong Resistance At 107.90
USD/JPY bounce from 106.65 low continues, heading along the 107.70 range. The bearish pattern started in January 2018 is somewhat weakening. Hourly support and resistance are given at 104.30 (08/11/2016 low) and 107.90 (14/02/2018 high). The short-term technical structure suggests continued short-term upward moves.
We favor a long-term bearish bias. Support remains at 101.20 (09/11/2016 low). A gradual rise toward the major resistance at 125.86 (05/06/2015 high) seems unlikely. Expected to decline further support at 101.20 (09/11/2016 low). The pair trades below its 200 DMA.
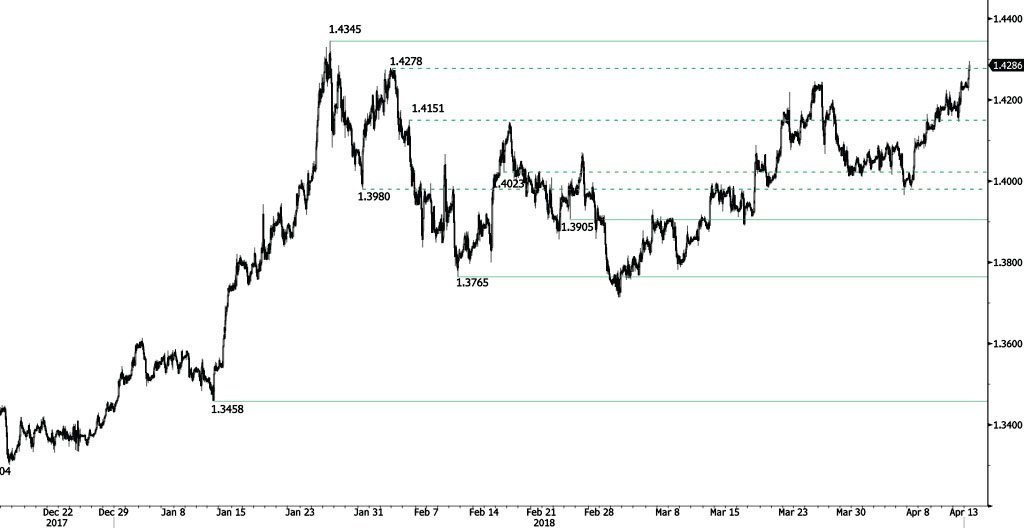
GBP/USD Edging Higher
GBP/USD increase starts back, breaking hourly resistance at 1.4278 (02/02/2018) and heading along the 1.4295 range. Hourly support and resistance are now given at 1.3905 (23/02/2018 low) and 1.4345 (25/01/2018 high). The technical structure suggests short-term upward moves.
The long-term technical pattern is reversing. The Brexit vote had paved the way for further decline but the pair is moving to 2016 highs. Long-term support and resistance are given at 1.1841 (07/10/2017 low) and 1.5018 (24/06/2016 high).
EUR/USD Trying To Bounce
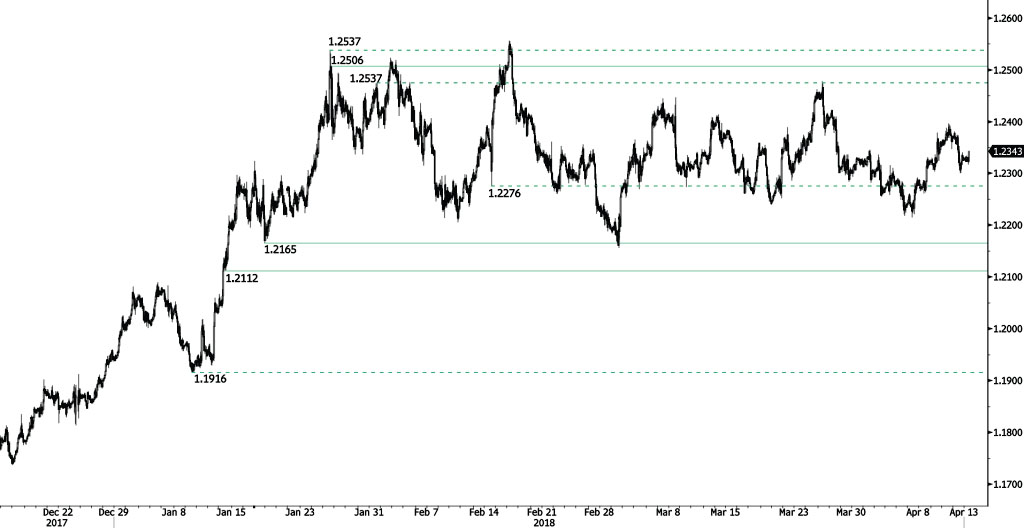
EUR/USD is bouncing off from 1.23 low, heading along the 1.2345 range. The pair is currently maintained between hourly support and resistance given at 1.2165 (17/01/2018 low) and 1.2506 (25/01/2018 high). The technical structure suggests short-term increase.
In the longer term, the momentum is turning largely positive. We favor a continued bullish bias. Key resistance is holding at 1.2886 (15/10/2014 high) while strong support lies at 1.1554 (08/11/2017 low).
Bitcoin Rush Is Not Over
Indian inflation data stabilized
Reserve Bank of India (RBI) monetary policy meeting decision to maintain its key rate at 6% last Thursday rather than reduce it by 25 basis points shows that it got it right. Indian inflation was contained during first quarter 2018 period, with March consumer price index given at +4.28% (prior: +4.44%) and below its 3-year average of +4.37%, supported by stable price components and particularly from Food and Beverages (+3%), accounting for 54% of the index as well as Fuels and Lighting (+5.73%) which could drastically impact inflation data due to India’s large oil imports. February industrial production points the same way, given at +7.10% (prior: +7.40%) and maintained at 2 years highs, signaling strong economic momentum for the beginning of the year.
Recent economic data had a positive impact on equity markets, valued at 34’300 (+1.44% year-to-date) and increasing by +2.01% since Monday. 2-year, 10-year and 30-year treasury yields keep increasing since the beginning of the year as investor sentiment continues to improve.
Accordingly, we suspect RBI to maintain its repo rate at 6% for the near term, expectations supported by RBI’s 12-month inflation forecast given in the range of 4.50% - 4.60%, signaling a rather stable price outlook.
USD/INR strong rise started in January is faltered since mid-February. The currency currently valued at 65.25 is expected to trade sideways in the short-term, maintained at the 65.30 range.
Bitcoin recovery bounce?
Bitcoin has surged more than US$1,000 from below $7,000 to around $8,050 in a bizarre surge that follows months of bearish consolidation. Its rise is pulling the rest of crypto sector higher. Technicians say the technical break of $7,450 triggered a surge in Bitcoin buying.
Despite talk of a crypto bubble, there remain significant investors who believe crypto will rally. Developments behind the scenes include new technology that will power faster transactions, blockchain projects and open-minded regulators: all will spark the next wave of crypto accumulation. Or perhaps price apprecation was Arnaud Masset (and Yann Isola) killer Crypto presentation yesterday in Geneva?
AUDUSD – Rally On Fresh Risk Sentiment Pressures Key Barriers Of 200SMA And Daily Cloud Base
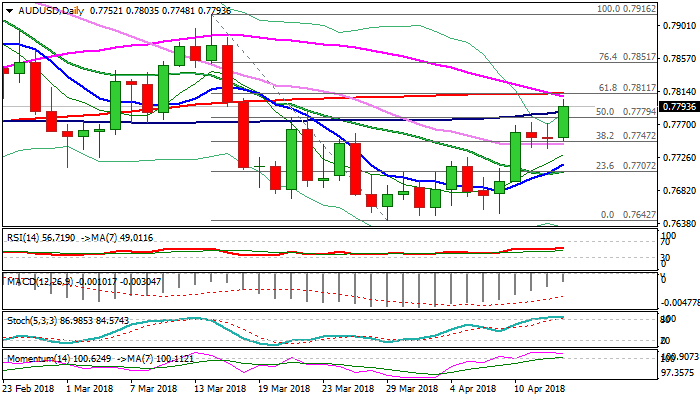
The Aussie dollar regained traction on Friday and resumed recovery rally from 0.7640 base, which was interrupted by two-day consolidation.
Fresh bullish acceleration was triggered by renewed bullish sentiment in the market and cracked and hit new one-month high at 0.7803 on probe through psychological 0.7800 barrier.
Bulls pressure pivotal barrier at 0.7811 (Fibo 61.8% of 0.7916/0.7642 descend / falling 200SMA) and turn focus towards strong barrier at 0.7834 (base of thickening daily cloud).
Weekly close above 0.7811 would generate bullish signal for further recovery, as near-term base has formed at 0.7640 zone.
Broken 100SMA (0.7786) which previously marked strong barrier, now offers immediate support ahead of sideways-moving 30SMA (0.7744) which is expected to keep to keep the downside protected.
Res: 0.7811, 0.7834, 0.7851, 0.7885
Sup: 0.7786, 0.7744, 0.7716, 0.7708
GBPJPY Accelerates And Records 2-Month High Near 154.00
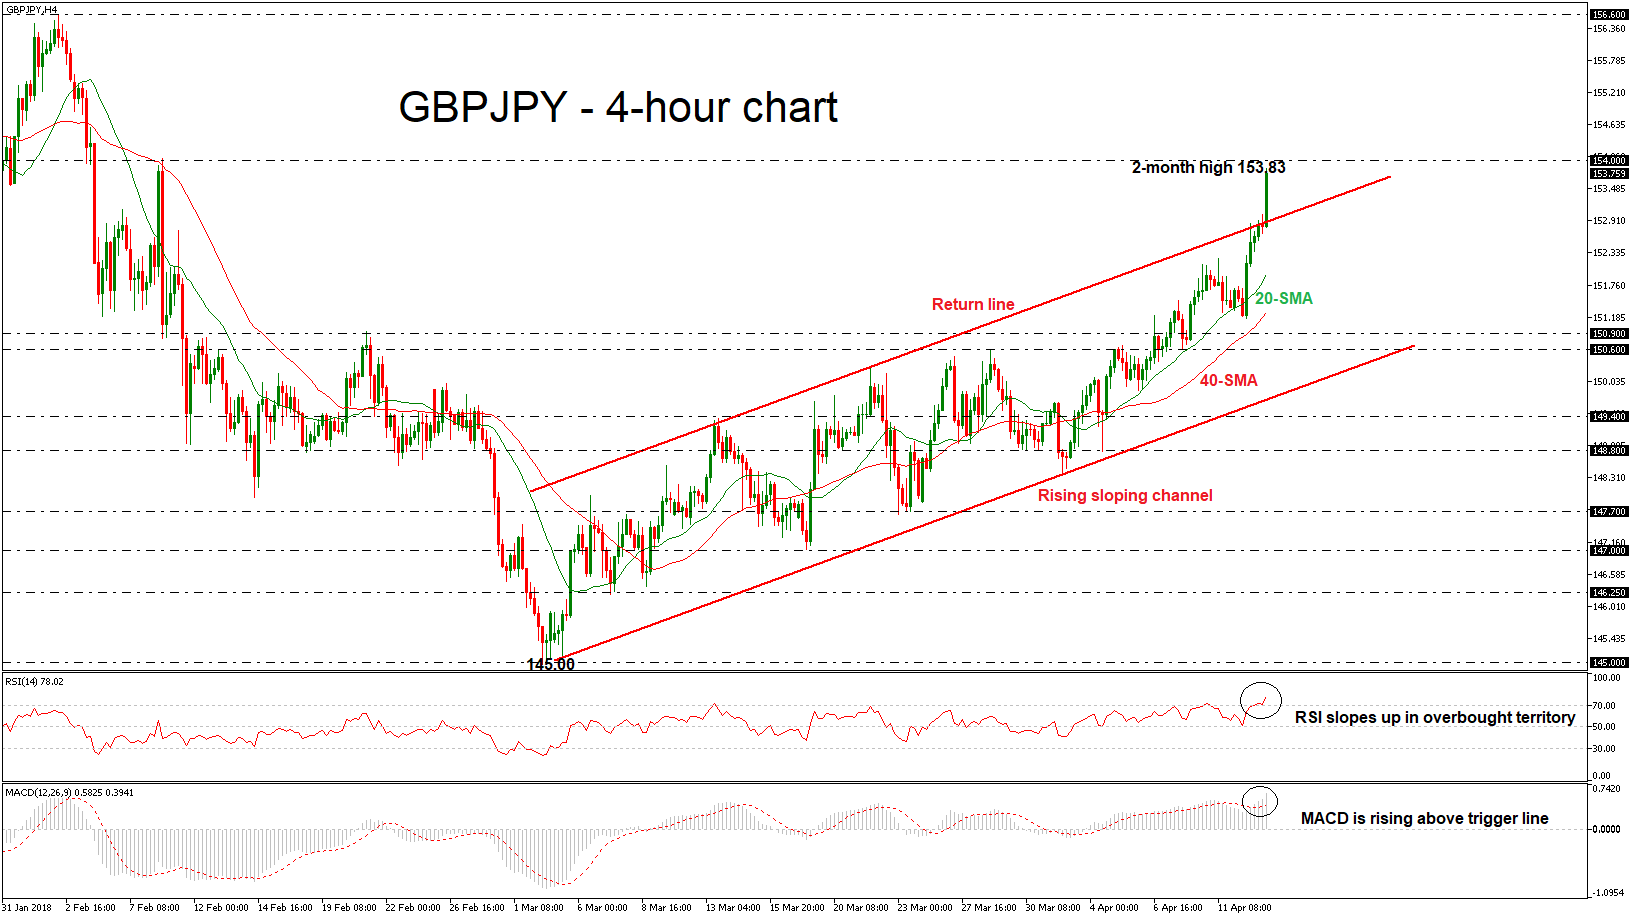
GBPJPY is rising aggressively and reached a two-month high of 153.83 during today’s European session. The pair has surpassed successfully the upward sloping channel, which has been holding since March 5, indicating that the bullish extension continues. The technical indicators, continue to send bullish signals, suggesting that the strengthens in the market is not over yet.
In the 4-hour chart, the RSI is pointing upwards at overbought levels, slightly above 70 indicating that the market could strengthen a little bit in the short-term until the index falls below that threshold. The MACD also supports a bullish picture, as the indicator continues to increase positive momentum above its red-trigger line.
Should the price extend its uptrend, the next critical resistance level to have in mind is the 154.00 handle. A session close above this level could drive the pair towards the next key level of 156.60, taken from the peak on February 2.
However, if the market fails to pick up speed, the 20-simple moving average (SMA) at 151.93 could offer nearby support ahead of the 40-SMA which currently stands at 151.25 at the time of writing. A slip below these levels could touch the 150.90 barrier, raising chances for further downside pressure.
EUR/GBP Indecision Between Trend Line Diagonals
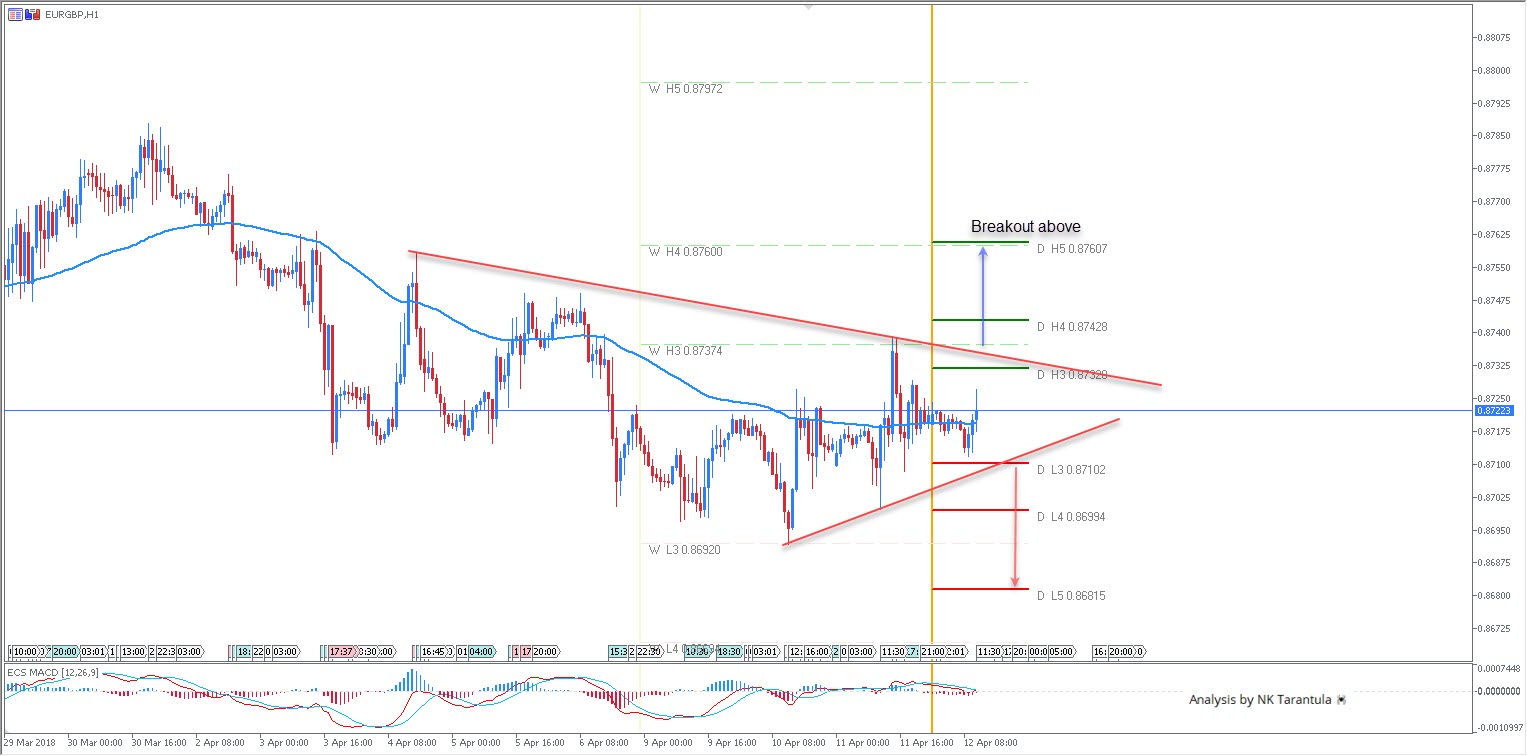
The EUR/GBP has been trapped within the narrow range of W L3 and W H3 Pivot. Slow price action indicates that we might expect a breakout when volatility gets higher. At this point, the price is stalling between the two trend line diagonals that also intersect essential pivot points. Break of W H3 – 0.8737 should target 0.8760 and possibly 0.8792. However a break of D L3 – 0.8710 should target 0.8680. The EUR/GBP ATR is low, so pay attention to breakouts and corresponding targets.
W L3 - Weekly Camarilla Pivot (Weekly Interim Support)
W H3 - Weekly Camarilla Pivot (Weekly Interim Resistance)
W H4 - Weekly Camarilla Pivot (Strong Weekly Resistance)
D H4 - Daily Camarilla Pivot (Very Strong Daily Resistance)
D L3 – Daily Camarilla Pivot (Daily Support)
D L4 – Daily H4 Camarilla (Very Strong Daily Support)
POC - Point Of Confluence (The zone where we expect price to react aka entry zone)
USDJPY – Bulls Eye Target At 108 And Could Extend Further After Eventual Break And Close Above Daily Cloud...
The pair stands at the front foot on Friday and hit seven-week high at 107.67, in extension of Thursday’s rally.
Easing geopolitical tensions triggered fresh risk sentiment which lifted the greenback.
Yesterday’s close above 55SMA (107.05) and daily cloud base (107.16) generated strong bullish signal which was confirmed by today’s extension above previous recovery high at 107.50.
Bulls now eye next pivotal barrier at 107.97 (Fibo 38.2% of 113.38/104.63 fall), with weekly close above here to generate another strong bullish signal.
Further support to dollar comes from President Trump’s efforts to reach better TPP trade agreement with Japan and in combination with lowered tensions in Syria and bullish techs, could drive the pair higher for test of next key barrier at 109.31 (daily cloud top, reinforced by falling 100SMA).
Broken pivots at 107.16 (cloud base) and 107.04 (55SMA, turning sideways) provide solid supports which should keep the downside protected.
The pair is on track for the third straight bullish weekly close which adds to positive short-term outlook.
Res: 107.97, 108.28, 108.77, 109.00
Sup: 107.50, 107.16, 107.04, 106.92
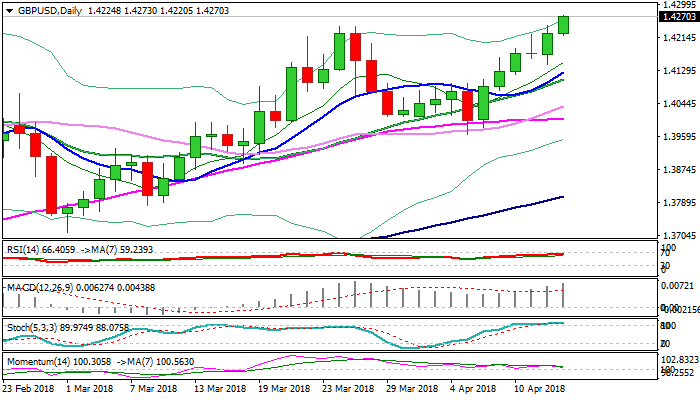
GBPUSD – Bulls Probe Above Key Barriers – Former Top/Weekly 200SMA
Cable maintains bullish tone on Friday and extends above former high at 1.4244 (26/27 Mar double-top), probing above next strong barrier at 1.4255 (falling weekly 200SMA). Uninterrupted rally from 1.3965 (05 Apr trough) extends into sixth straight day) and looking for strong bullish signal on weekly close above 1.4244/55 pivots. Bulls eye next target at 1.4300 (Fibo 123.6% projection of the upleg from 1.3965) and could attack key med-term barrier at 1.4345 (post- Brexit recovery high, posted on 25 Jan). Bullish daily techs support the notion, however, overbought slow stochastic requires caution. Broken barriers at 1.4255/44 now act as initial supports, with stronger dips to be contained above rising 10SMA (1.4123) to keep bulls in play.
Res: 1.4277, 1.4300, 1.4345, 1.4400
Sup: 1.1.4255, 1.4244, 1.4200, 1.4144