
Sample Category Title
EURUSD – Thick Daily Cloud Continues To Underpin But The Downside is Still Vulnerable
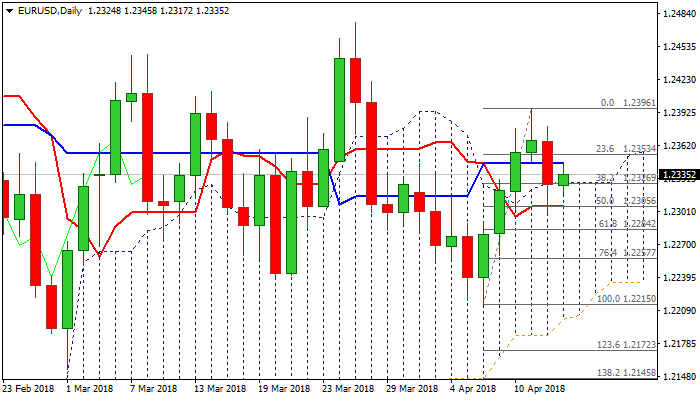
The Euro moved higher in early European trading on Friday, boosted by EUR/JPY buying on renewed risk sentiment. Thursday's failure close below daily cloud top, despite spike deeply in the cloud and today's bounce, sidelined immediate downside risk on formation of reversal pattern. However, dovish ECB minutes, released on Thursday, may further affect near-term performance. Weak momentum studies and south-heading slow stochastic after reversal from overbought territory, keep the downside vulnerable, despite fresh recovery probe above a cluster of MA's (20/30/55). On the other side, thick daily cloud continues to underpin (cloud top lies at 1.2327, reinforced by Fibo 38.2% of 1.2215/1.2396), but recovery needs to regain yesterday's high (1.2379) to neutralize downside risk. Today's close is expected to give fresh indication for near-term direction. Close below cloud top would signal further weakness, while bullish bias is expected to remain in play while cloud top holds.
Res: 1.2345, 1.2379, 1.2400, 1.2446
Sup: 1.2327, 1.2317, 1.2300, 1.2284
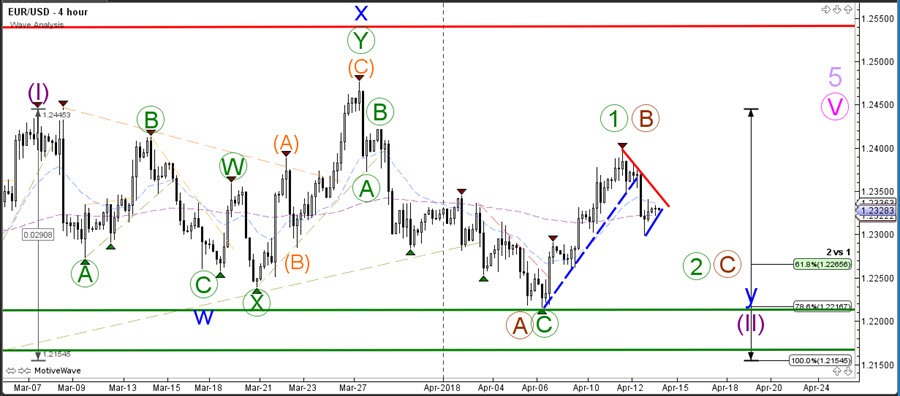
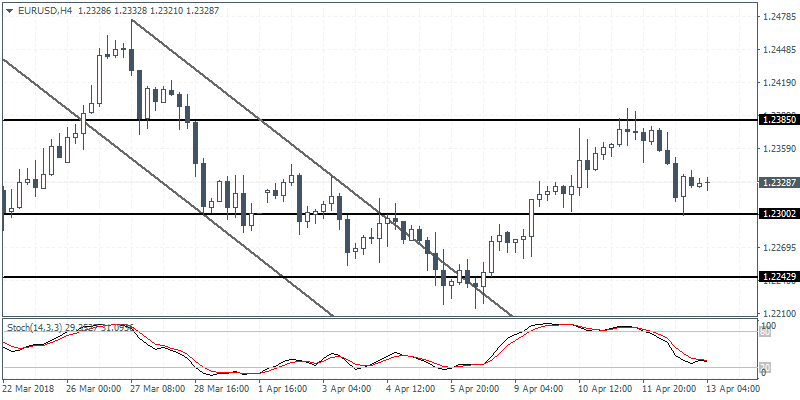
EURUSD Preparing For Bearish ABC Zigzag Pattern
The EUR/USD uptrend channeldid indeed break as mentioned in yesterday’s analysis (EUR/USD losing steam). The bearish breakout could lead towards a larger bearish correction, although a bullish bounce remains possible in this choppy environment. The key question is whether price is building a bearish correction within the uptrend (wave 2 green) or a bearish impulse within a larger ABC zigzag (brown).The answer will depend on the breakout direction and momentum on the 1hour chart.
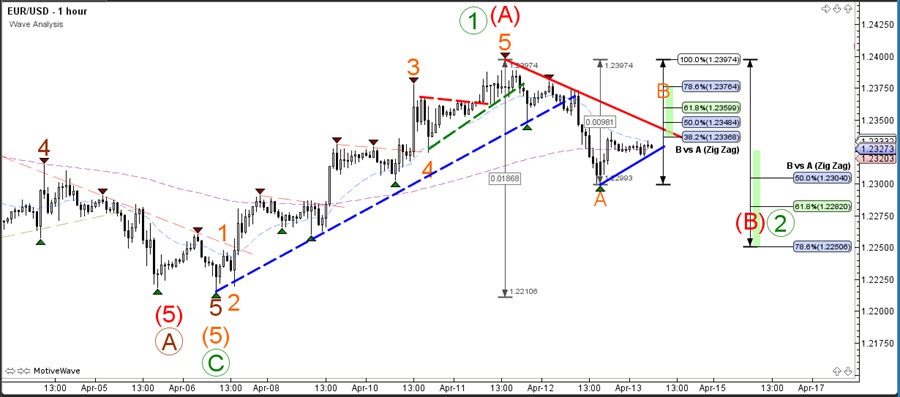
The EUR/USD made a bearish break below the support (blue) trend line, which could indicate a larger bearish ABC correction. A break above the 100% Fib level of wave B (orange) could indicate an uptrend continuation rather than an ABC correction. The wave count be part of a larger wave 2 (green), wave B (red) or even wave C of wave 2 (brown 4 hour chart) and whether price moves quickly or correctively will provide more information about the wave patterns.
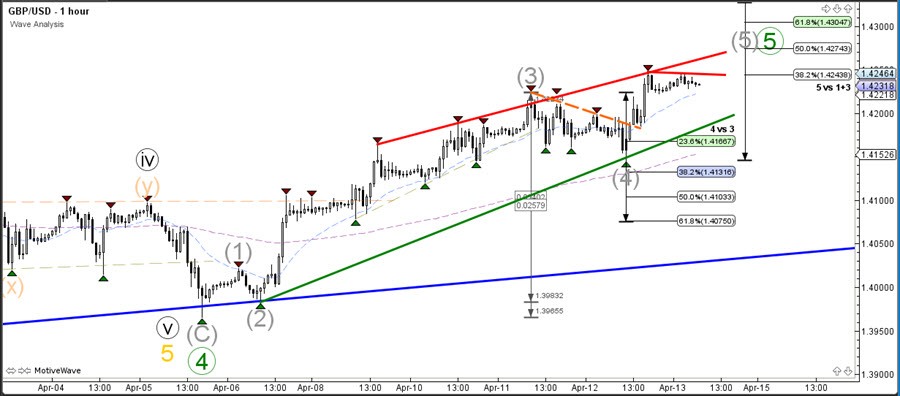
The GBP/USD is in a strong bullish trend and moving higher as part of the 5th wave (green).
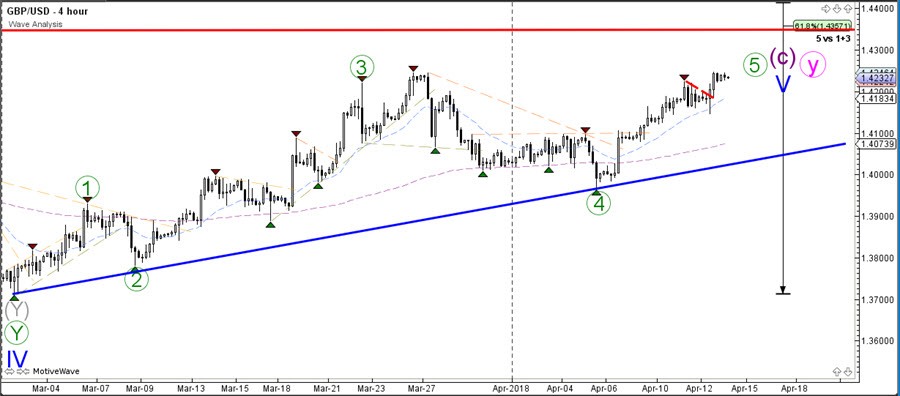
The GBP/USD completed a wave 4 (grey) retracement pattern and now is building a bullish wave 5 (grey) continuation. A break above the resistance levels (red) could price continue higher but potential targets are nearby at 1.4275, 1.43, 1.4325
Forex Technical Analysis: EUR/USD, USD/JPY, GBP/USD
EUR/USD
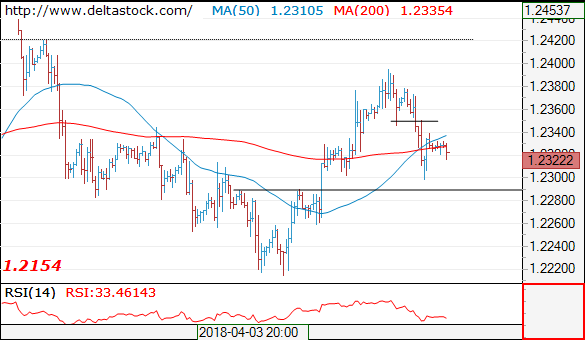
Current level - 1.2322
Yesterday's slide has bottomed at 1.2298 and my outlook is already bullish, for a rise towards 1.2420 area. Initial intraday resistance lies at 1.2350.
| Resistance | Support | ||
| intraday | intraweek | intraday | intraweek |
| 1.2350 | 1.2560 | 1.2290 | 1.2160 |
| 1.2420 | 1.2560 | 1.2210 | 1.2090 |
 USD/JPY
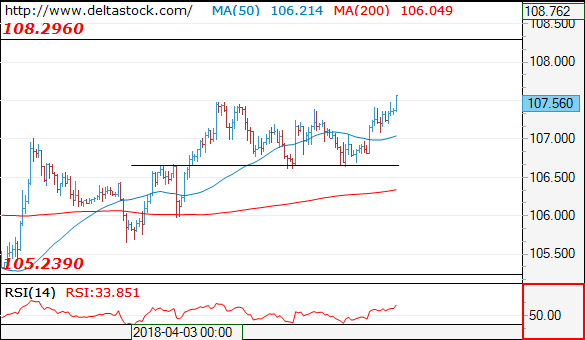
Current level - 107.56
The bias remains bullish after the rebound at 106.60, for a rise towards 108.30 area.
| Resistance | Support | ||
| intraday | intraweek | intraday | intraweek |
| 107.90 | 108.30 | 106.60 | 105.20 |
| 108.30 | 110.40 | 105.60 | 104.60 |
GBP/USD
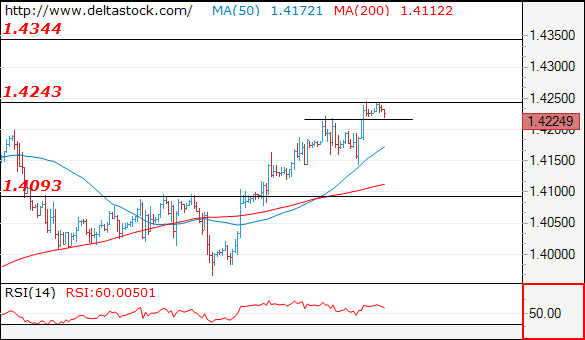
Current level - 1.4224
The reversal at 1.4145 signals a renewal of the uptrend and the bias is positive, for a break through 1.4240, towards 1.4340 peak. Initial intraday support lies at 1.4215.
| Resistance | Support | ||
| intraday | intraweek | intraday | intraweek |
| 1.4240 | 1.4340 | 1.4215 | 1.3910 |
| 1.4340 | 1.4340 | 1.4145 | 1.3710 |
USDCAD Edges Sharply Lower, Upward Sloping Channel Still Holds In Medium Term
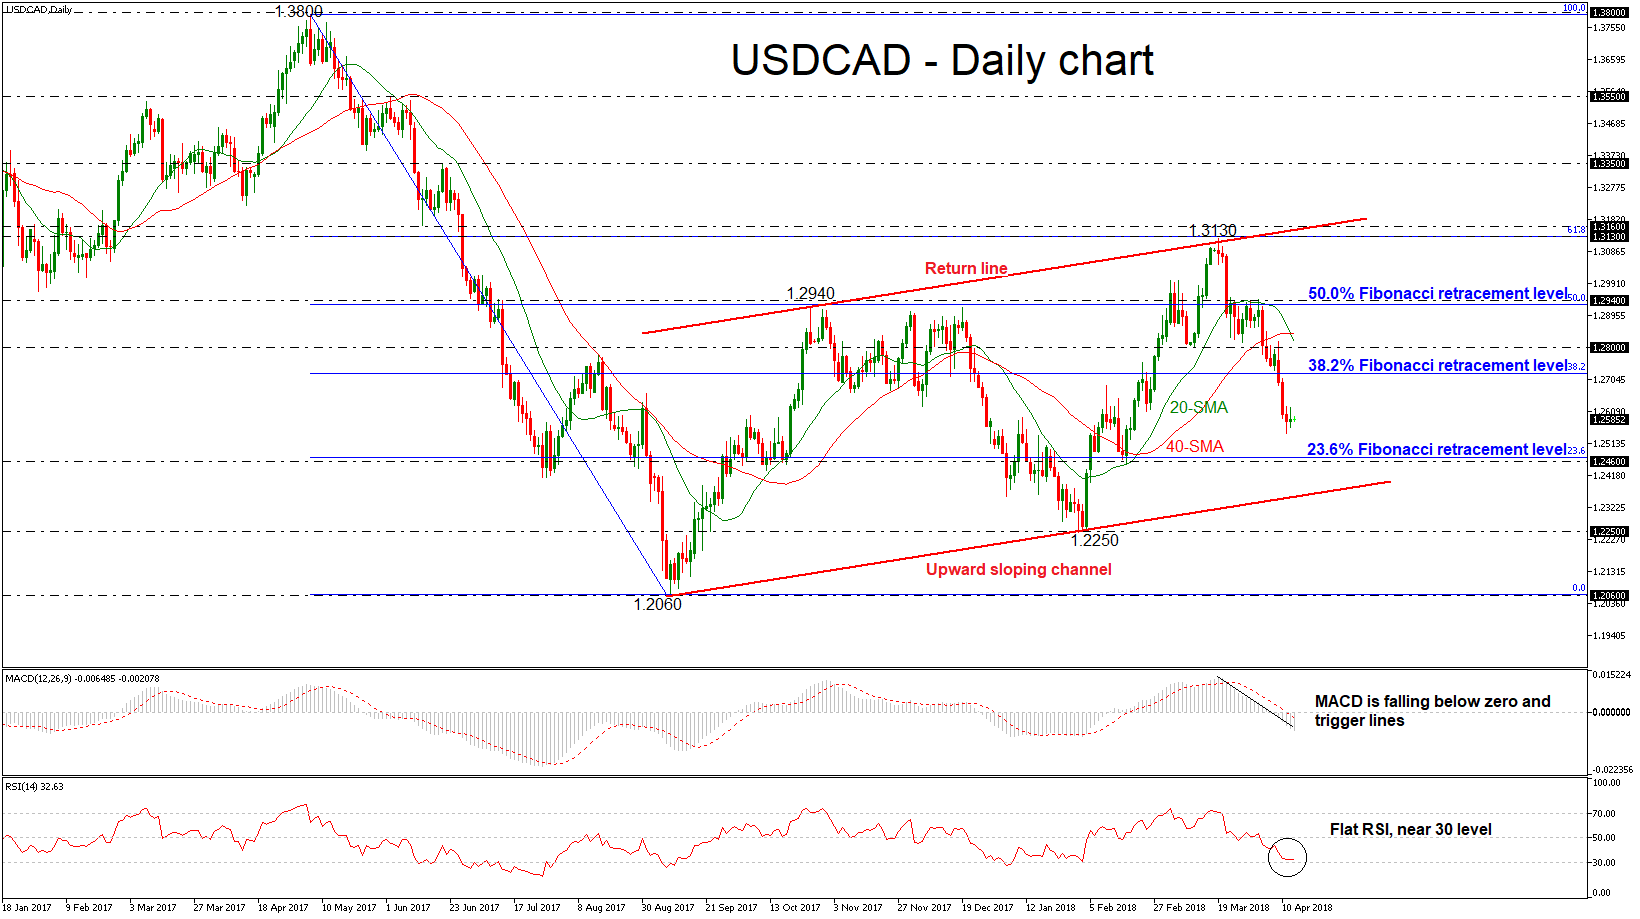
USDCAD has been posting an aggressive downside rollercoaster since the previous weekly session, failing to climb above the 50.0% Fibonacci retracement level around 1.2940 of the downleg from the high of 1.3800 to the low of 1.2060. It is worth mentioning that the pair has been developing within an upward sloping channel over the last seven months.
Prices have reversed sharply lower and momentum indicators remain in bearish territory, suggesting fresh losses as the immediate risk is to the downside. The MACD oscillator is falling below the trigger line and is standing well below the zero line. However, the RSI indicator is flattening near the oversold area, losing its strong negative momentum. The 20-day simple moving average (SMA) completed a bearish cross with the 40-day SMA, signaling further declines.
Should the pair manage to strengthen its negative momentum, the next support could come around 23.6% Fibonacci mark near the 1.2460 barrier. A break below the aforementioned hurdle could open the way towards the next key support, touching the ascending trend line around the 1.2400 psychological level.
However, should an upside reversal take form, immediate resistance will likely come from the 38.2% Fibonacci level of 1.2720, followed by the 1.2800 handle. A bullish run above these levels and the bearish cross within the SMAs, could shift the bias back to bullish one with the next resistance coming from the 1.2940 strong obstacle.
Markets Turn Optimistic As Risks Moderate, U Of M Consumer Sentiment Survey Eyed In US
Here are the latest developments in global markets:
FOREX: The US dollar index traded higher on Friday, but by less than 0.1%, extending the gains it posted yesterday as geopolitical and trade risks moderated, and the yields on longer-term US Treasuries surged. The yen traded 0.2% lower against both the euro and the dollar, as the risk-on environment curtailed demand for the safe haven Japanese currency.
STOCKS: US markets closed higher, boosted by signals that the situation in Syria may not escalate after all, and hints from the US administration that it may finally join the Trans-Pacific Partnership (TPP) trade deal, which it previously rejected. The Dow Jones led the pack, gaining 1.2%, while the Nasdaq Composite and the S&P 500 climbed by 1.0% and 0.8% respectively. That said, futures tracking the Dow, S&P, and Nasdaq 100 are mixed, pointing to a slightly higher open for the Dow today, but a lower one for the S&P and Nasdaq 100. The risk-on sentiment was evident in Japan today, with the Nikkei 225 and the Topix rising by 0.55% and 0.6% correspondingly. In Hong Kong, the Hang Seng was practically unchanged. In Europe, futures tracking most of the major indices were flashing green.
COMMODITIES: Oil prices pulled back on Friday, with both WTI and Brent declining by nearly 0.3%. This modest correction is likely owed to the fact the US may not attack Syria in the end, following tweets from President Trump suggesting as much. That said, one has to note that this correction is extremely small compared to the spectacular surge in oil prices earlier in the week, after the US said it may strike Syria. This suggests either that there are still concerns the Syrian situation could impact oil production elsewhere in the Middle East, or that other factors were at play in pushing prices higher recently. In precious metals, gold is 0.2% higher today, recouping some of the significant losses it posted yesterday as geopolitical concerns eased.
Major movers: Risk appetite returns as geopolitical and trade risks moderate
Thursday was another rollercoaster ride in markets, with the general theme being an improvement in risk sentiment as anxieties around geopolitics and protectionism declined. The risk-on moves followed a tweet from the US President suggesting a military action in Syria may not be so imminent after all, aiding speculation that a US-Russia standoff may be averted. Safe havens such as the yen and gold started to crumble, while US stock futures surged, helping the major indices to open higher.
Later in the day, these moves were exacerbated by news the US may join the Trans-Pacific Partnership (TPP), a trade deal the US pulled out of after President Trump was elected, and that the President criticized extensively on the election trail. This signal, alongside comments from Trump that “now we’re really negotiating” with China, likely heightened speculation that a trade war may be never occur, and that all the recent rhetoric was simply posturing ahead of crucial talks.
In the big picture, US-China trade risks seem to be gradually easing, and while the US may still attack Syria, any strike appears increasingly more likely to be an isolated event as opposed to the beginning of a prolonged military operation. Judging by the latest market moves, investors seem to be siding with this view as well, and barring some unforeseen headline that alters this outlook, risk appetite could remain supported for a while. The key risk to this argument is a WSJ report that circulated overnight, suggesting the US plans to introduce new tariffs against China next week. While this was largely overlooked by markets, if true, it may trigger a further deterioration in sentiment before the situation improves.
Elsewhere, the euro underperformed yesterday, after the March ECB minutes were perceived as dovish. Policymakers discussed downside risks emanating from a potential escalation in trade conflicts, while also expressing concerns that a euro appreciation may weigh on inflation.
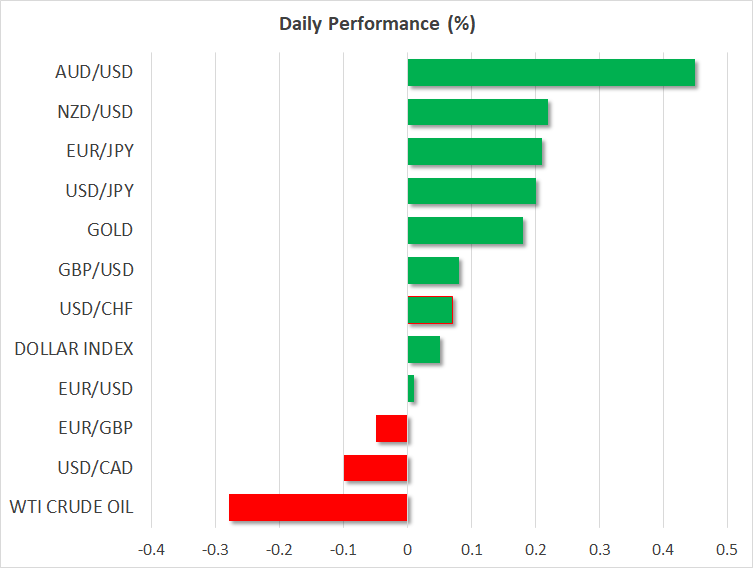
The commodity-linked currencies are all on the front foot today, with aussie/dollar gaining 0.4% and reaching a one-month high, while kiwi/dollar rose by 0.2%. The loonie was also marginally higher against the US dollar.
Day ahead: JOLTS job openings and University of Michigan survey due out of US
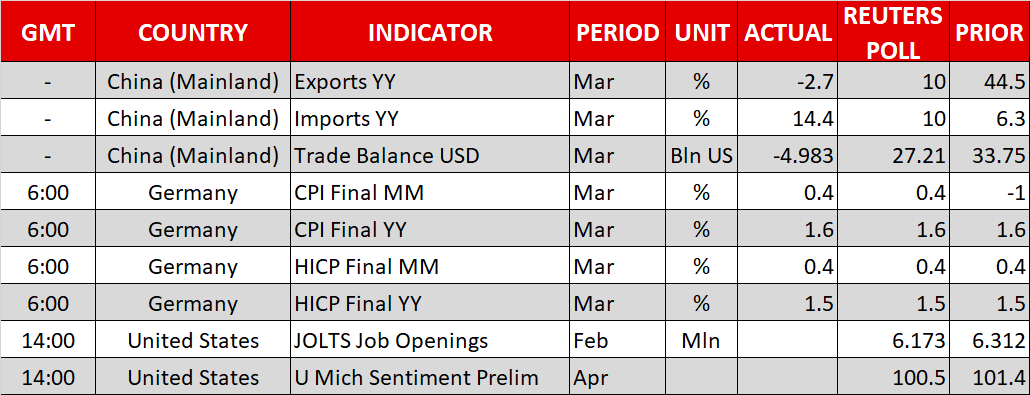
The calendar is mostly empty of important releases on Friday, barring a few readings out of the US that are expected to generate interest. In the absence of data, market participants may remain focused on developments on the geopolitical & trade fronts.
February’s JOLTS job openings report and the preliminary University of Michigan report on consumer sentiment for the month of April have the capacity to lead to positioning on the US currency. Both prints are scheduled for release at 1400 GMT. The University of Michigan consumer sentiment index is anticipated to ease a bit – though still remain at elevated levels – after rising to a more-than-a-decade high in March. Besides the headline figure, the surveys gauging the inflation outlook will also be of particular importance.
Of significance to oil traders will be the US Baker Hughes oil rig count due at 1700 GMT.
In equites, JPMorgan Chase, Citigroup and Wells Fargo are among companies releasing quarterly earnings results on Friday; all three are reporting before Wall Street’s opening bell. Beyond corporate releases, any updates on global trade issues or the conflict in Syria have the capacity to drive sentiment as well.
Regional Fed Presidents Eric Rosengren, James Bullard and Robert Kaplan will be making public appearances at 1130 GMT, 1300 GMT and 1700 GMT respectively. None of them holds voting rights within the FOMC in 2018. ECB President Mario Draghi will also be talking at 1100 GMT, though the topic of discussion renders any market-sensitive comments unlikely.
Technical Analysis: USDJPY rises to 1½-month high, short-term bullish
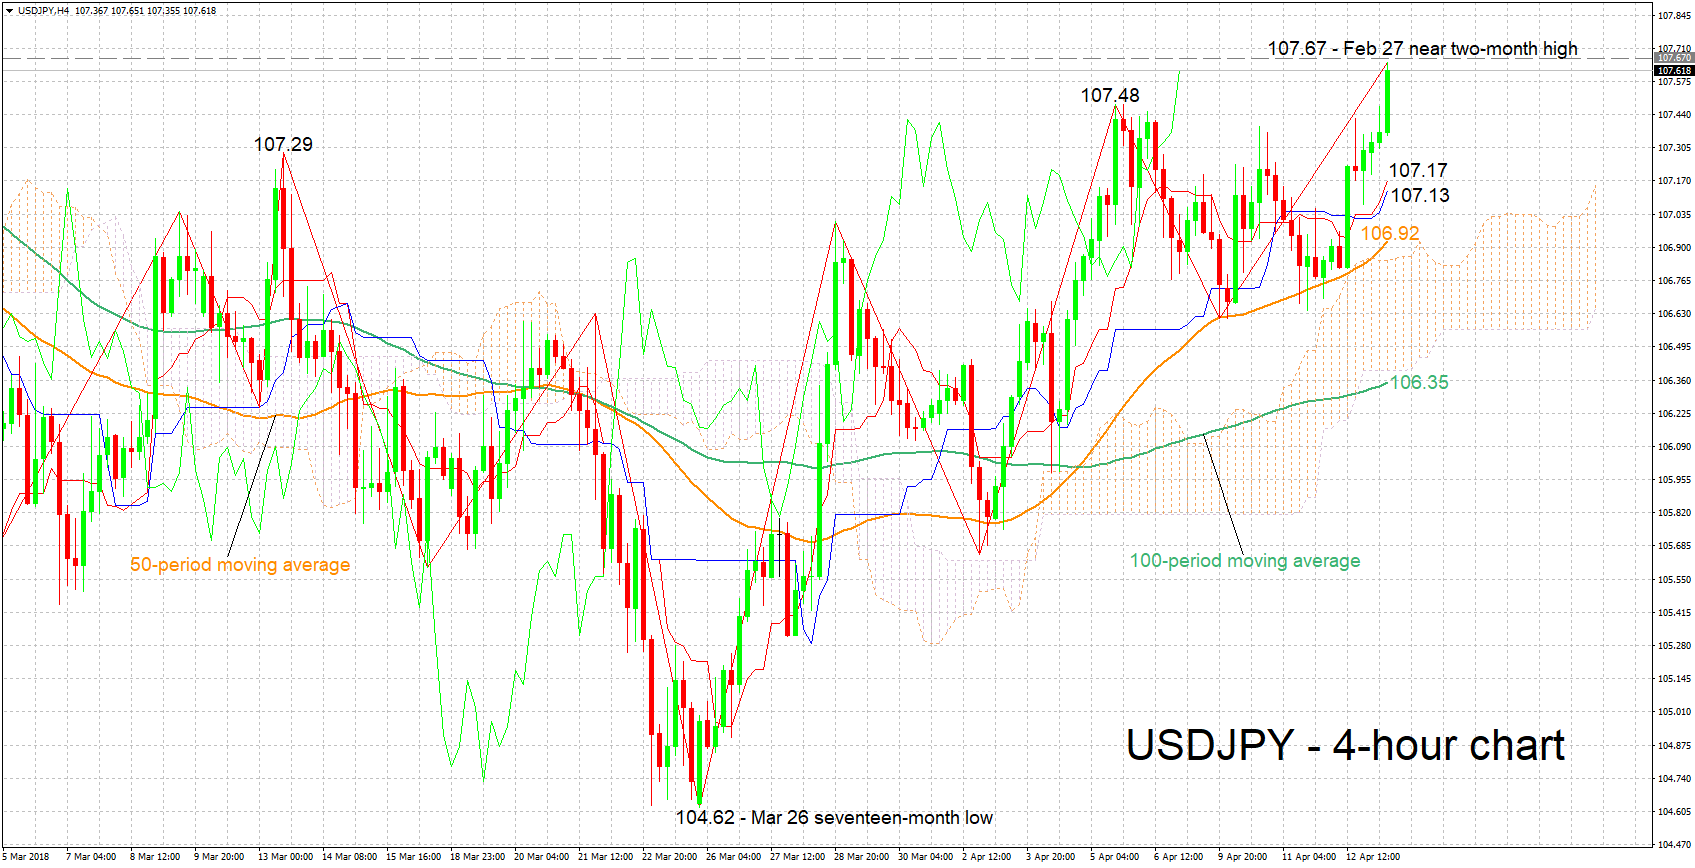
USDJPY has risen to touch a one-and-a-half-month high of 107.65 during Friday’s trading, while it is currently trading not far below that mark. The Tenkan- and Kijun-sen lines are positively aligned in support of a bullish picture for the pair in the short-term.
Upbeat US releases later in the day could provide an additional boost to USDJPY. Immediate resistance could be met around late February’s near two-month high of 107.67. An upside break would shift the attention to the 108 round figure as an additional barrier to the upside.
Weaker-than-anticipated releases might weaken the pair, with immediate support potentially coming around 107.48, a previous peak. Further declines would eye the area around the current level of the Tenkan-sen at 107.17, which also includes the Kijun-sen at 107.13 and a peak from the recent past at 107.29.
Rising geopolitical and/or trade uncertainty can also spur movements in the pair, particularly pushing it lower. The opposite holds true as well.
JPY selloff intensifies, AUDJPY catching up NZDJPY
JPY drops sharply today as most of the imminent risks abated, temporarily, including missile strike in Syria, US-China trade war etc. Selling momentum persist as seen in both 4H and D heatmap. And the selloff is spilling over to USD too.
GBP and commodity currencies are strong with AUD/JPY and GBP/JPY topping the top movers chart for today.
 For the week, CAD/JPY is the strongest one, followed by NZD/JPY and AUD/JPY but they are close.
 Taking a look at AUD/JPY, it's now targeting 84.51 near term resistance. Firm break there should be a strong sign of trend reversal. That is, the whole decline fro 90.29 has completed at 80.48. And in that case, AUD/JPY should target 89.08/90.29 resistance zone in short to medium term term.
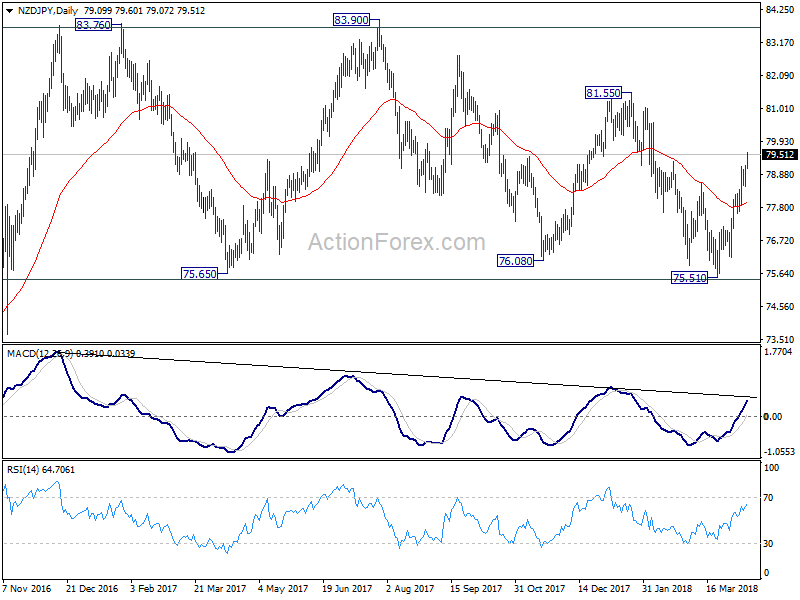
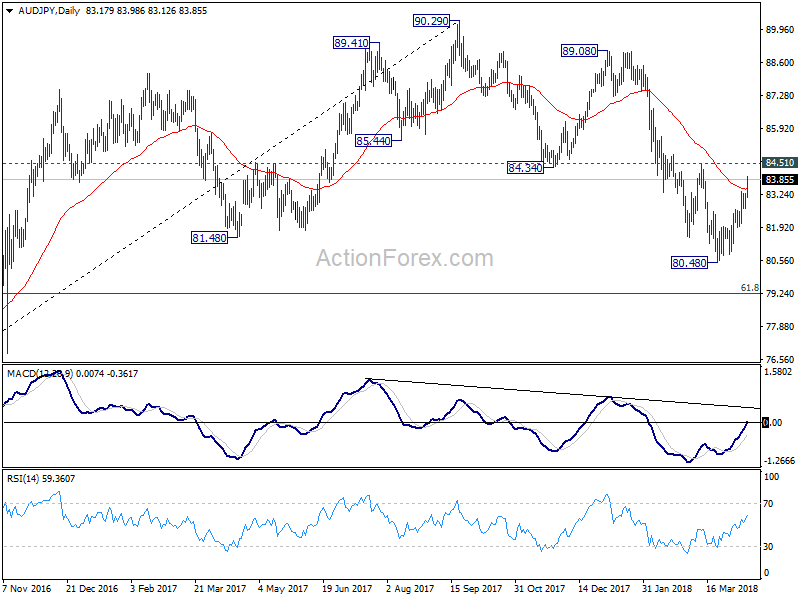 Meanwhile, NZD/JPY has actually taken out equivalent resistance at 78.61 earlier this week. It's also on track for 81.55/83.90 resistance zone. Comparing the two, AUD/JPY is trying to catch up. And as we mentioned in a post before, we'd still prefer NZD/JPY to AUD/JPY for long trade.
XAUUSD Intraday Analysis
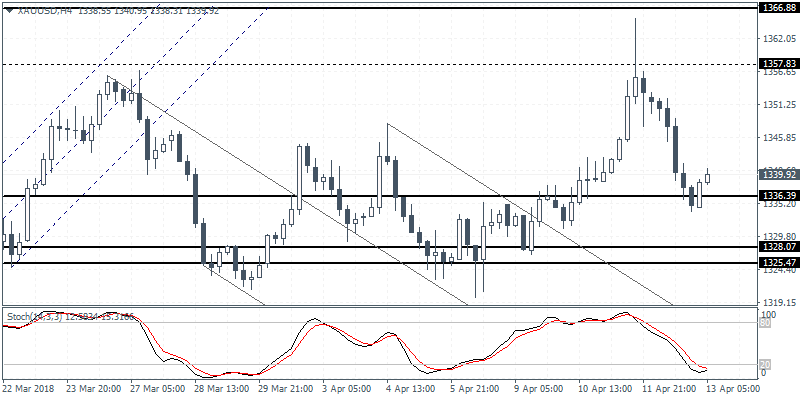
XAUUSD (1339.39): Gold prices continued to slip as price action fell to the lower support of 1336. The minor bullish engulfing pattern formed on the 4-hour chart suggests a near term rally to the upside. Gold prices could be seen retesting the resistance level at 1357 level in the near term. A breakdown below 1336 could however signal further declines as gold prices could test the lower support at 1328 - 1325 levels.
GBPUSD Intraday Analysis
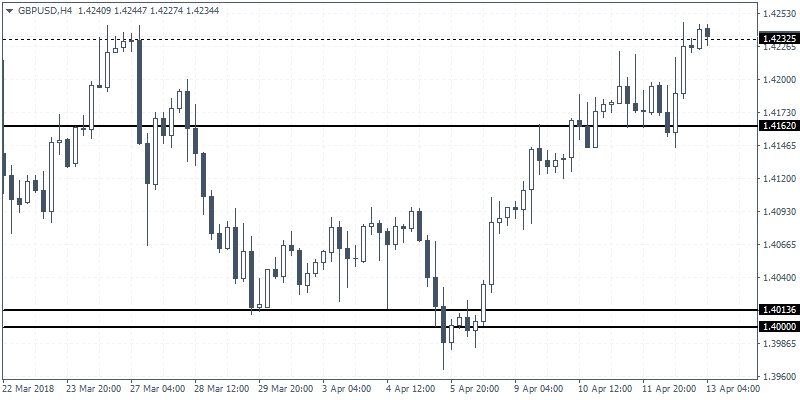
GBPUSD (1.4234): The British pound extended the gains with a bullish close following the doji pattern formed the day before. The brief retracement back to 1.4162 saw prices reversing strongly as a result. We expect this upside momentum to continue to push higher as GBPUSD tests the highs near 1.4244 previously formed from March 27. In the near term, we could expect to see a reversal at this level and further gains are likely only on a close above 1.4244
EURUSD Intraday Analysis
EURUSD (1.2328): The EURUSD gave up the gains yesterday as the ECB minutes proved to be dovish. Price action was however contained within the price levels of 1.2400 and 1.2250. The euro fell to the lower bound briefly testing the support at this level before bouncing back higher. We expect this range to continue in the short term. However, with support likely to stall the declines at 1.2250, there is scope for the EURUSD to potentially push higher. A breakout from the rang will establish further direction in price.
Dovish ECB Minutes Pull Euro Lower
The euro currency was seen extending the declines on the day after the ECB meeting minutes provided to be more dovish than expected. The minutes released yesterday saw officials downplaying the change to the ECB’s monetary policy statement. The central bank cited risks from the global trade uncertainty and the recent strengthening of the exchange rate.
Gold prices also gave up the gains from earlier this week after tensions surrounding the U.S. administration’s remarks on Syria and Russia eased. Equity markets rallied as risk sentiment improved.
Looking ahead, the economic calendar for the day is relatively quiet. Only the German final inflation figures will be coming out in the early part of the day. Economists forecast that the German inflation rose at a pace of 0.4%, matching the flash estimates. Later in the day, the trade balance figures from the Eurozone will be coming out. Following the decline in German imports and exports, it is expected that the Eurozone trade balance would also narrow.
In the NY trading session, the preliminary inflation expectations will be released by the University of Michigan.