Sample Category Title
GBP/USD Analysis: Breaches Trend – Line
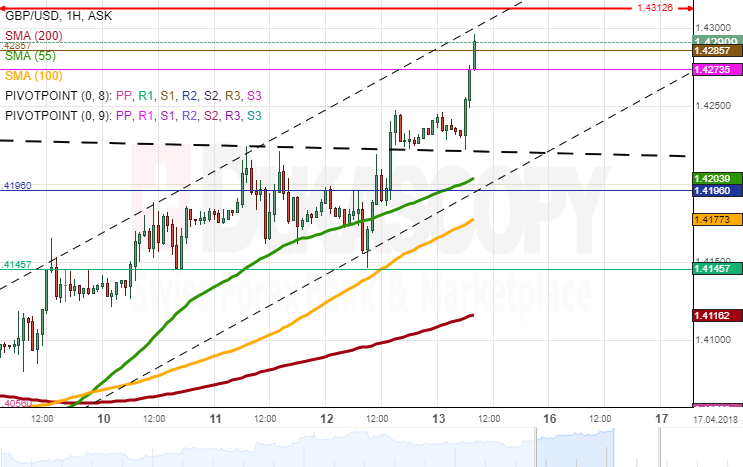
The GBP/USD pair was guided by the 55-hour SMA during the first part of Thursday, while the upper limit was set by a trend-line and the weekly R2. The former was breached mid-session, and the Sterling had remained near this line by Friday morning.
Some upside potential is still apparent in the market, as the Pound might try to reach the 1.43 level. This area is reinforced by the monthly R1, the weekly R3 and the post-Brexit high of 1.4313. The 55– and 100-hour SMAs could continue guiding the pair towards this territory, as supported by bullish technical indicators.
Given that this should be a rather uneventful day, a breakout above this area is unlikely. In terms of support, a possible downside target is be the weekly R1 at 1.4150.
S&P upgrades Japan’s A+ rating outlook to “positive”
S&P Global Ratings upgraded Japan's A+ outlook from "stable" to "positive". S&P noted stronger economy should set the stage for fiscal improvement in Japan. The positive outlook reflects healthier growth prospect, in both real and nominal terms. The current rating also reflect Japan's formidable external position, diversified economy, political stability and financial system stability. Nonetheless, it also pointed out that While Japan's external balance sheet is strong, Government finances are weak. And that is a significant constraint of its creditworthiness.
Some analysts view that outlook upgrade as an endorsement of Abenomics too.
But for now, JPY is not listening to the news and stays broadly pressured.
EUR/USD Analysis: Moves Along 100-Hour SMA
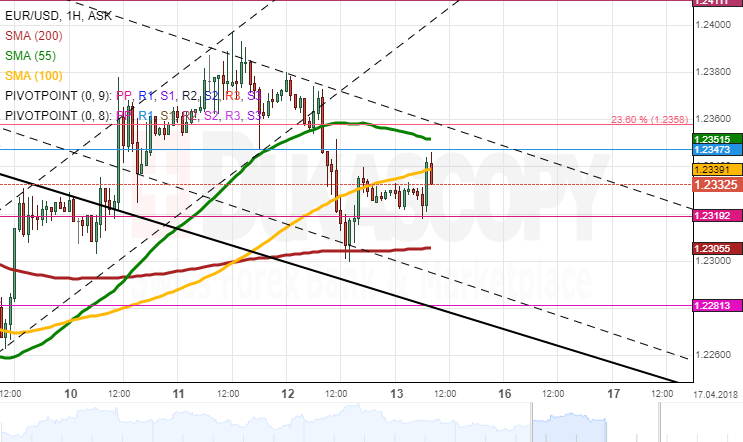
As previously expected, the Euro surrendered under the bearish pressure on Thursday and thus was pushed down to the 200-hour SMA at 1.23. The 55– and 100-hour SMAs, the 23.60% Fibo retracement and the monthly PP was breached along the way.
Following this 62-pip fall, the pair rebounded from the long-term moving average and began edging higher. The pair's movement early on Friday was constrained by the 100-hour SMA and the monthly PP.
The general tendency seems to be northwards; however, given that this session is likely to be rather uneventful, the Euro could lack the necessary strength to breach the 1.2360 level.
The base scenario favours minor fluctuations in this session, with the range boundaries being located at the 55– and 200-hour SMAs.
CRUDE OIL Continued Strength
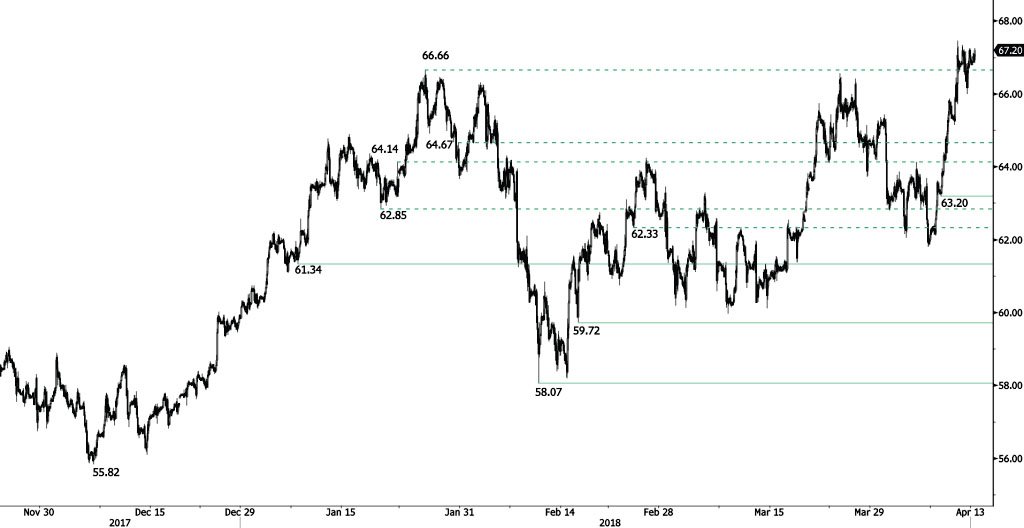
Crude oil is rising further, trading above 67 and heading along the 67.70 range. Crude Oil is trading at its December 2014 high. The bullish pattern started in November 2017 is confirmed. Hourly support at 63.20 (10/04/2018 low) is distanced. The technical structure suggests short-term increase.
In the long-term, crude oil has recovered after its sharp decline last year. However, we consider that further weakness is very likely. For the time being, the pair lies in an upside trend since June 2017. Support lies at 42.20 (16/11/2016) while resistance is located at 77.83 (20/11/2014). Crude oil is trading above its 200 DMA.
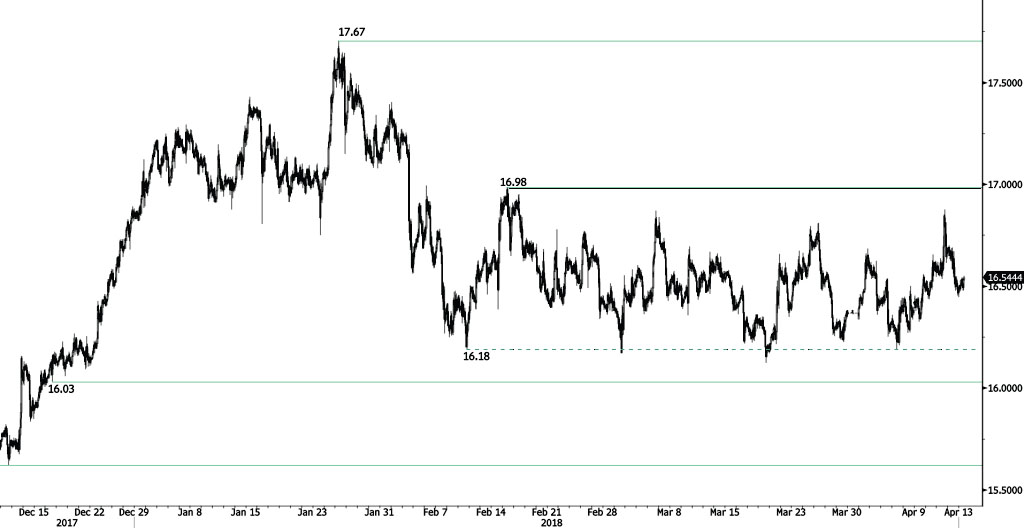
SILVER Strong Increase
Silver is rising back following recent decline at 16.44, approaching the 16.60 range. Silver is contained between hourly support and resistance given at 16.03 (18/12/2017 low) and 16.98 (15/02/2018 high). The short-term technical structure suggests short-term upward moves.
In the long-term, the trend remains negative/ sideways. Further downside is very likely. The pair is trading below its 200 DMA. Resistance is located at 21.58 (10/07/2014 high). Strong support can be found at 11.75 (20/04/2009)
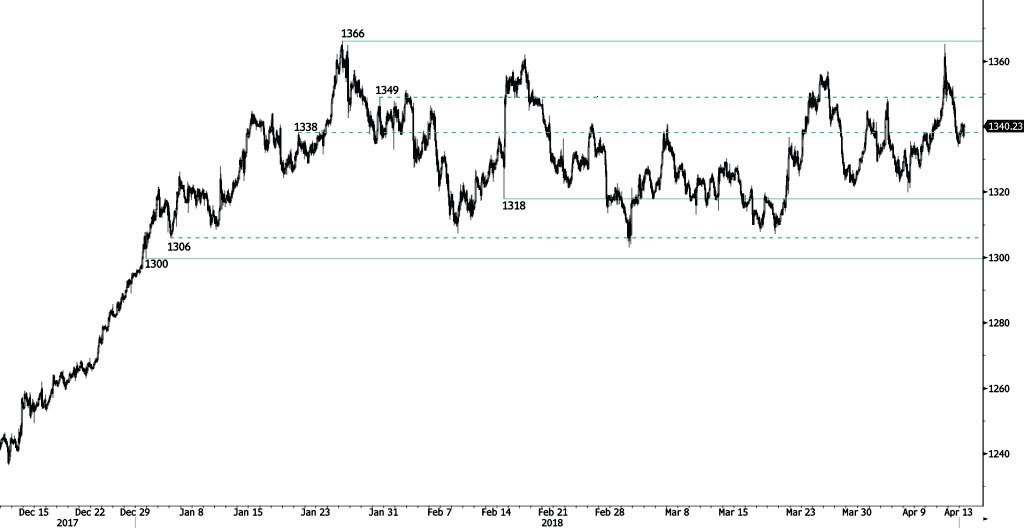
GOLD Starting A Recovery Phase
Gold is bouncing off from 1334 low, approaching the 1342 range. Hourly support and resistance are given at 1318 (14/02/2018 low) and 1366 (25/01/2018 high). The technical structure suggests short-term increase.
In the long-term, the technical structure suggests that there is a growing upside momentum. A break of 1'392 (17/03/2014) is required to confirm it. A major support can be found at 1'045 (05/02/2010 low).
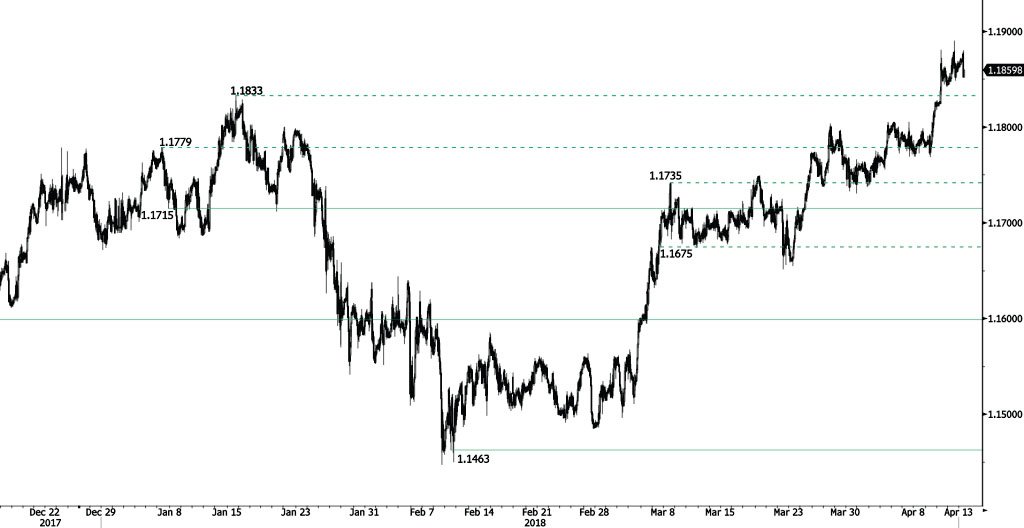
EUR/CHF Slight Decrease
EUR/CHF bullish momentum momentarily stops, falling from 1.1890 high and heading along the 1.1850 range. Strong resistance at 1.20 (level before the unpeg) remains. Hourly support given at 1.1715 (07/01/2018 low) remains. The short-term technical structure suggests shortterm decrease.
In the longer term, the technical structure has reversed. Strong resistance is given at 1.20 (level before the unpeg). Yet, the ECB's slowing QE program is likely to cause buying pressures on the euro, which should weigh in favour of the EUR/CHF. Support can be found at 1.0624 (24/06/2016 low).
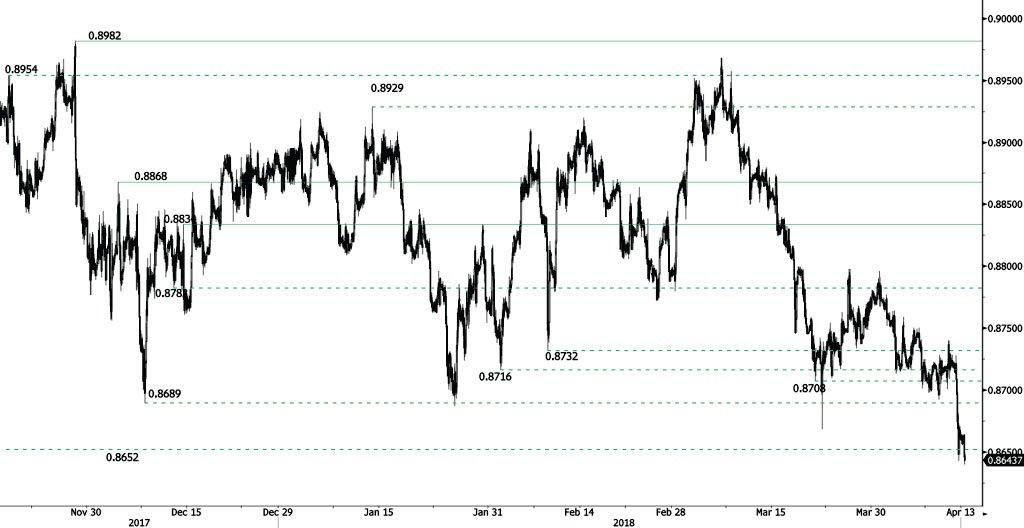
EUR/GBP Bearish Breakout
EUR/GBP is collapsing, declining from 0.8723 high and heading along the 0.8628 range. EUR/ GBP bearish pattern started in March is reinforced. Hourly support at 0.8652 (08/06/2017) is now broken while hourly resistance at 0.8834 (14/12/2017 high) is distanced. The technical structure suggests short-term decrease.
In the long-term, the pair has largely recovered from 2015 lows. The technical structure suggests further upside pressure. Strong resistance can be found at 0.9500 (psychological level) while support remains at 0.8304 (05/12/2016 low). The pair is trading below its 200 DMA.
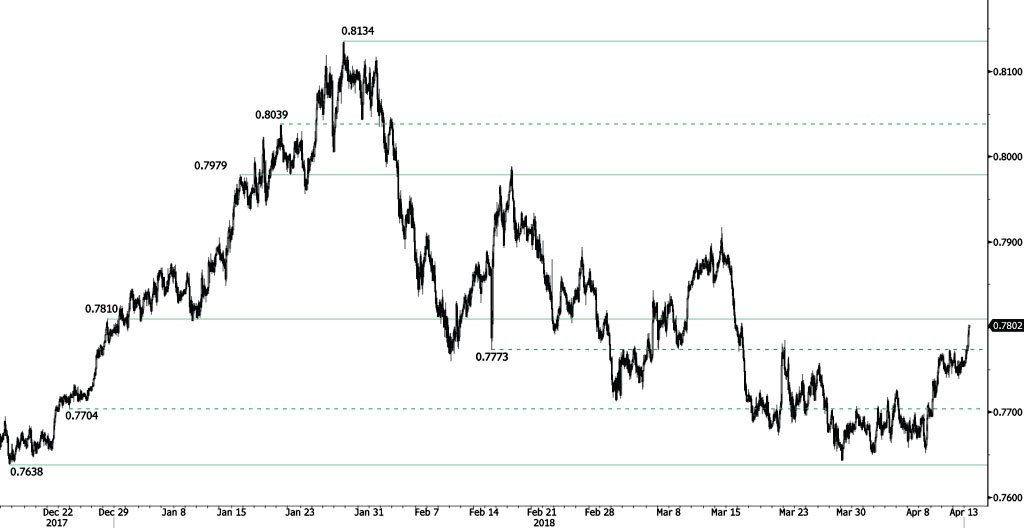
AUD/USD Testing Resistance At 0.7810
AUD/USD bullish breakout starts, approaching hourly resistance at 0.7810 (28/12/2018 high) and heading along the 0.7805 range. Hourly support at 0.7638 (15/12/2017 low) is distanced. The technical structure suggests short-term upward moves.
In the long-term, the upward trend slows down after failing to reach key resistance at 0.8164 (14/05/2015 low). Key support stands at 0.6009 (31/10/2008 low). A break of the key resistance at 0.8164 (14/05/2015 high) is needed to invalidate our long-term bearish view.
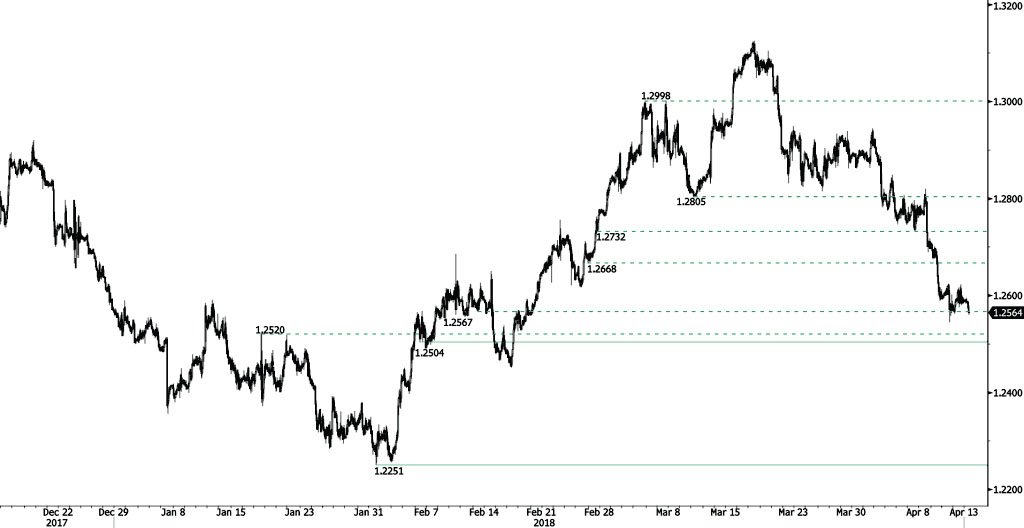
USD/CAD Trading Below 1.26
USD/CAD is trading lower following recent rise above 1.26, breaking hourly support at 1.2567 (13/02/2018). The pair is heading along the 1.2560 range. Hourly support and resistance are now given at 1.2504 (06/02/2018 low) and 1.2755 (22/02/2018 high). The short-term technical structure suggests short-term decrease.
In the longer term, the pair is trading between resistance point at 1.3805 (05/05/2017 high) and support at 1.2128 (18/06/2015 low). Strong resistance is given at 1.4690 (22/01/2016 high). The pair is likely to head lower. The pair is trading below its 200 DMA.