Sample Category Title
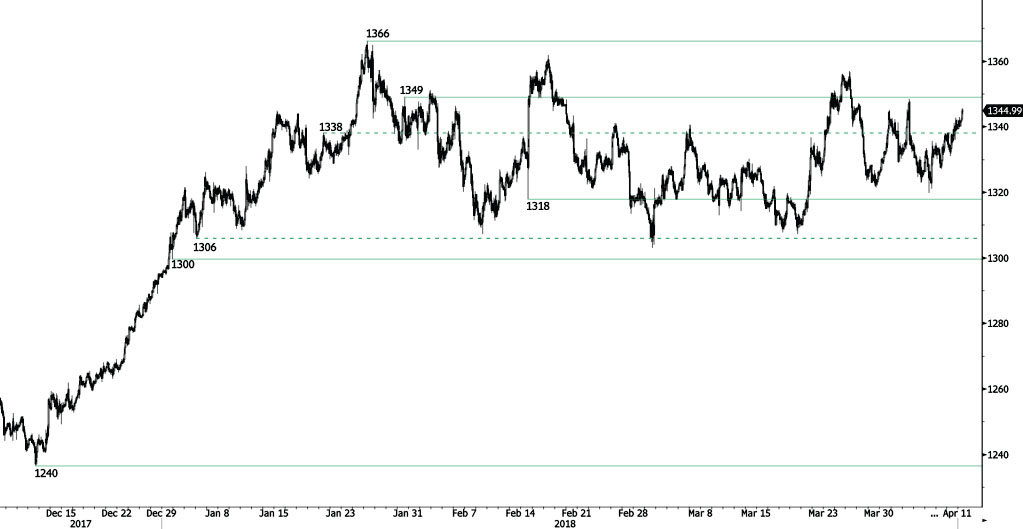
GOLD Edging Higher
Gold is trading higher, bouncing off from 1320 low (06/04/2018) and heading along the 1346 range. Hourly support and resistance remain at 1318 (14/02/2018 low) and 1349 (30/01/2018 high). The technical structure suggests shortterm increase.
In the long-term, the technical structure suggests that there is a growing upside momentum. A break of 1'392 (17/03/2014) is required to confirm it. A major support can be found at 1'045 (05/02/2010 low).
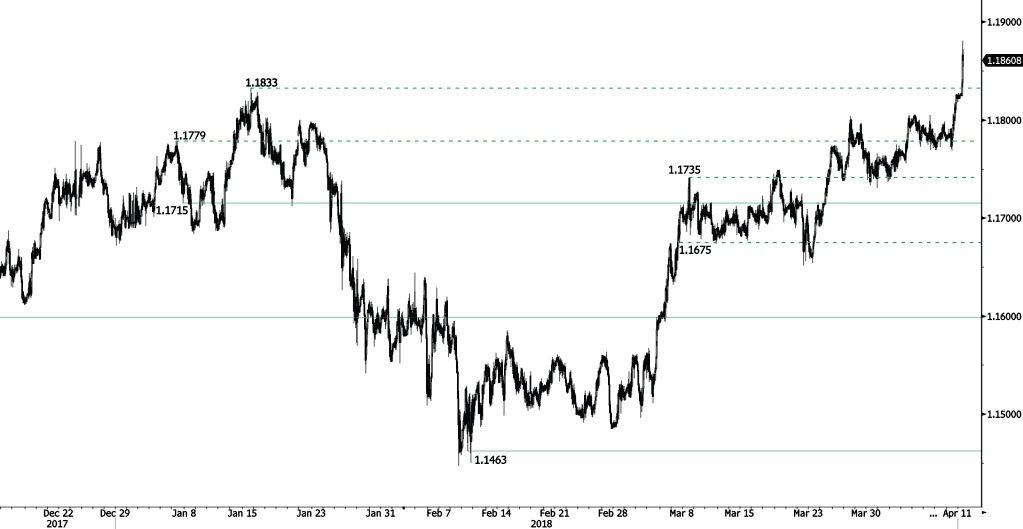
EUR/CHF Bullish Breakout
EUR/CHF is starting a strong bullish momentum, breaking strong hourly resistance at 1.1833 (15/01/2018) and approaching its 2014 highs. The pair is heading along the 1.1870 range. Strong resistance at 1.20 (level before the unpeg) remains. Hourly support is given at 1.1715 (07/01/2018 low). The short-term technical structure suggests short-term increase.
In the longer term, the technical structure has reversed. Strong resistance is given at 1.20 (level before the unpeg). Yet, the ECB's slowing QE program is likely to cause buying pressures on the euro, which should weigh in favour of the EUR/CHF. Support can be found at 1.0624 (24/06/2016 low).
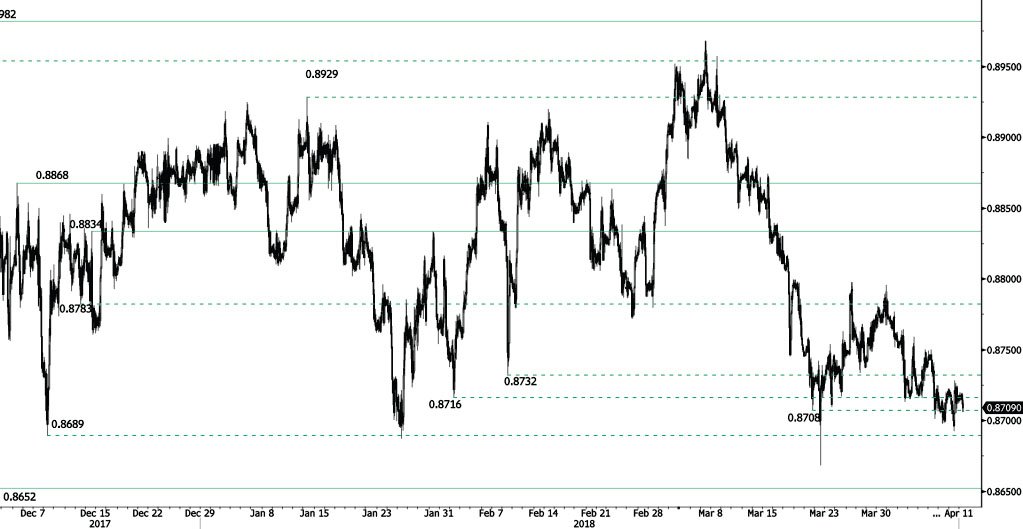
EUR/GBP Bearish Pressures
EUR/GBP decline slows, starting a bearish consolidation and heading along the 0.8710 range. EUR/GBP bearish pattern started in March is maintained. Hourly support and resistance are given at 0.8652 (08/06/2017 low) and 0.8834 (14/12/2017 high). The technical structure suggests short-term sideways trading moves.
In the long-term, the pair has largely recovered from 2015 lows. The technical structure suggests further upside pressure. Strong resistance can be found at 0.9500 (psychological level) while support remains at 0.8304 (05/12/2016 low). The pair is trading below its 200 DMA
AUD/USD Bearish Pressures
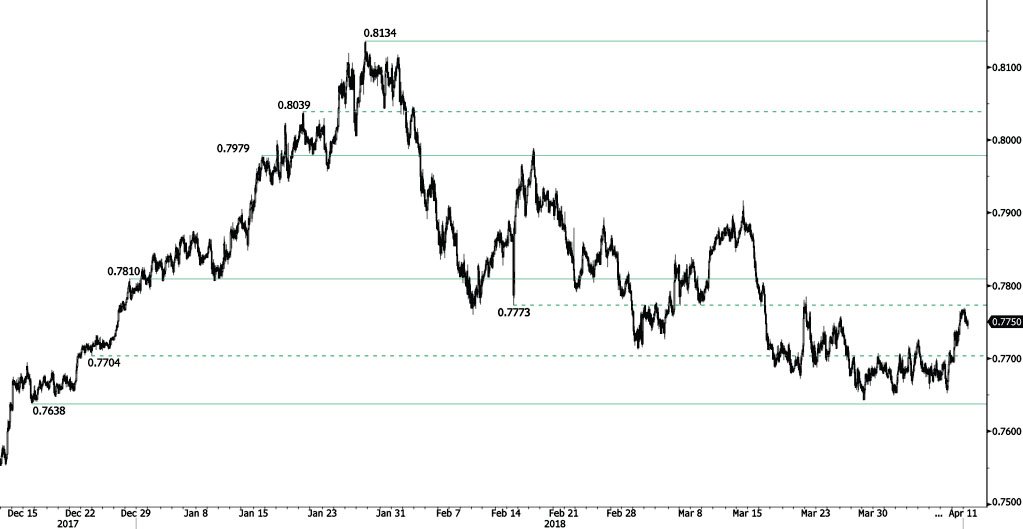
AUD/USD is weakening following recent bullish momentum, declining from 0.7769 high and heading along the 0.7740 range. The bearish pattern started in mid-February 2018 is maintained. Hourly support and resistance are given at 0.7638 (15/12/2017 low) and 0.7810 (28/12/2017). The technical structure suggests short-term downward moves.
In the long-term, the upward trend slows down after failing to reach key resistance at 0.8164 (14/05/2015 low). Key support stands at 0.6009 (31/10/2008 low). A break of the key resistance at 0.8164 (14/05/2015 high) is needed to invalidate our long-term bearish view.
USD/CAD Collapse
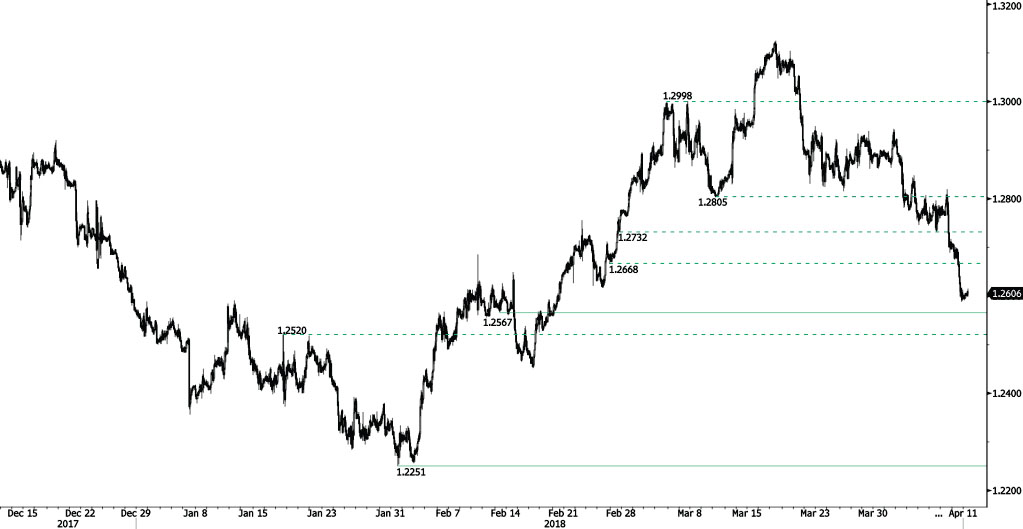
USD/CAD is trying to bounce following recent downturn at 1.2589, breaking hourly support at 1.2668 (26/02/2018) and heading along the 1.2620 range. Hourly support and resistance are now given at 1.2567 (13/02/2018 low) and 1.3308 (23/06/2017 high). The short-term technical structure suggests short-term upward moves..
In the longer term, the pair is trading between resistance point at 1.3805 (05/05/2017 high) and support at 1.2128 (18/06/2015 low). Strong resistance is given at 1.4690 (22/01/2016 high). The pair is likely to head lower. The pair is trading below its 200 DMA.
USD/CHF Approaching The 0.96 Range
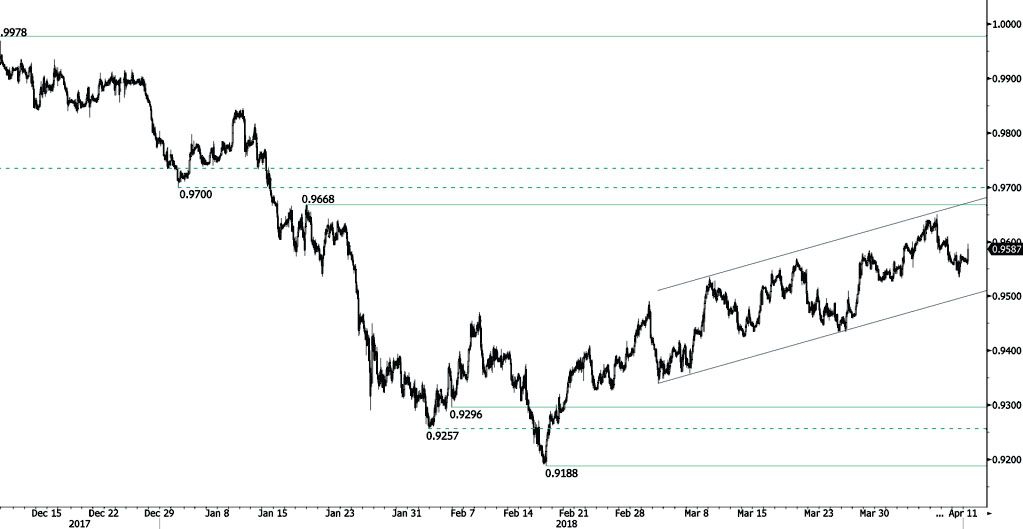
USD/CHF is bouncing off from 0.9535 low, trading at its January highs and heading along the 0.9595 range. The bullish pattern started from 0.9188 (16/02/2018 low) continues. The pair is contained between hourly support and resistance given at 0.9296 (05/02/2018 low) and 0.9668 (17/01/2018 high). The technical structure suggests short-term increase.
In the long-term, the pair is still trading in range since 2011 despite some turmoil when the SNB unpegged the CHF. Key support lies at 0.9072 (07/05/2015 low) while resistance at 1.0344 (15/12/2016 high) is distanced. The technical structure favours a long term bullish bias since the unpeg in January 2015.
USD/JPY Slight Decrease
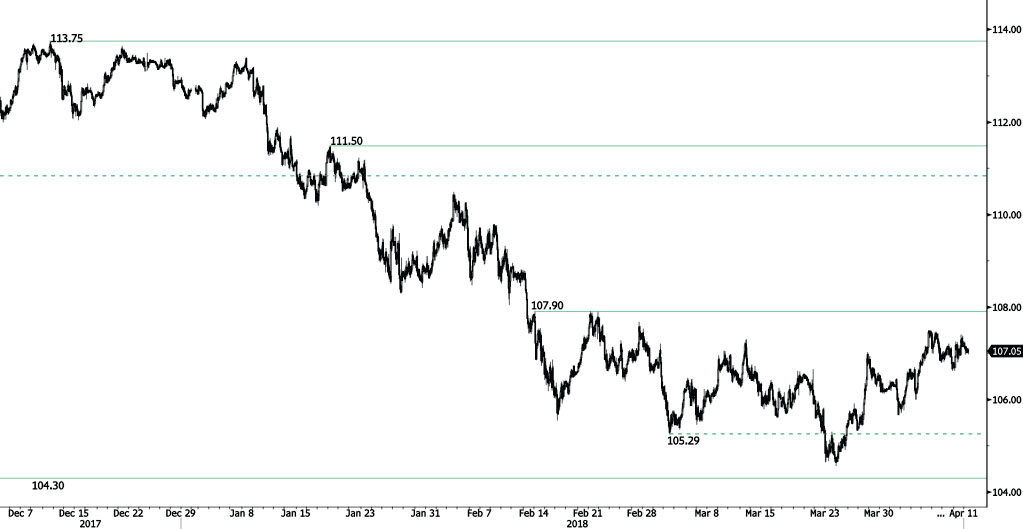
USD/JPY bullish momentum stops, decreasing from 107.40 high and heading along the 106.95 range. The bearish pattern started in January 2018 is maintained. Hourly support and resistance are given at 104.30 (08/11/2016 low) and 107.90 (14/02/2018 high). The short-term technical structure suggests short-term downward moves.
We favor a long-term bearish bias. Support remains at 101.20 (09/11/2016 low). A gradual rise toward the major resistance at 125.86 (05/06/2015 high) seems unlikely. Expected to decline further support at 101.20 (09/11/2016 low). The pair trades largely below its 200 DMA.
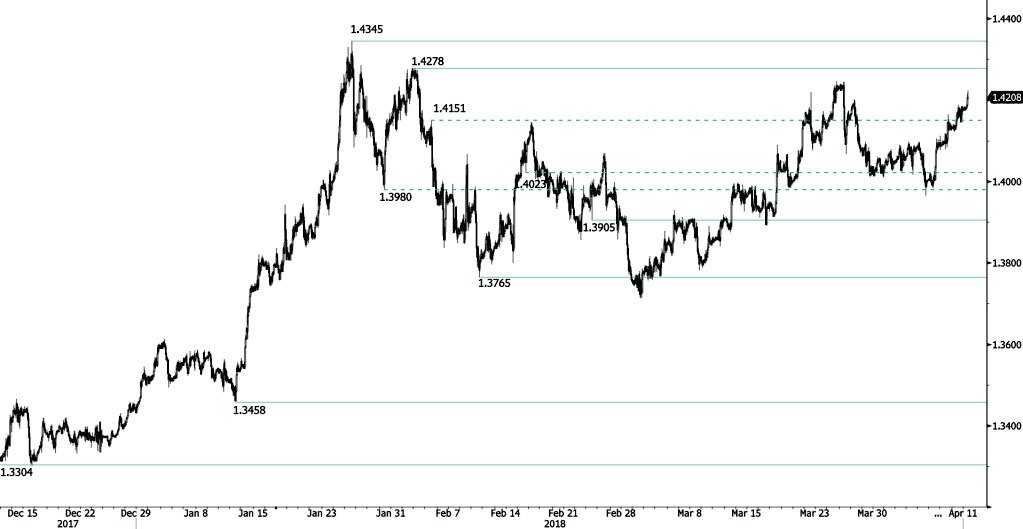
GBP/USD Continued Increase
GBP/USD continues its recovery phase, approaching March 2018 highs and trading above 1.42. Heading along the 1.4225 range. Hourly support and resistance are given at 1.3905 (23/02/2018 low) and 1.4278 (02/02/2018 high). The technical structure suggests further short-term increase.
The long-term technical pattern is reversing. The Brexit vote had paved the way for further decline but the pair is moving to 2016 highs. Long-term support and resistance are given at 1.1841 (07/10/2017 low) and 1.5018 (24/06/2016 high).
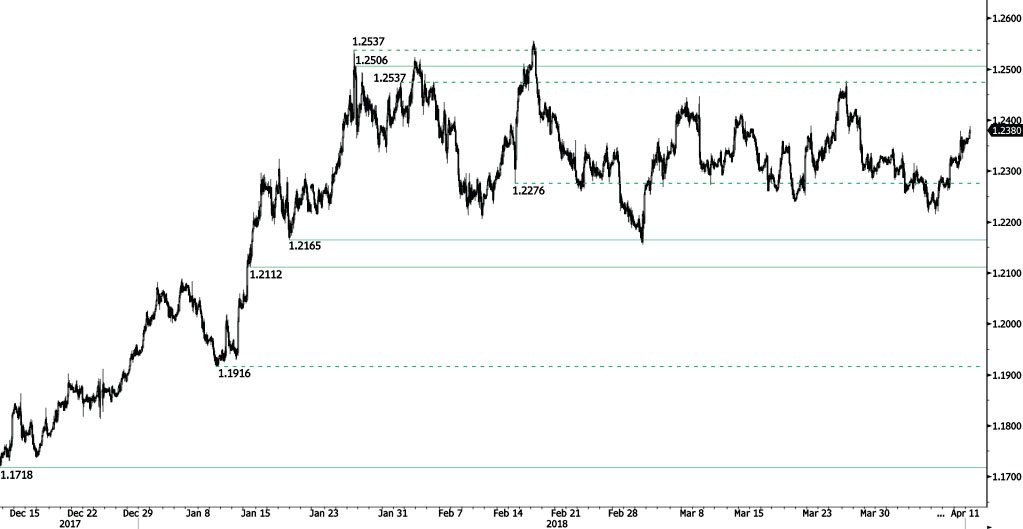
EUR/USD Continued Bullish Momentum
EUR/USD bullish trend starts back, bouncing off from 1.2215 low (06/04/2018 low) and heading along the 1.2390 range. The pair is currently maintained between hourly support and resistance given at 1.2165 (17/01/2018 low) and 1.2506 (25/01/2018 high). The technical structure suggests further increase.
In the longer term, the momentum is turning largely positive. We favor a continued bullish bias. Key resistance is holding at 1.2886 (15/10/2014 high) while strong support lies at 1.1554 (08/11/2017 low).
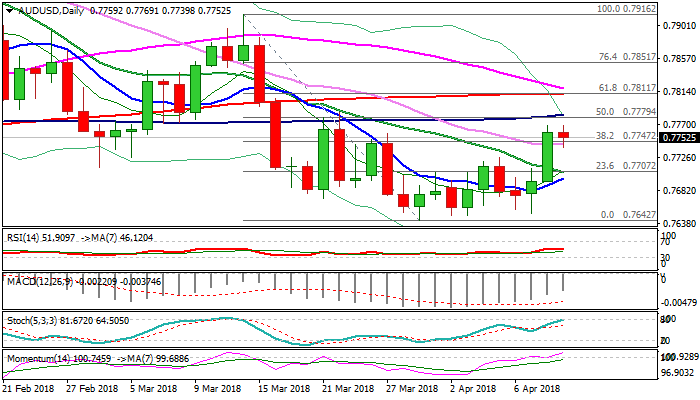
AUDUSD Holds In Narrow Consolidation After Tuesday’s Rally, Eyes Key 100/200SMA Barriers
The Aussie dollar stands at the back foot on Wednesday, consolidating above new recovery highs at 0.7768 after strong bullish acceleration on Tuesday eventually broke above two-week congestion.
Consolidation was so far shallow and contained by sideways-moving 30SMA (0.7742) as tone softened after initial euphoria on conciliating speech of Chinese president faded.
Tuesday's long bullish daily candle continues to underpin, along with bullishly aligned MA's (10/20/30) and north-heading 14-d momentum, keeping the upside in focus.
Bulls should ideally hold above 30SMA to keep structure intact for attacks at key barriers at 0.7780 (100SMA) and 0.7810 (200SMA), as the later also marks Fibo 61.8% of 0.7916/0.7642 bear-leg and close above is needed to confirm reversal and signal base at 0.7640 zone.
Meanwhile, extended dips are expected to find footstep above 20SMA (0.7706) to keep hopes of fresh attempts higher alive, while break lower would weaken near-term structure.
US CPI data and FOMC minutes are in focus for fresh signals.
Res: 0.7768, 0.7780, 0.7810, 0.7858
Sup: 0.7742, 0.7706, 0.7697, 0.7674