Sample Category Title
Sunset Market Commentary
Markets
Global core bonds gained ground today with US Treasuries outperforming German Bunds. The move occurred after US President Trump suggested performing an air strike against Syria without Russian backing. The new uptick in geopolitical risk, following the US/Chinese trade dispute, weighed on risk sentiment. US CPI data increased in line with expectations with the core reading back above the Fed’s 2% target. ECB president Draghi said that he expects wages and inflation to rise as the economy improves. He doesn’t expect a big direct impact from the US/Chinese trade conflict, but warns about consequences via the trust channel. Data and central bank comments were overshadowed by geopolitical concerns though. The US yield curve bull flattens at the time of writing with US yields 1.2 bps (2-yr) to 4.7 bps (30-yr) lower. The German yield curve shifts in similar fashion with yields 0.1 bp (2-yr) to 2.8 bps (30-yr) lower. The Portuguese debt agency successfully launched a new 15-yr benchmark (€3bn Apr2034). The bond was priced to yield MS +102 bps compared to initial guidance in the MS + 105 bps area.
The dollar traded with a negative bias earlier this week and this pattern continued today. The global risk-off sentiment and geopolitical uncertainty (Syria) were a negative for the dollar, rather than for the euro (or of course the yen). EUR/USD trended higher in the 1.23 big figure. USD/JPY dropped back below 107. The US CPI data were close to the expectations, but monthly data (-0.1% M/M headline, 0.2% M/M core) don’t indicate any acceleration in price rises yet. The report didn’t help the dollar. EUR/USD trades currently near 1.2375. The overall USD momentum remains sluggish.
Today, a series of disappointing UK data triggered profit taking on the recent rally of sterling. UK February production data missed the consensus estimate by quite a wide margin. Manufacturing production even declined 0.2% M/M resulting in a 2.5% Y/Y rise (+0.2% M/M and 3.3% Y/Y was expected). Construction output also declined for the second consecutive month. Last but not least, the NIESR March GDP estimate indicated that Q1 growth maybe slowed to 0.2% Q/Q. EUR/GBP traded again close to the 0.87 barrier this morning, but rebounded to 0.8735/40 in the wake of the data releases (currently 0.8725 area). Cable (1.4175/80) also declined off the recent top. Expectations for a May BoE rate hike eased marginally (still about 85% chance).
News Headlines
President Donald Trump on Wednesday said that U.S. missiles “will be coming” to Syria, and warned he was willing to challenge Russia directly in launching a military strike against Syrian President Bashar al-Assad over an alleged chemical-weapons attack. (WSJ)
US CPI inflation printed nearly bang in line with expectations. Headline CPI declined by 0.1% M/M, below the 0% consensus. Inflation rose by 2.4% on a yearly basis, accelerating from 2.2% in February. Underlying core inflation, which strips out volatile components like food and energy, rose by 0.2% m/m and 2.1% Y/Y as expected and returns above the Fed’s 2% target.
UK production data disappointed in February. Industrial production rose by 0.1% M/M, but manufacturing production shrank for the first time in 11 months (-0.2% M/M), led by output of machinery and equipment. Construction output declined by 1.6% M/M in February. Severe winter conditions weighed on production in February and suggest a rebound next month.
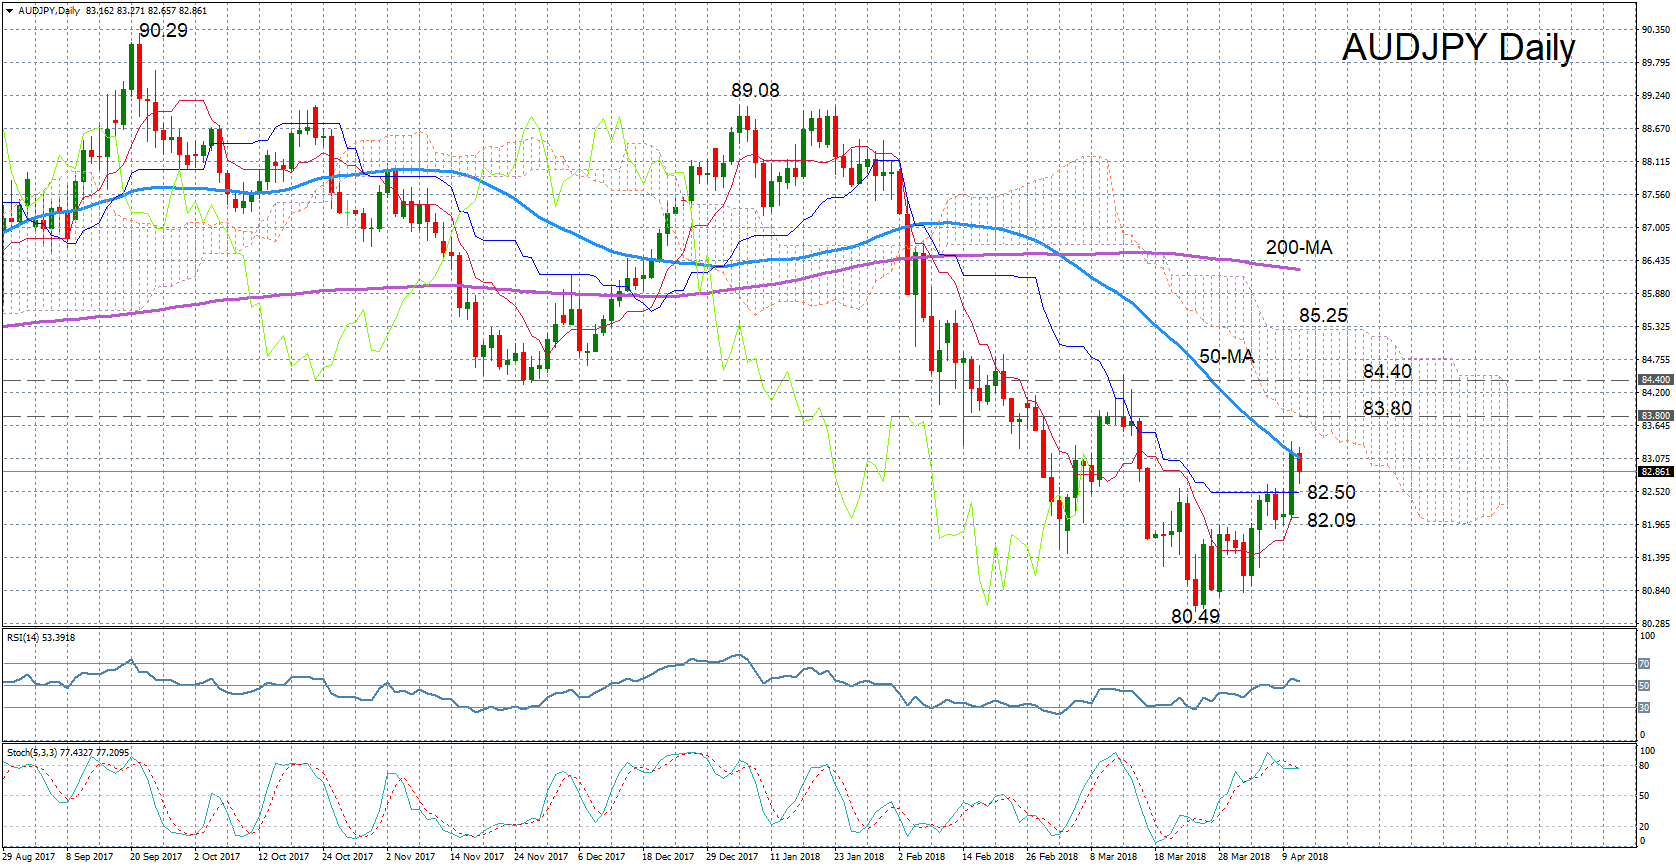
AUDJPY Finds Resistance at 50-day MA; Outlook Remains Bearish
AUDJPY hit a 4-week high yesterday, peaking at 83.36, but the upswing met resistance at the 50-day moving average. Prices have reversed sharply lower today but momentum indicators remain in bullish territory, suggesting fresh gains are still possible in the near term even though the immediate risk is to the downside.
Th RSI has dipped slightly lower today and is some way off from overbought territory. The stochastics are also pointing downwards but are holding near the 80-overbought level.
Should the pair resume its uptrend, the next resistance could from the bottom of the Ichimoku cloud around 83.80. A break inside the could would help shift the bearish medium-term picture to a more neutral one and bring the 84.40 resistance level into view. Climbing above this March high could provide enough upside momentum for prices to break above the cloud top around 85.25.
However, should today’s losses deepen, there could be support from the Kijun-sen and Tenkan-sen lines at 82.50 and 82.09 levels respectively. Further declines would drive prices towards March’s 16-month trough of 80.49. A breach of this low would signal a resumption of the medium-term downtrend that’s been in progress since late January.
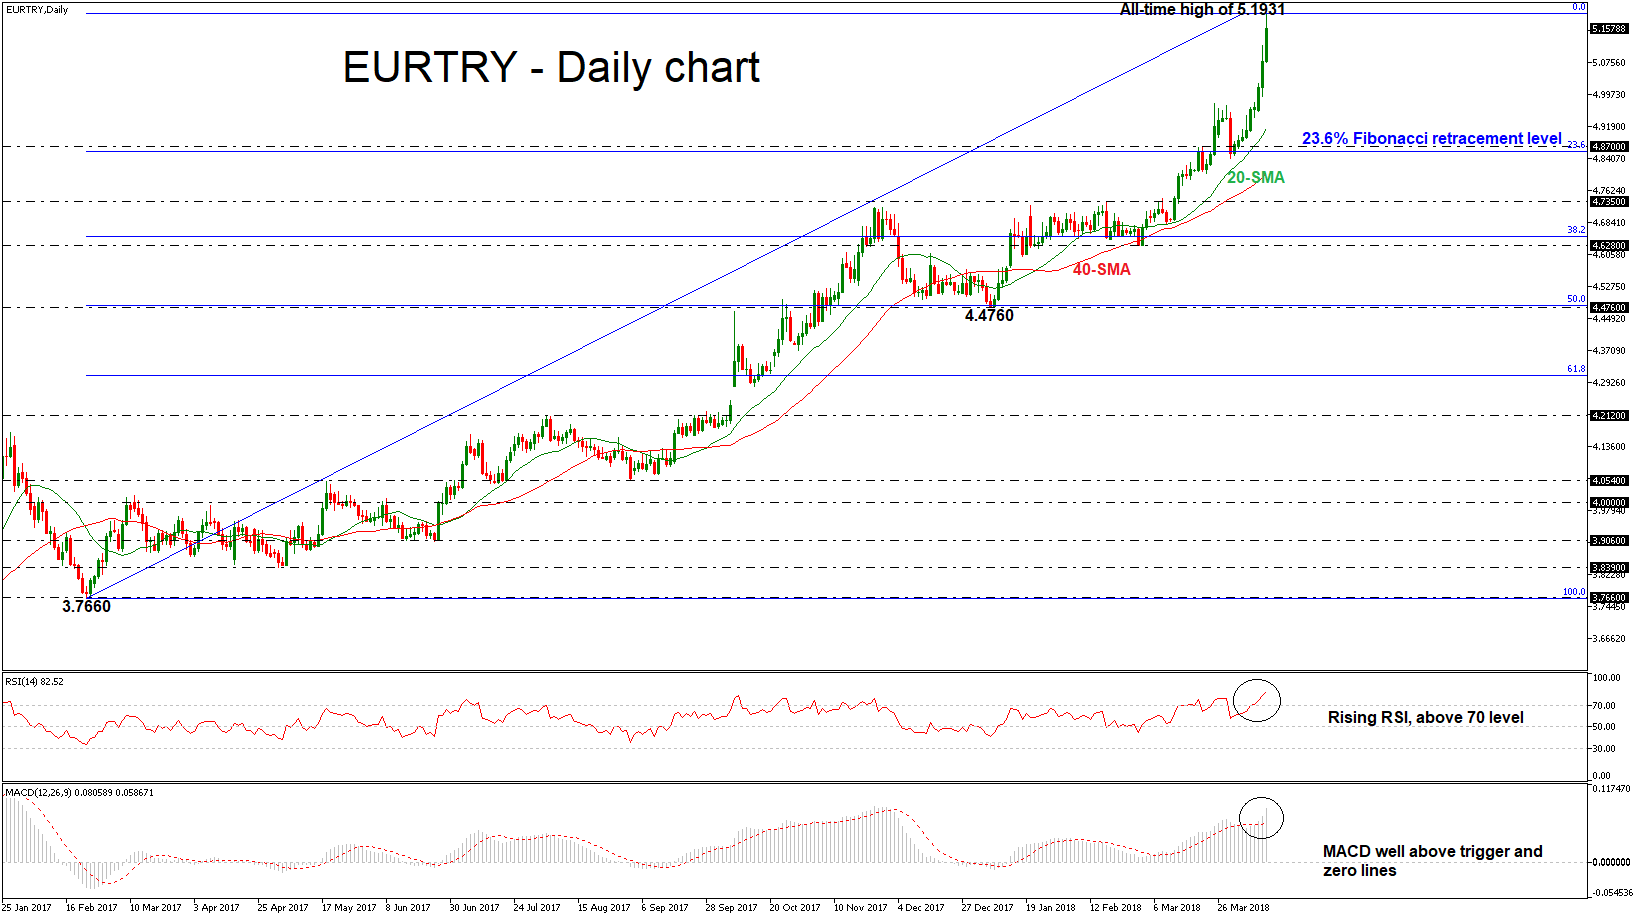
EURTRY Skyrockets to Fresh All-Time High of 5.1931
EURTRY reached another all-time high of 5.1931 today, posting the ninth consecutive bullish day. Over the last couple of days, the pair is posting new highs with aggressive mode and is trading well above its moving averages. The bullish picture in the medium-term is further supported by the MACD, which is rising above its red trigger line.
Short-term momentum indicators are also pointing to a continuation of the bullish bias. The RSI indicator is well above the 70-overbought level at 83, suggesting that the strong upside movement may come to an end. However, the index is still sloping to the upside.
Further gains could see a fresh high towards the 423.6% Fibonacci retracement level of 5.5000 of the small retracement from 4.7185 to 4.4760.
In the event of a downside reversal in the next days, support could come from the 23.6% Fibonacci retracement level around 4.8700 of the upleg from 3.7660 to 5.1931. A penetration of this level could shift the short-term bullish outlook to neutral as it would take the pair near the 40-day SMA of 4.8065 at the time of writing.
USD/JPY Mid-Day Outlook
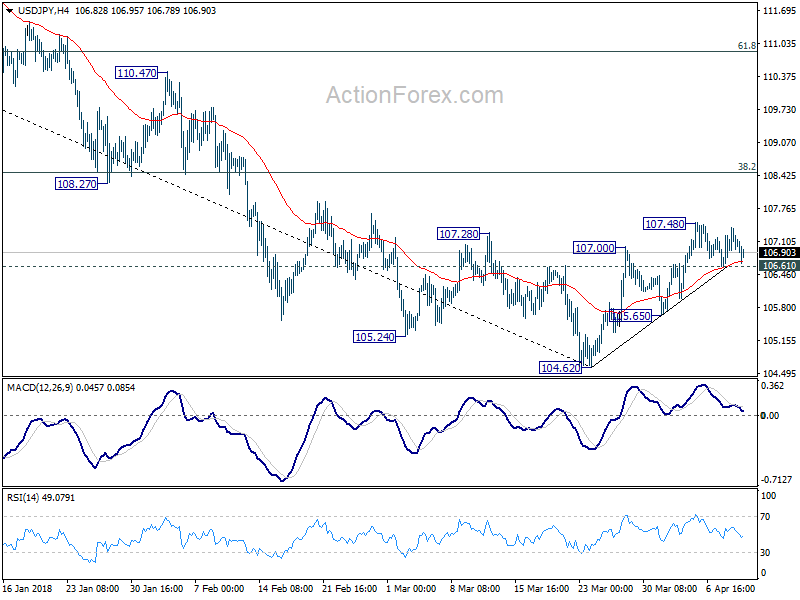
Daily Pivots: (S1) 106.50; (P) 106.85; (R1) 107.09; More...
At this point, USD/JPY is still staying in tight range below 107.48 temporary top. Intraday bias remains neutral first. On the downside, below 106.61 minor support will bring deeper fall to 105.65. Break of 105.65 support will indicate that the rebound is completed and target a test on 104.62 low. This will also retain medium term bearishness for down trend resumption later. On the upside, above 107.48 will extend the rebound to 38.2% retracement of 114.73 to 104.62 at 108.48 9 which is close to 108.12 and is crucial to determine the medium term outlook.
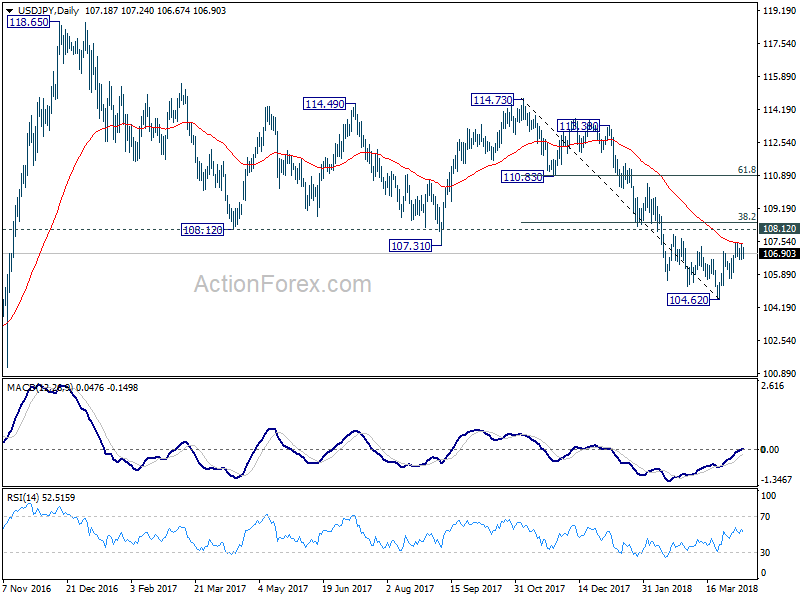
In the bigger picture, medium term down trend from 118.65 (2016 high) is still in progress and extending. Build up in downside momentum argues that it might be extending the whole corrective pattern from 125.85 (2015 high). 100% projection of 118.65 to 108.12 from 114.73 at 104.20 will be a key level to watch as firm break there could bring downside acceleration. And in that case, 98.97 key support level (2016 low) would at least be breached. This bearish case will now be favored as long as 108.12 support turned resistance holds.
USD/CHF Mid-Day Outlook
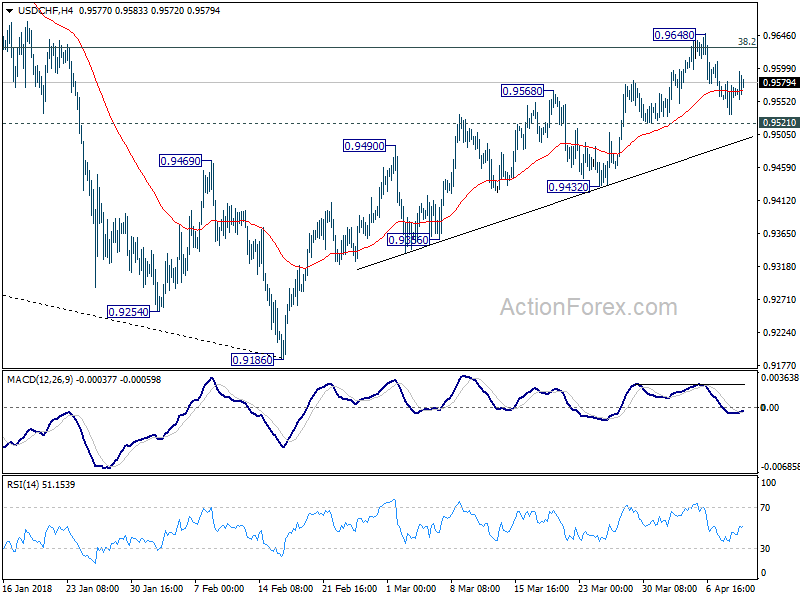
Daily Pivots: (S1) 0.9544; (P) 0.9577; (R1) 0.9593; More...
Intraday bias in USD/CHF remains neutral as it's still bounded in range of 0.9521/9648. On the downside, firm break of 0.9521 minor support will indicate rejection by 0.9626 key fibonacci resistance. Intraday bias would then be turned back to the downside for 0.9432 support first. Break there will also confirm completion of rebound from 0.9186 and turn outlook bearish. On the upside, sustained break of 0.9626 will be another evidence of larger reversal. In this case, further rise would be seen to next fibonacci level at 0.9900.
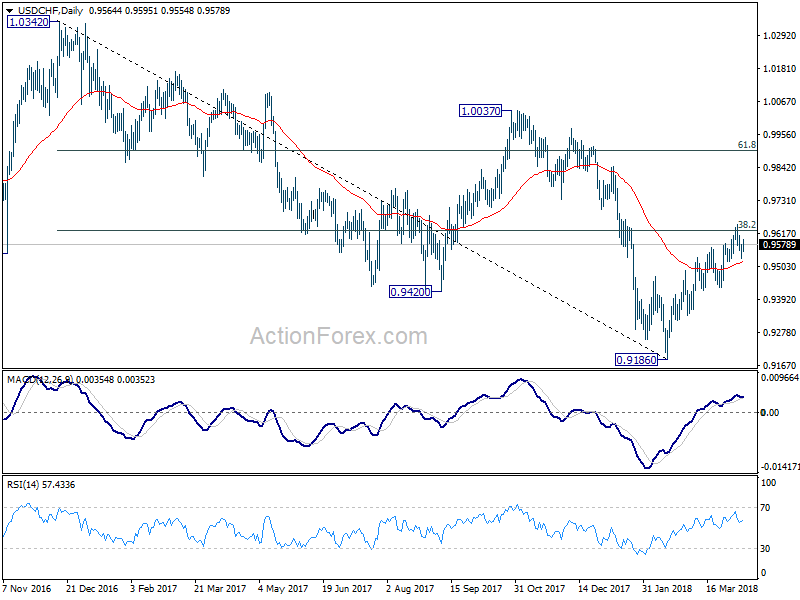
In the bigger picture, fall from 1.0342 is seen as a medium term down trend. Main focus is on 38.2% retracement of 1.0342 (2016 high) to 0.9186 (2018 low) at 0.9626. Sustained break there will add to the case of trend reversal and target 61.8% retracement at 0.9900 and above. However, rejection from 0.9626 will maintain medium term bearishness for another low below 0.9186.
Further Firming in U.S. CPI Growth in March
Highlights:
- Headline CPI dipped 0.1% lower on a month-over-month basis but the year-over-year rate accelerated to 2.4% from 2.2%.
- Excluding food & energy products, core CPI increased 0.2% on a month-over-month basis. The year-over-year rate rose to 2.1% from 1.8% as a large monthly drop in telecommunication prices a year ago fell out of the annual calculation.
- Recent underlying inflation trends have been firmer. Month-over-month gains in both core CPI and the alternative core PCE deflator have been running above a 2% annualized rate on average over the last 6 months.
Our Take:
As expected, annual CPI growth ticked up to a 2.4% year-over-year rate in March from 2.2% in February as a large drop in telecommunication prices a year ago finally fell out of the annual calculation. The headline rate is still being boosted in part by higher energy prices than a year ago. Annual core CPI growth, though, bounced back to its highest level since February last year at 2.1% — and slightly above Federal Reserve policymakers’ 2% inflation objective. Recent trends have been stronger than that. The 6-month rolling average of month-over-month core CPI growth was 2.6% at an annualized rate in March by our calculation. That marks the third straight month at a 2 1/2% or greater pace. Month-over-month increases in the alternative core PCE deflator preferred by the Fed have also been running above the Fed’s 2% inflation objective over the half year to February.
There is still little evidence that inflation is coming unhinged on the upside. Further signs of firming, though, along with ongoing tightening in labour markets, add to the evidence that the economy is operating close to if not somewhat beyond long-run capacity constraints. That is fully consistent with the view that — barring some unexpected shock — interest rates will continue to grind higher to gradually withdraw still-accommodative monetary policy conditions
GBP/USD Mid-Day Outlook
Daily Pivots: (S1) 1.4134; (P) 1.4160; (R1) 1.4202; More....
Despite minor retreat after hitting, 1.4222, with 1.4144 minor support intact, intraday bias in GBP/USD remains on the upside. Break of 1.4243 resistance will bring retest of 1.4345 high. Firm break of 1.4345 will resume medium term rally and target 61.8% projection of 1.3038 to 1.4345 from 1.3711 at 1.4519 next. On the downside, below 1.4144 minor support will turn intraday bias neutral first. But outlook will stay cautiously bullish as long as 1.3964 support holds in case of retreat.
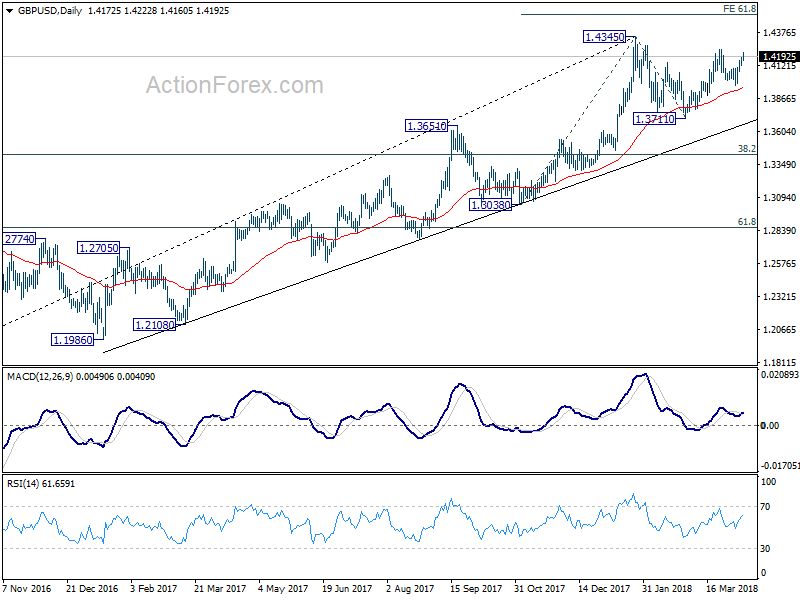
In the bigger picture, as long as 1.3651 resistance turned support holds, medium term outlook in GBP/USD will remain bullish. Rise from 1.1946 is at least correcting the long term down trend from 2007 high at 2.1161. Further rally would be seen back to 38.2% retracement of 2.1161 (2007 high) to 1.1946 (2016 low) at 1.5466. However, GBP/USD fails to sustain above 55 month EMA (now at 1.4267) so far. Break of 1.3651 will be the first sign of medium term reversal and turn focus to 1.3038 support for confirmation.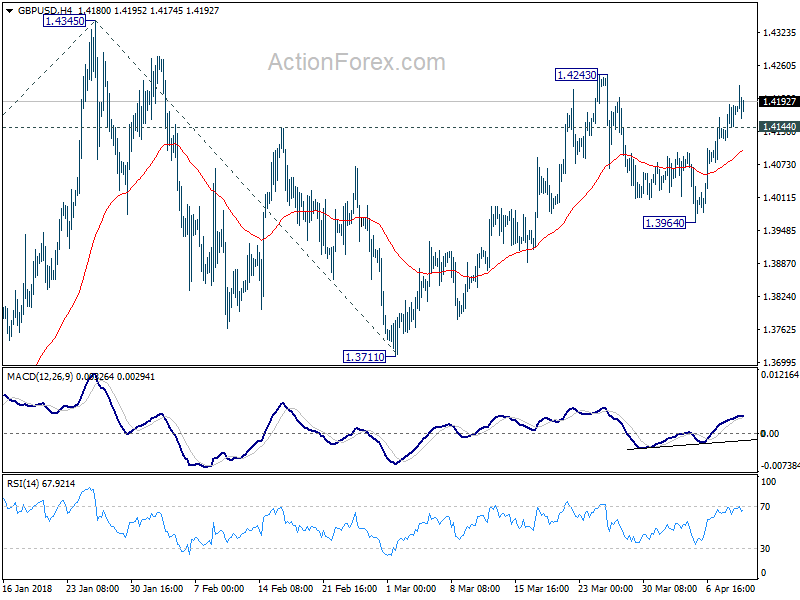
US: Core Inflation Springs Back above 2% in March
The headline consumer price index (CPI) was down 0.1% (month-on-month) in March, as a 4.9% drop in gasoline prices weighed on the headline. But, favorable base effects took inflation up to 2.4% (year-on-year) – the highest reading in just over a year.
The 2.8% decline in energy prices contributed to the flat headline reading, as prices for food were up a modest 1.3% in March. Energy prices were still 7% higher than their year-ago levels in March.
As expected, core inflation rose 0.2% on the month, matching February's pace. Also as expected, the year-on-year pace of core inflation jumped back up above 2.0% in March to 2.1%, as the drop in cell phone contract prices last year fell out of the year-on-year calculation.
Delving into the details, shelter inflation accelerated, up 0.4% on the month. While rent and owners' equivalent rent were both up a sturdy 0.3% in March, lodging away from home prices popped back up after a period of weakness. Healthy increases were also seen for medical care (+0.4% m/m), personal care (+0.3% m/m) and motor vehicle insurance (+0.3%).
Areas of inflation weakness were found in lower prices for apparel (-0.6%), communication (-0.3%), used cars and trucks (-0.3%) and education and tobacco.
Overall inflation for core services now stands at 2.9% on the month, the fastest pace since March 2017. Core goods continue to be in deflationary territory (-0.3% year/year), but this downward pressure on overall core has been fading in recent months.
Key Implications
Now that the large drop in cell phone contract pricing last year has fallen out of the inflation calculation, core inflation is back above 2% for the first time in a year. We expect core inflation to continue to rise as a strong economy and wage pressures see price pressures increasingly percolate through the economy.
With the Fed's 2% target in sight (the Fed's preferred PCE metric isn't quite there, but likely will be in the next few months) the question is how much more juice is still in the tank. Tax cuts and increased government spending present clear upside to near-term growth, but recent financial volatility and the threat of trade wars threaten to deflate some of the impact. This is the key question the FOMC is wrestling with as it calibrates the pace of rate hikes. We could get some insights on this score when the minutes from the March FOMC meeting are released later this afternoon. Stay tuned.
European Markets Seeing Red as Trump Threatens to Attack Syria
German and French stock markets have lost ground in the Wednesday session. Currently, the DAX is trading at 12,277 points, down 1.00% on the day. The CAC index is also in the red, with losses of 0.72% on the day. On the release front, there are no major indicators in the eurozone. ECB President Mario Draghi is speaking at an event in Frankfurt. In the US, the Federal Reserve publishes the minutes of its March rate meeting. On Thursday, the ECB releases the minutes of its March rate meeting.
European stock markets have been volatile this week. The markets reacted positively as the trade battle between the US and China took a pause, after the two economic giants slapped each other with tariffs. On Sunday, US officials sought to lower the temperature on the Sunday television programs, and Treasury Secretary Steve Mnuchin said that he doesn’t “expect there will be a trade war.” This was followed by a calm message from Chinese President Xi Jimping on Tuesday. Xi was speaking at a development conference in China, and promised to lower tariffs on vehicle imports into China. However, sentiment has turned negative on Wednesday, as the rhetoric between the US and Russia has ratcheted higher. Syrian forces allegedly used chemical weapons against rebel positions last week, and a UN Security Council meeting ended inconclusively after Russia cast a veto on a US proposal to prove the attack. US President Trump has warned that a US response is on the way, and Russia has countered that it will respond to any US move. If Trump makes good on his promise, investors could lose their risk appetite and the markets could spiral downwards.
The markets are keeping a close eye on the release of the FOMC minutes. The minutes could provide the markets with some insights regarding the Federal Reserve’s monetary policy for this year. Will the Fed press the rate trigger three times this year, or four? The current Fed forecast calls for three rate hikes, but this could be revised upwards if inflation rises. If the FOMC minutes point to a hawkish stance from policymakers, this could send US markets lower, which could lead to losses for European markets as well.
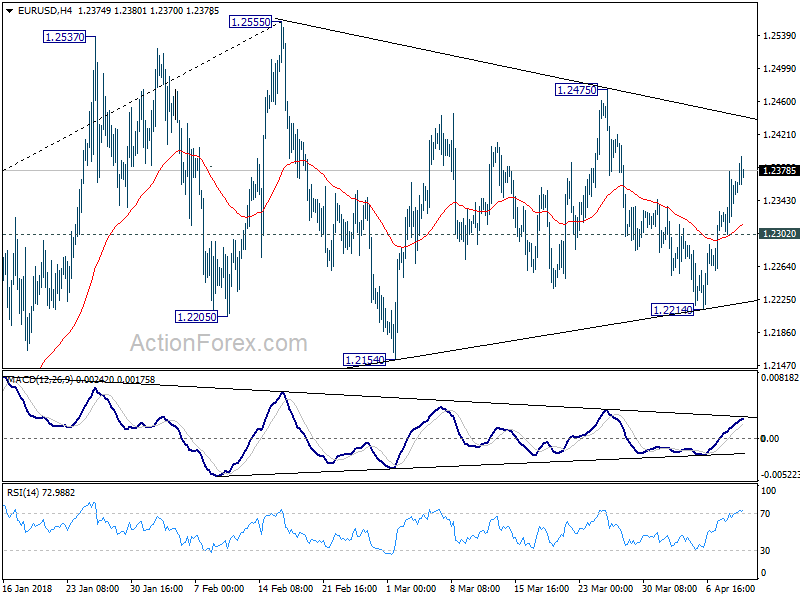
EUR/USD Mid-Day Outlook
Daily Pivots: (S1) 1.2312; (P) 1.2345 (R1) 1.2387; More....
Intraday bias in EUR/USD remains on the upside as rise from 1.2214 is in progress, hitting 1.2395 so far. Further rally should be seen for 1.2475 first. Break will target key resistance level at 1.2555 high. For now, as EUR/USD is bounded in range trading pattern from 1.2555, break of 1.2302 minor support will turn bias back to the downside for 1.2214 instead.
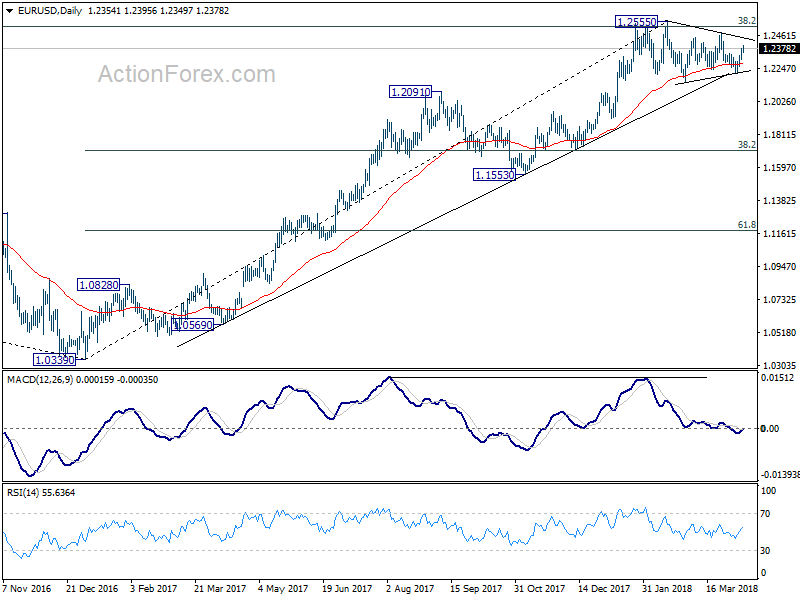
In the bigger picture, key fibonacci level at 38.2% retracement of 1.6039 (2008 high) to 1.0339 (2017 low) at 1.2516 remains intact despite attempts to break. Hence, rise from 1.0339 medium term bottom is still seen as a corrective move for the moment. Rejection from 1.2516 will maintain long term bearish outlook and keep the case for retesting 1.0039 alive. Firm break of 1.1553 support will add more medium term bearishness. However, sustained break of 1.2516 will carry larger bullish implication and target 61.8% retracement of 1.6039 to 1.0339 at 1.3862 in medium term.