Sample Category Title
GBPUSD Strongly Bullish Above 1.4088 Level
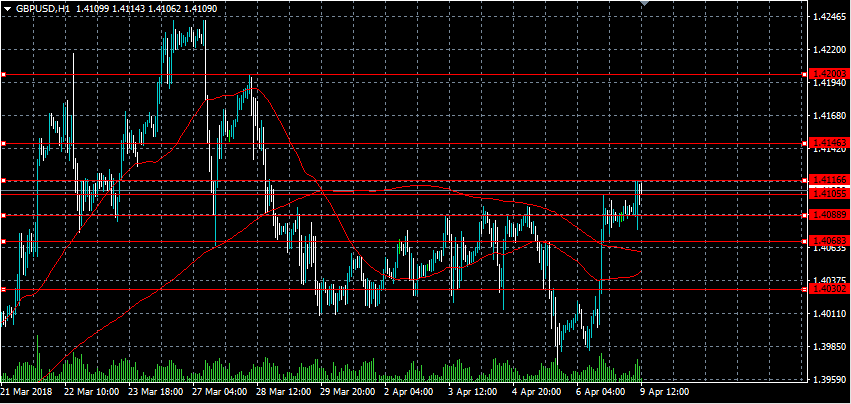
The British pound has continued to gain traction against the U.S dollar during the European session, with price-action so far finding intraday resistance from the 1.4116 level. The GBPUSD pair has also found dip-buying demand on retracements, with a strong bullish bias in place while price holds above the 1.4088 level. Moving into the U.S session, traders and investors may become cautious ahead of this week’s key inflation data releases from the U.S economy.
The GBPUSD pair is strongly bullish while trading above the 1.4088 level, key upside resistance is now found at the 1.4146 and 1.4200 levels.
Should price-action on the GBPUSD pair decline below the 1.4088 level, key support is found at the 1.4068 and 1.4030 levels.
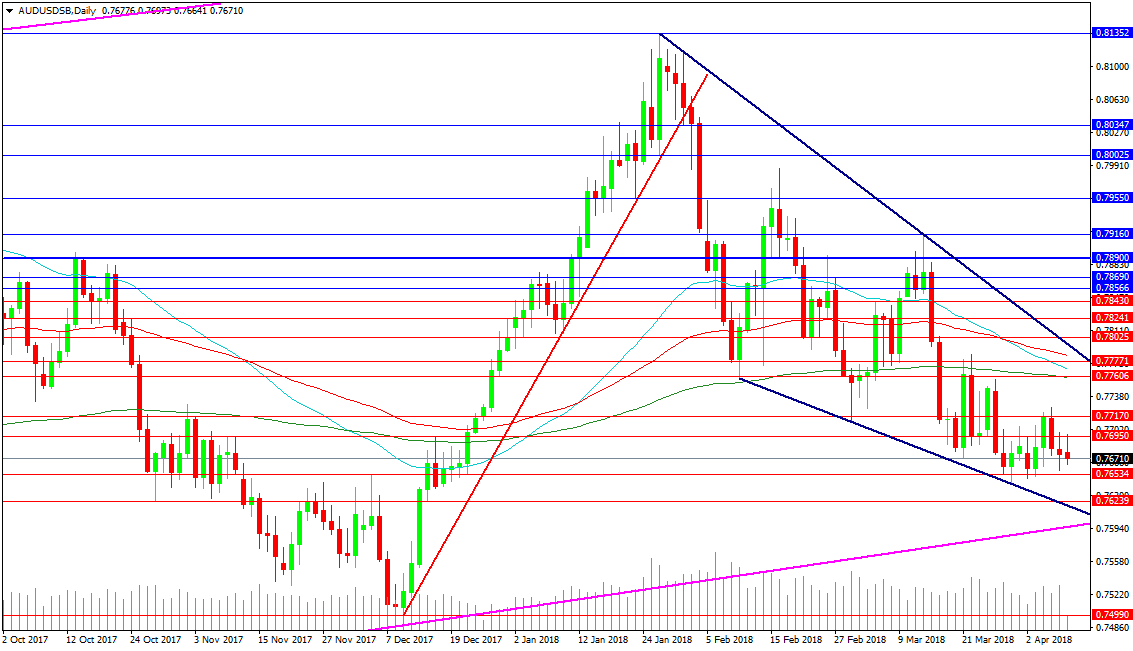
Forex Analysis: AUDUSD And GBPJPY
The AUDUSD pair has settled into a range over the last couple of weeks and remains supported above 0.76400. Further losses can arise if this level is broken, with traders currently closely watching the 0.76600 level for early signs of a break down. The 0.76000 area contains two trend lines and should provide some strong support. A loss of that area would target 0.75000.
Resistance comes at the 0.76950 level, followed by the recent high at 0.77260. The 200 DMA is found at 0.77600, with the 50 DMA, having just crossed under the 100 DMA, at 0.77650. The falling trend line is close to the 100 DMA at 0.77850. A break above this area puts buyers back in control and targets 0.78900, followed by 0.79550 and 0.80000. A break higher would lead to a retest of the highs from January at 0.81352.
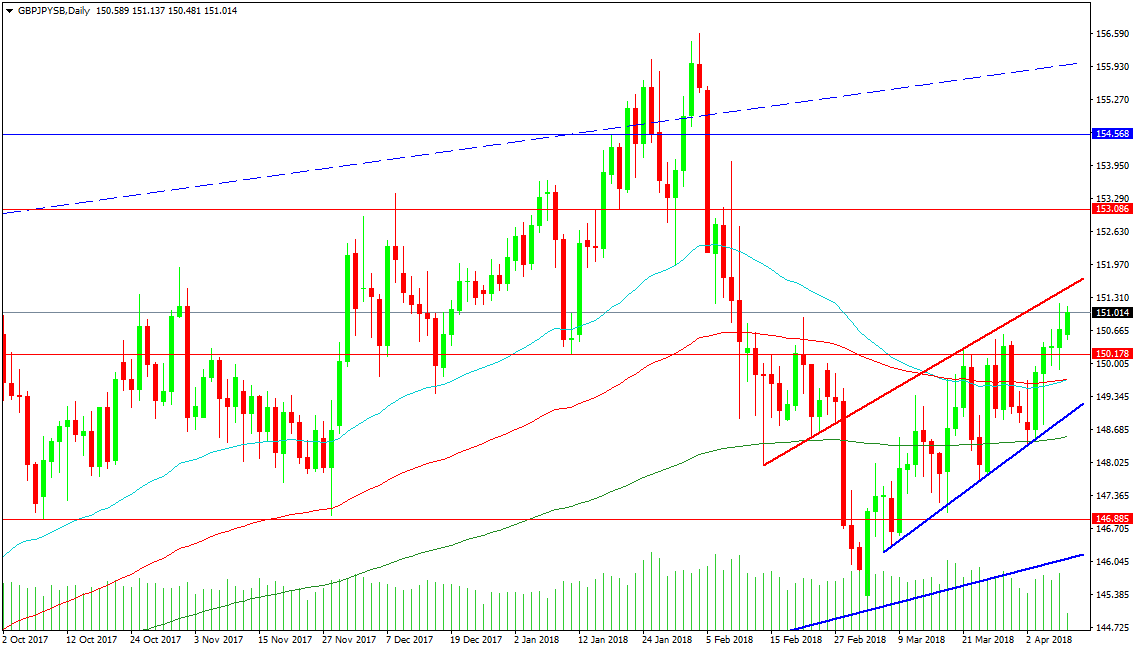
GBPJPY
This pair has rallied from the supporting trend line at 144.980 in early March, back up through the 150.000 level and is currently trading around 151.000. This rally may turn into a bearish pattern but that would require a break below the supporting trend line at 149.020. In order to reach that trend line, the moving averages at 149.700 need to be broken. These moving averages are the 50 DMA and the 100 DMA, which are starting to turn higher at present. The 200 DMA is supportive at 148.537. The 146.885 level is also supportive should price break down. Targets on the downside come in at 142.000.
Resistance on the chart is represented by the rising red trend line at 151.420. Price action may choose to follow this line higher but a bigger move would target the 153.086 area, with 154.568 a clear overhead target. The recent highs at 156.600 are protected in the short term by the broken trend line at 155.907.
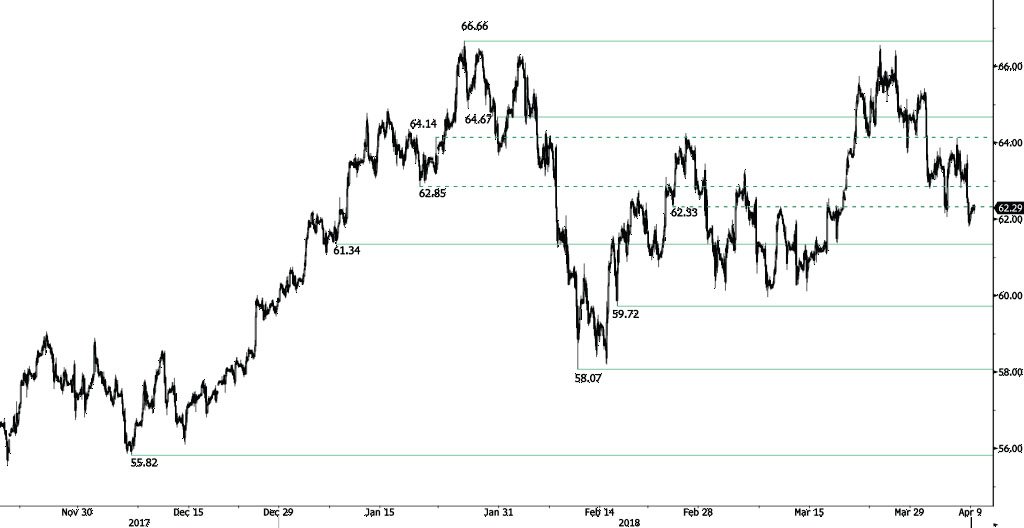
CRUDE OIL Edging Higher
Crude oil is bouncing off from 61.81 low, approaching the 62.45 range. The bullish pattern started in November 2017 is somewhat weakened since recent decline started at the end of March. Crude oil is contained between hourly support and resistance at 61.34 (08/01/2018 low) and 64.67 (30/01/2018 high). The technical structure suggests short-term increase.
In the long-term, crude oil has recovered after its sharp decline last year. However, we consider that further weakness is very likely. For the time being, the pair lies in an upside trend since June 2017. Support lies at 42.20 (16/11/2016) while resistance is located at 77.83 (20/11/2014). Crude oil is trading above its 200 DMA.
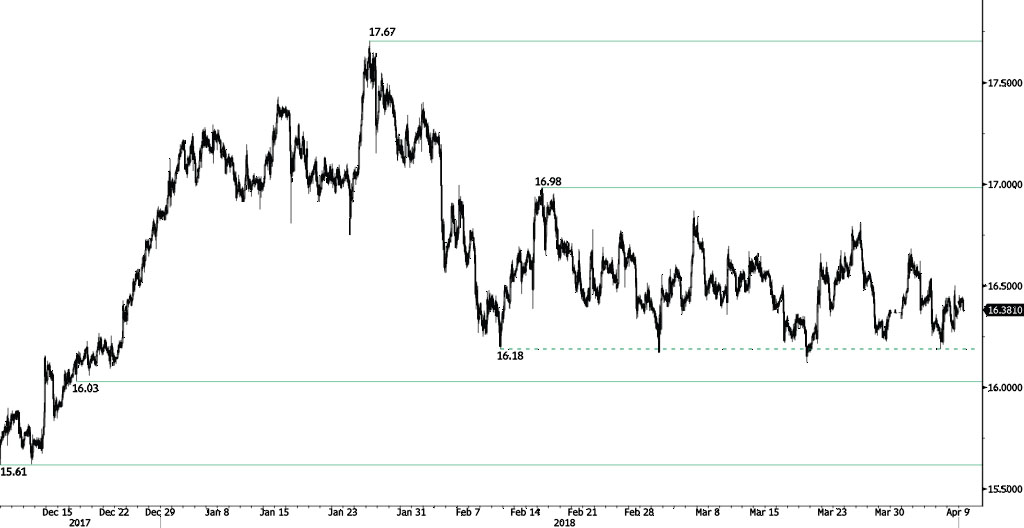
SILVER Slight Decline
Silver is declining from 16.45 high, heading along 16.34 range. Silver is contained between hourly support and resistance given at 16.03 (18/12/2017 low) and 16.98 (15/02/2018 high). The short-term technical structure suggests short-term downward moves.
In the long-term, the trend remains negative/ sideways. Further downside is very likely. The pair is trading below its 200 DMA. Resistance is located at 21.58 (10/07/2014 high). Strong support can be found at 11.75 (20/04/2009).
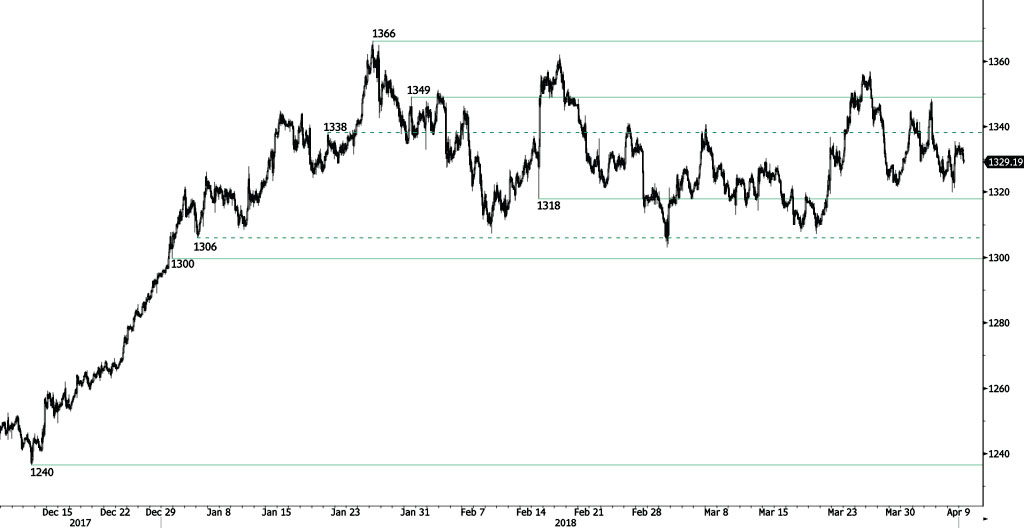
GOLD Profit-Taking
Gold strong selling pressures start back after bouncing off from 1320 low, approaching the 1325 range. Hourly support and resistance remain at 1318 (14/02/2018 low) and 1349 (30/01/2018 high). The technical structure suggests further short-term decrease.
In the long-term, the technical structure suggests that there is a growing upside momentum. A break of 1'392 (17/03/2014) is required to confirm it. A major support can be found at 1'045 (05/02/2010 low).
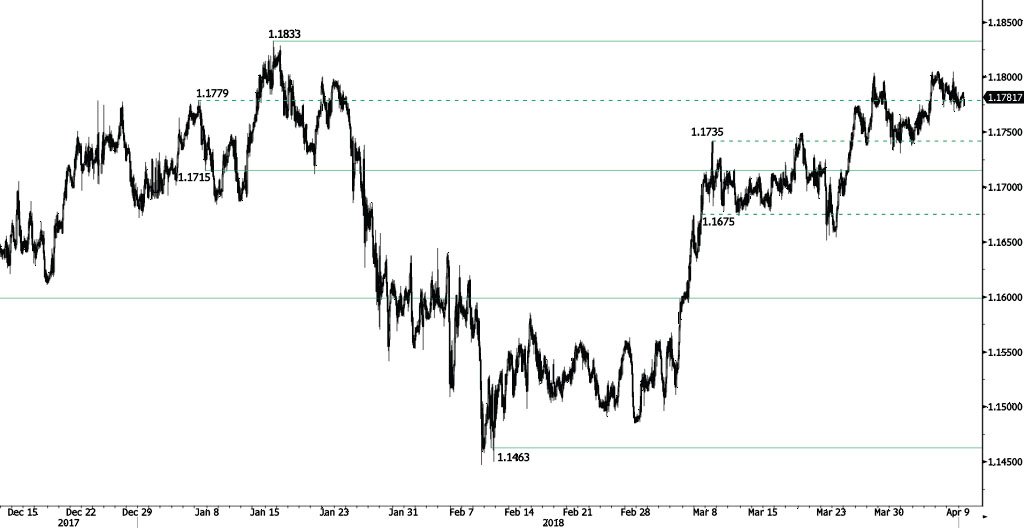
EUR/CHF Trading Sideways
EUR/CHF is trading sideways after recovering from 1.1772 low. EUR/CHF bullish trend started in March is maintained. Hourly support and resistance are given at 1.1715 (07/01/2018 low) and 1.1833 (15/01/2018 high). The short-term technical structure suggests short-term sideways trading moves.
In the longer term, the technical structure has reversed. Strong resistance is given at 1.20 (level before the unpeg). Yet, the ECB's slowing QE program is likely to cause buying pressures on the euro, which should weigh in favour of the EUR/CHF. Support can be found at 1.0234 (20/04/2015 low).
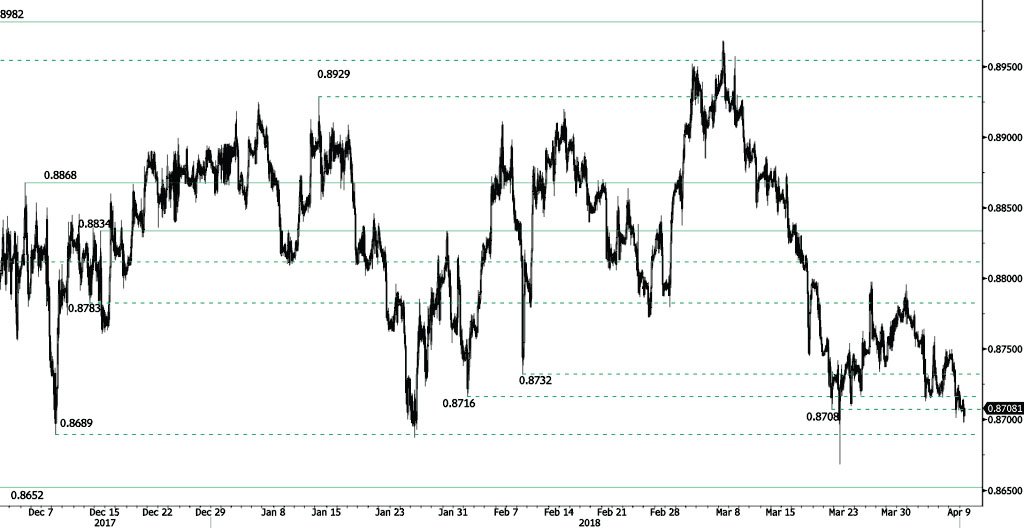
EUR/GBP Further Weakness
EUR/GBP is decreasing further, breaking hourly support at 0.8708 (21/03/2018 low) and approaching its January low. Heading along the 0.87 range. EUR/GBP bearish pattern started in March is maintained. Hourly support and resistance are now given at 0.8652 (08/06/2017 low) and 0.8834 (14/12/2017 high). The technical structure suggests further short-term decrease.
In the long-term, the pair has largely recovered from 2015 lows. The technical structure suggests further upside pressure. Strong resistance can be found at 0.9500 (psychological level) while support remains at 0.8304 (05/12/2016 low). The pair is trading below its 200 DMA.
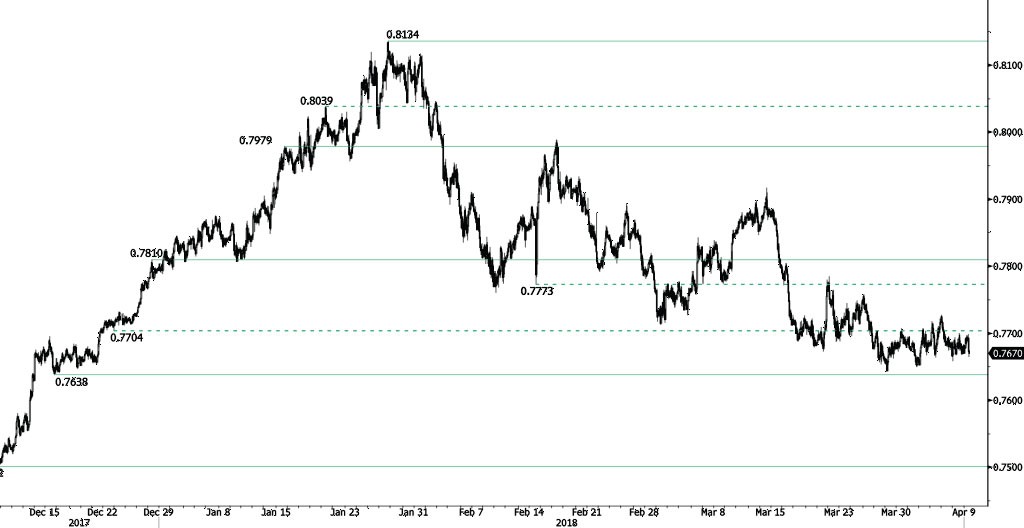
AUD/USD Weakening
AUD/USD is declining following recent sideways trading phase, approaching December 2017 low and heading along the 0.7665 range. The bearish pattern started in February 2018 is maintained. Hourly support and resistance are given at 0.7638 (15/12/2017 low) and 0.7810 (28/12/2017). The technical structure suggests further short-term decrease.
In the long-term, the upward trend slows down after failing to reach key resistance at 0.8164 (14/05/2015 low). Key support stands at 0.6009 (31/10/2008 low). A break of the key resistance at 0.8164 (14/05/2015 high) is needed to invalidate our long-term bearish view.
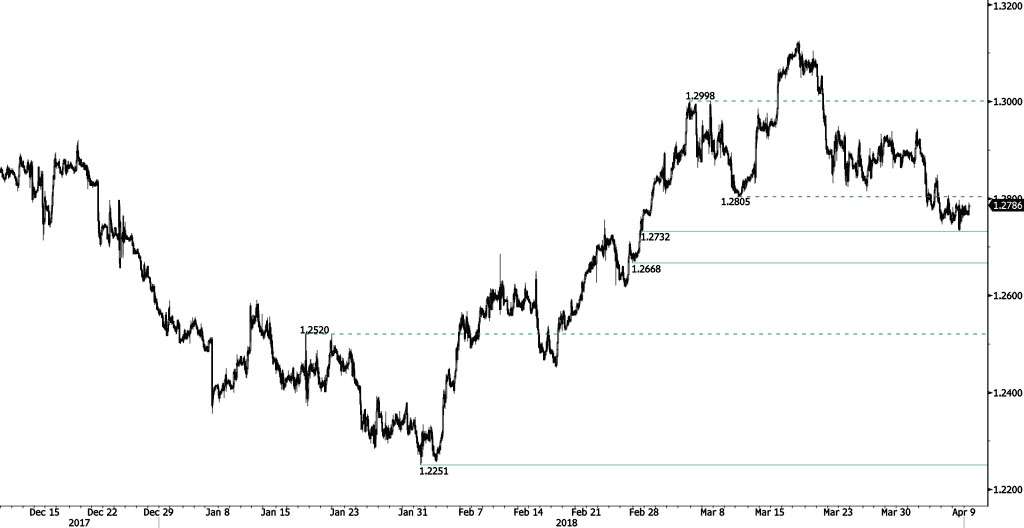
USD/CAD Failing To Break Support At 1.2732
USD/CAD is bouncing off from 1.2734 low, expected to increase along the 1.2795 range. Hourly support and resistance remain at 1.2732 (27/02/2018 low) and 1.3308 (23/06/2017 high). The short-term technical structure suggests further short-term increase.
In the longer term, the pair is trading between resistance point at 1.3805 (05/05/2017 high) and support at 1.2128 (18/06/2015 low). Strong resistance is given at 1.4690 (22/01/2016 high). The pair is likely to head lower. The pair is trading above its 200 DMA.
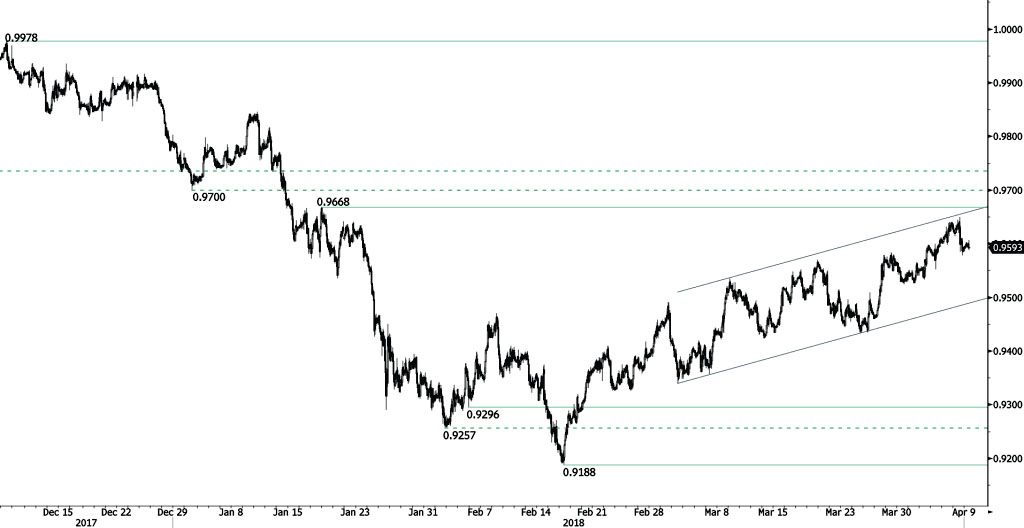
USD/CHF Contained Within Upward Trend Channel
USD/CHF rise continues after approaching trend channel upper bound, bouncing off from 0.96 low. The pair is heading along the 0.9610 range. The bullish pattern started from 0.9188 (16/02/2018 low) continues. The pair is contained between hourly support and resistance given at 0.9296 (05/02/2018 low) and 0.9668 (17/01/2018 high). The technical structure suggests further short-term upward moves.
In the long-term, the pair is still trading in range since 2011 despite some turmoil when the SNB unpegged the CHF. Key support lies at 0.9072 (07/05/2015 low) while resistance at 1.0344 (15/12/2016 high) is distanced. The technical structure favours a long term bullish bias since the unpeg in January 2015.