Sample Category Title
Ball back on Trump’s court after China’s calculated response
A quick recap on the trade war developments.
US announced the list of 1300 Chinese product lines included in the Section 301 tariff. Total of product value adds up to USD 50b. Products are broad based but technology related, centered around the "Made in China 2025" plan. Tariff rate is 25%. There is no implementation date yet. White house will seek public comment before finalizing, including hearing on May 15. And companies could file objections until May 22.
China announced retaliation tariffs on 106 US products. Total product values add up to USD 50b. Products include soybeans, autos, aircrafts etc, targeted at Trump's and Republicans' supporter base. Tariff rate is 25%. There is no implementation date yet. Vice Finance Minister Zhu Guangyao says there is room for negotiation and hoped there will be a resolution via WTO. There is no arrangement for public comments, no hearings whatever regarding the retaliation tariffs. And actually, no one expects such kind of democratic arrangements in China. That's said, China is ready to fire any time.
To us, the most important message from today's announcements is that China is adopting a hard stance on the issue, and they're ready to fight, in calculated way. Firstly, the most obvious one was the arrangement of the Finance Ministry's press conference. It's held 30mins after Chinese stock market close. There will be two days of holidays ahead. And there are much room for sentiments to stabilize and progress be made before market opens again. Secondly, China's action is rather targeted to Trump and Republicans. It's drawing a clear line to the Americans that it's not righting with all of them. Thirdly, the speed of the response showed that China is well prepared for it, politically too. And remember that Xi has just recently secured his political base by giving him the right to have unlimited terms as President of China. And, so far, has any one heard of opposition voice from China to warn the Chinese government not to enter into trade war? Probably not.
So now, the ball is in Trump's court.
EUR/CHF Continued Bullish Consolidation
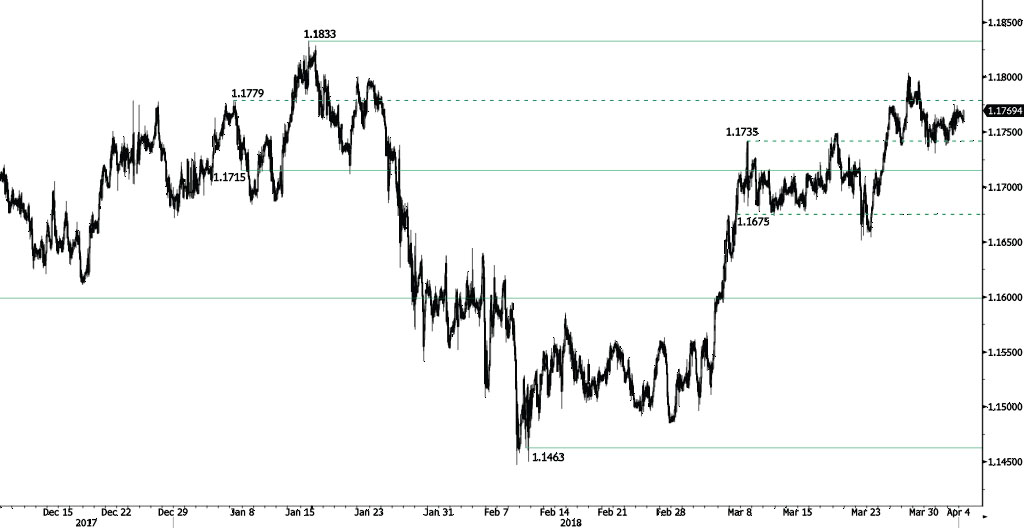
EUR/CHF consolidation phase continues, approaching the 1.1775 range. Hourly support and resistance are given at 1.1715 (07/01/2018 low) and 1.1833 (15/01/2018 high). The shortterm technical structure suggests further shortterm sideways trading moves.
In the longer term, the technical structure has reversed. Strong resistance is given at 1.20 (level before the unpeg). Yet, the ECB's slowing QE program is likely to cause buying pressures on the euro, which should weigh in favour of the EUR/CHF. Support can be found at 1.0234 (20/04/2015 low).
EUR/GBP Heading Higher
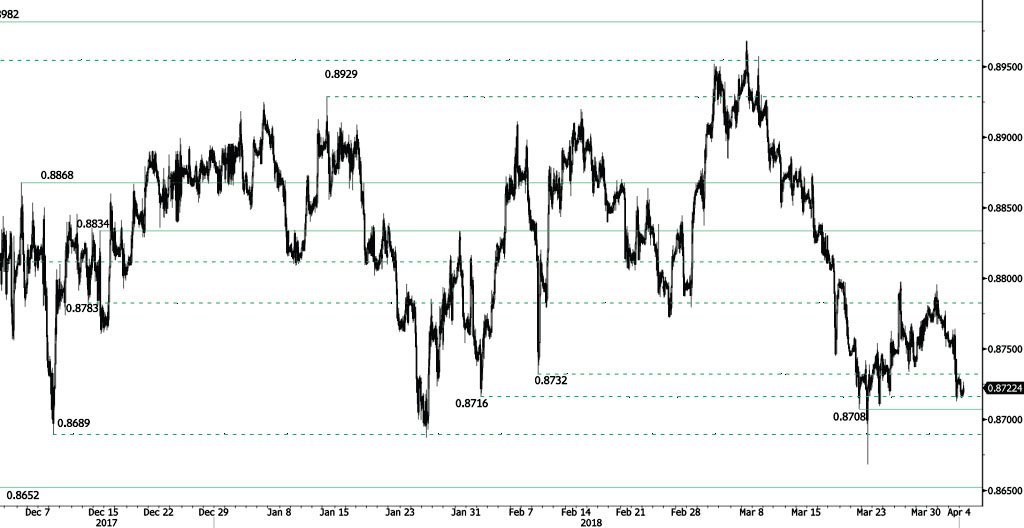
EUR/GBP is bouncing off from 0.8713 low, breaking hourly support at 0.8732 (08/02/2018 low) and heading along the 0.8745 range. EUR/ GBP bearish pattern started in March is maintained. Hourly support and resistance are now given at 0.8708 (21/03/2018 low) and 0.8834 (14/12/2017 high). The technical structure suggests short-term increase.
In the long-term, the pair has largely recovered from 2015 lows. The technical structure suggests further upside pressure. Strong resistance can be found at 0.9500 (psychological level) while support remains at 0.8304 (05/12/2016 low). The pair is trading below its 200 DMA.
Euro Edges Higher As Eurozone CPI Within Expectations
EUR/USD continues to have an uneventful week. In the Wednesday session, the pair is trading at 1.2279, up 0.08% on the day. On the release front, it’s another busy day. In the eurozone, inflation indicators were within expectations. CPI Flash Estimate rose to 1.4%, matching the forecast. Core CPI Flash Estimate remained unchanged at 1.0%, just shy of the estimate of 1.1%. Eurozone unemployment ticked lower to 8.5%, matching the forecast. In the US, ADP Nonfarm Payrolls is expected to drop sharply to 208 thousand. We’ll also get a look at ISM Non-Manufacturing PMI, which is forecast to drop to 59.0 points.
Eurozone inflation remains slightly above 1 percent, well below the ECB target of around 2 percent. This means that the ECB is unlikely to change its monetary policy, although Germany wants to see a tighter policy, which would be better suited to its robust economy. In January, the ECB tapered its stimulus program, from EUR 60 billion to 30 billion per month. The stimulus is scheduled to wind up in September, and it remains an open question as to whether Mario Draghi will extend the scheme. If the eurozone economy remains on track and inflation moves higher, there is a strong likelihood that the ECB will adopt a policy of normalization, after years of stimulus. Such a move would likely boost the euro.
The Chinese government has fired the latest salvo in the escalating trade war with the United States. On Wednesday, China announced 25% tariffs on 106 American products, including soy beans, wheat and some motor vehicles. The value of these US exports amounts to some $50 billion – the same value as Chinese exports which have been slapped with tariffs by President Trump. This represents a significant raising of the stakes, and has the markets worried. China’s deputy finance minister has said that a trade war between the two sides would be a ‘lose-lose’, and few investors would disagree with his diagnosis. However, neither Trump nor Chinese President Xi Jinping has blinked so far, and the crisis shows no signs of being resolved anytime soon. As one US analyst wrote this week, “trade wars are easy to start but hard to stop.”
AUD/USD Decreasing
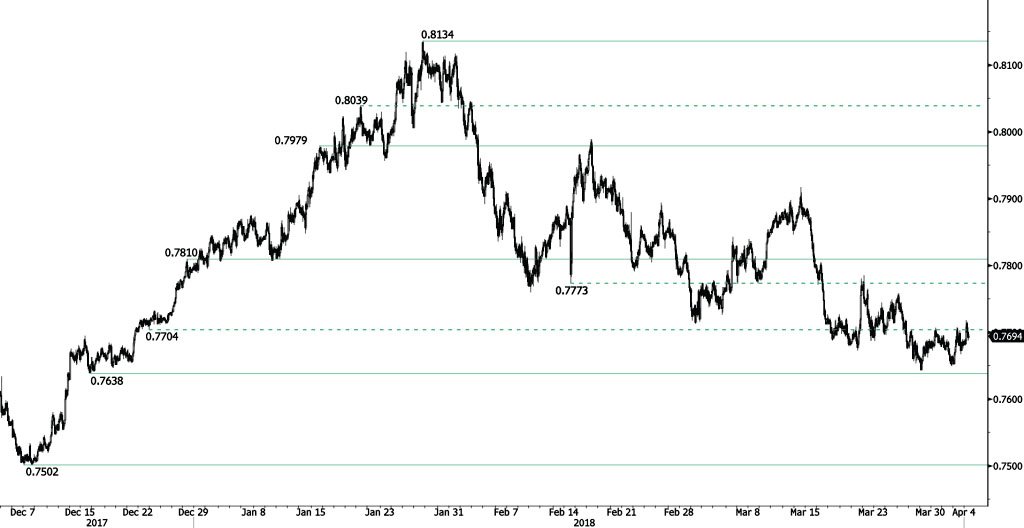
AUD/USD is weakening, after reaching 0.7717 high, heading along the 0.7665 range. Hourly support and resistance are given at 0.7638 (15/12/2017 low) and 0.7810 (28/12/2017 high). The technical structure suggests short-term decrease.
In the long-term, the upward trend slows down after failing to reach key resistance at 0.8164 (14/05/2015 low). Key support stands at 0.6009 (31/10/2008 low). A break of the key resistance at 0.8164 (14/05/2015 high) is needed to invalidate our long-term bearish view.
Market reactions to US-China trade war: HK HSI down -2.2%, DAX suffering most in Europe
Reactions to the US announce on Section 301 tariffs and China's retaliation tariffs so far:
Hong Kong HSI closed down -2.19%. China SSE closed down -0.18%. However, note that the announcement of Chinese Ministry of Finance was done 30 mins after the stock market close. And there will be two days of holidays ahead. It's obviously China doesn't want to rock its own markets
In Europe, DAX seems to be most hurt as it's trading down -1.3% right now. CAC is down -0.65% and FTSE is down -0.55% too.
DOW futures trading down -450 pts right now.
Gold gains over USD 10 to above 1340. But it's still stuck in range between 1300 and 1366, established since last December.
In forex markets, AUD and CAD are notably down after the announcement. Yen surges broadly on risk aversion.
USD/CAD Sideways Price Action
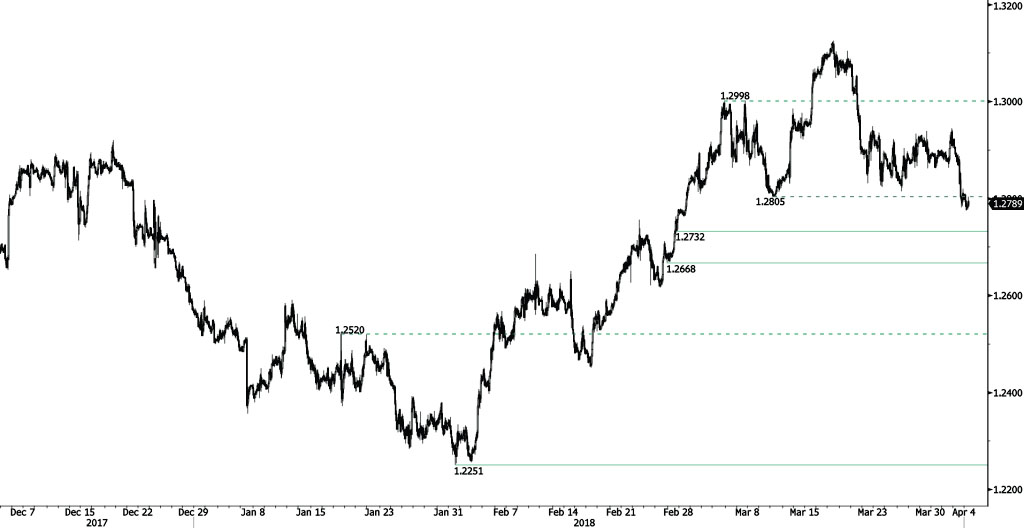
USD/CAD is trading sideways after recent decline at 1.2775, breaking hourly support at 1.2805 (12/03/2018 low). Expected to remain along the 1.2820 range. Hourly support and resistance remain at 1.2732 (27/02/2018 low) and 1.3308 (23/06/2017 high). The short-term technical structure suggests short-term sideways trading moves.
In the longer term, the pair is trading between resistance point at 1.3805 (05/05/2017 high) and support at 1.2128 (18/06/2015 low). Strong resistance is given at 1.4690 (22/01/2016 high). The pair is likely to head lower. The pairs is trading above its 200 DMA
USD/CHF Riding Lower
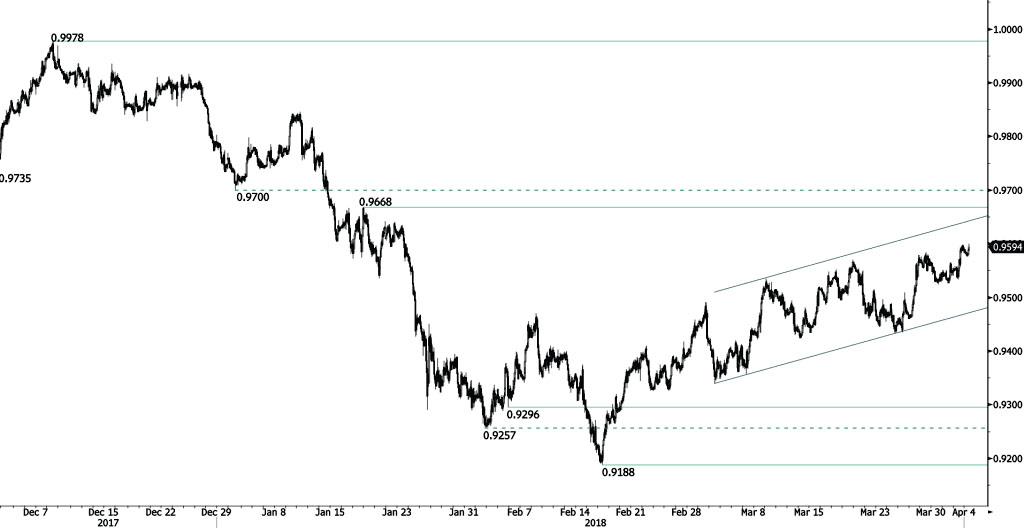
USD/CHF is heading lower after reaching 0.9599, approaching the 0.9550 range. The bullish pattern started from 0.9188 (16/02/2018 low) continues. The pair is contained between hourly support and resistance given at 0.9296 (05/02/2018 low) and 0.9668 (17/01/2018 high). The technical structure suggests short-term downward moves.
In the long-term, the pair is still trading in range since 2011 despite some turmoil when the SNB unpegged the CHF. Key support lies at 0.9072 (07/05/2015 low) while resistance at 1.0344 (15/12/2016 high) is distanced. The technical structure favours a long term bullish bias since the unpeg in January 2015.
USD/JPY Weakening
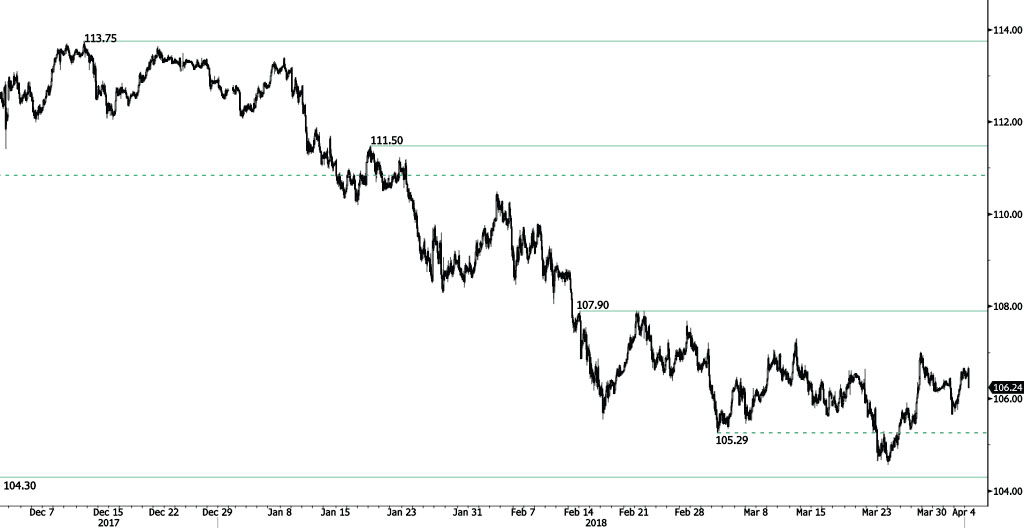
USD/JPY is declining after reaching 106.69 high, heading along the 106.05 range. The bearish pattern started in January 2018 is maintained. The short-term technical structure suggests short-term decrease.
We favor a long-term bearish bias. Support remains at 101.20 (09/11/2016 low). A gradual rise toward the major resistance at 125.86 (05/06/2015 high) seems unlikely. Expected to decline further support at 101.20 (09/11/2016 low). The pair trades largely below its 200 DMA.
GBP/USD Edging Higher
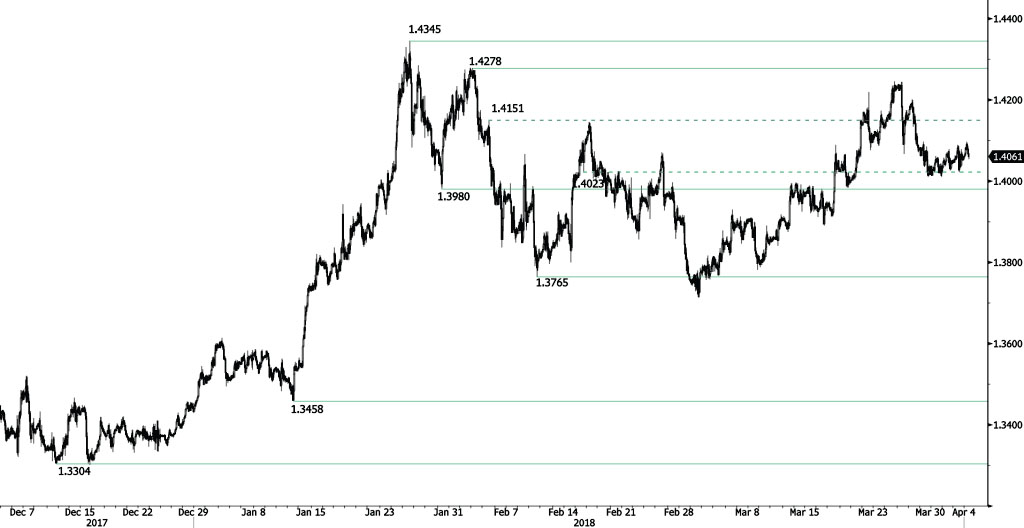
GBP/USD continues its rise, currently trading at 1.4065 and heading higher along the 1.4095 range. Hourly support and resistance are given at 1.3980 (30/01/2018 low) and 1.4278 (02/02/2018 high). The technical structure suggests short-term increase.
The long-term technical pattern is reversing. The Brexit vote had paved the way for further decline but the pair is moving to 2016 highs. Long-term support and resistance are given at 1.1841 (07/10/2017 low) and 1.5018 (24/06/2016 high).