Sample Category Title
EUR/USD Slight Increase
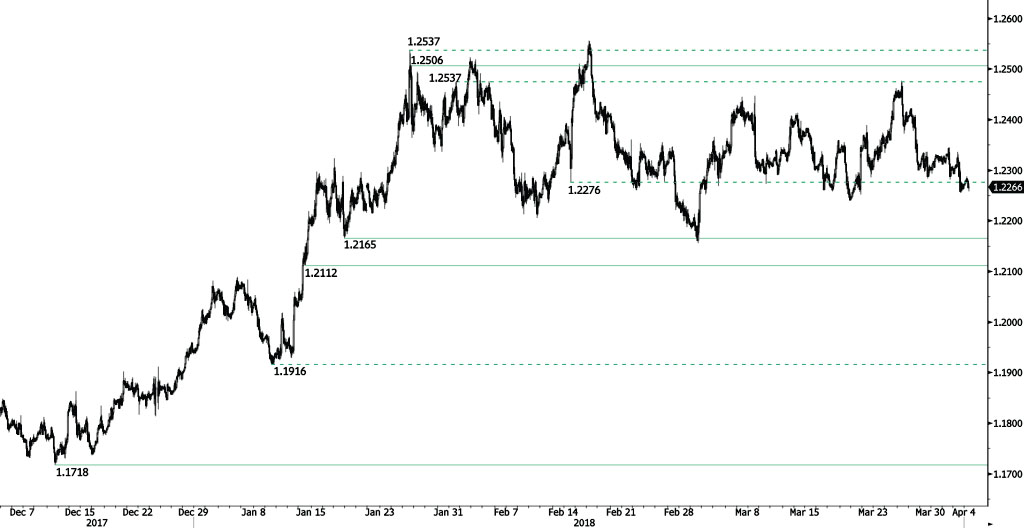
EUR/USD is trying to bounce following recent decline at 1.2254. Expected to head slightly higher along the 1.2285 range. The pair is currently maintained between hourly support and resistance given at 1.2165 (17/01/2018 low) and 1.2506 (25/01/2018 high). The technical structure suggests short-term upward moves.
In the longer term, the momentum is turning largely positive. We favor a continued bullish bias. Key resistance is holding at 1.2886 (15/10/2014 high) while strong support lies at 1.1554 (08/11/2017 low). Slight increase.
Forex Analysis: US30 And USDJPY
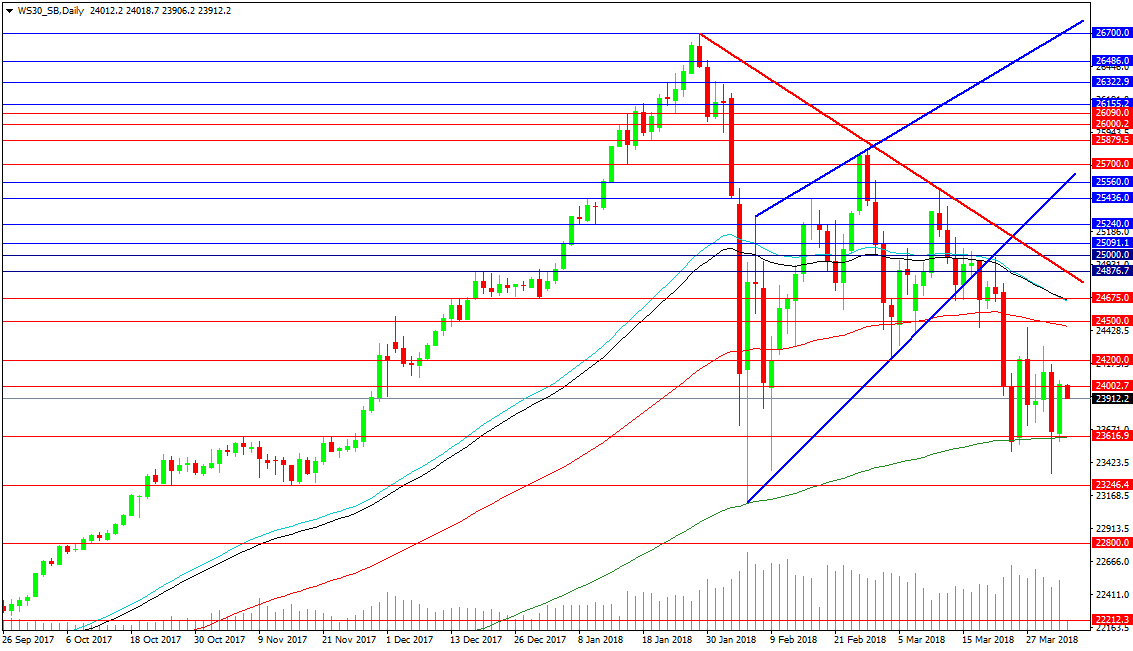
The US30 Index has retested its 200 DMA once again, after breaking down from its bearish rising wedge. It has moved back up to resistance at 24000.00 and remains in this vicinity. Traders are eying the chart for a potential break out, citing 24200.00 as a resistance level to overcome, and a break above 24500.00 and the 100 DMA as confirming the move. The 50 DMA is at 24675.00, with the descending trend line resistance at 24876.00 and a target of 25560.00, followed by the old high at 26700.00.
Support at the 200 DMA at 23617.00 would need to be taken out to target the lows at 23333.50 and 23108.90. Intermediate support is found at 23246.40, with 22800.00 below, and 22212.30 as important support and resistance from September.
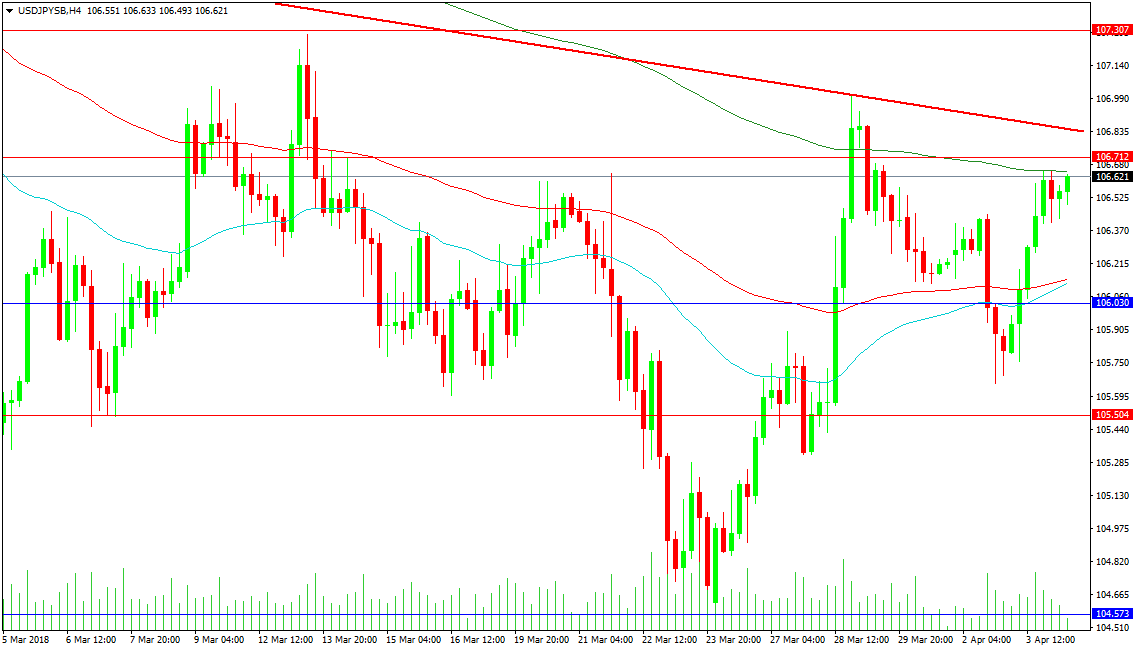
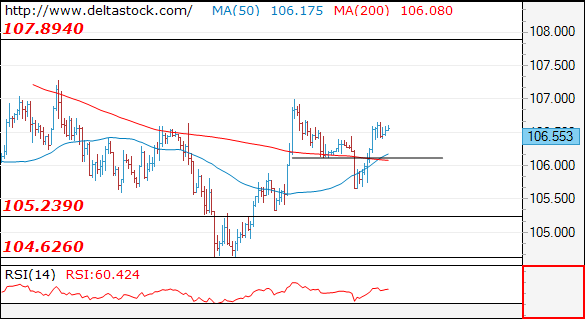
The USDJPY pair has rebounded from support at 104.573 and moved back above 106.000. There are strong signs that a bottom is being formed here. This would be confirmed with a strong break above the red trend line at 106.850. On a break of this level, short positions could become squeezed, with resistance at 107.307 and 107.917 coming into play. Above 108.000 there is strong resistance around 108.750. For now, the 200-period MA is acting as resistance at 106.648 and this can become supportive if breached.
Support at the combined 50 and 100-period MAs is located at 106.140. This is above support at 106.030. The low of 106.654 remains supportive, with 105.504 below. The 105.000 level is important psychologically, with the low from the 23rd of March creating a base. A drop below this level could be a precursor for a test of 100.000, as the price is currently building energy for a move in some direction.
Eurozone CPI accelerated to 1.4%, Unemployment rate dropped to decade low, EUR/GBP recovers
Eurozone CPI accelerated to 1.4% yoy in March, up from 1.1%, and met expectation. Core CPI, however, was unchanged at 1.1% yoy, missing expectation of 1.1% yoy. Unemployment rate dropped to 8.5% in February, met expectation, and hit the lowest level since 2008.
UK PMI construction, however, dropped to 47 in March, down from 51.4, much worse than expectation of 51.0. Markit noted construction activity fell amid unusually bad weather in March.
EUR/GBP recovers notably after the releases. But after all, it's staying in range of 0.8666 and 0.8796. Thus, intraday bias stays neutral, meaning that range trading strategies are more suitable for now, until a breakout.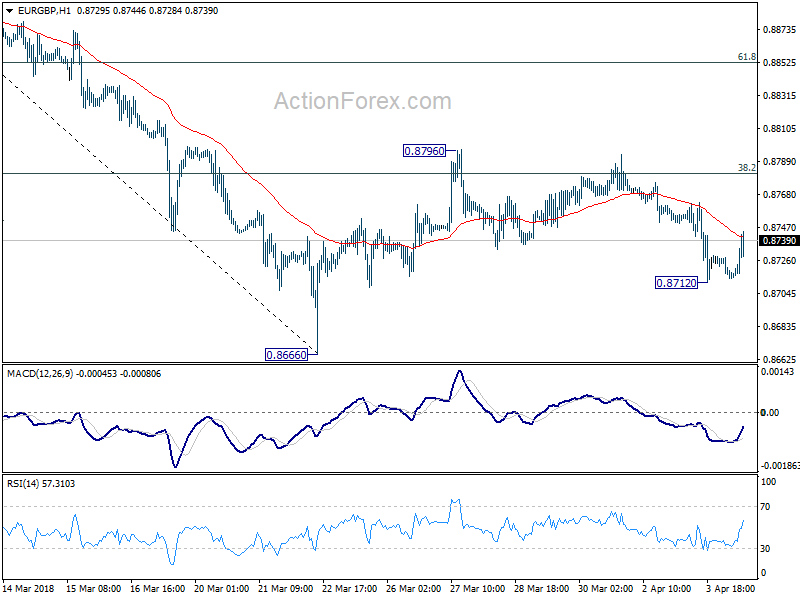
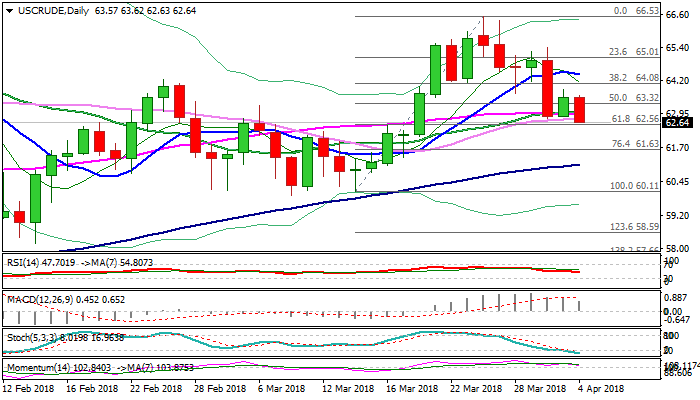
WTI OIL – Sharp Fall Neutralizes Positive Impact From Surprise Crude Stocks Fall, EIA Data Eyed
Oil price fell on Wednesday to new two-week low on strong acceleration after announcement on China tariffs.
Fresh weakness fully retraced Tuesday’s recovery after oil price peaked at $63.84, boosted by surprise drop of oil stocks (API report showed 3.2 million barrels draw in crude inventories against forecasted build of 1.7 million barrels).
Oil price maintains negative sentiment, boosted by increasing Russian oil output and holds in a downtrend from $66.53 (26 Mar peak).
Fresh bears broke through 30SMA ($62.80) and pressure pivotal support at $62.56 (Fibo 61.8% of $60.11/$66.53, break of which would generate strong bearish signal.
Focus turns towards EIA crude stocks report, due later today (build of 1.4 million barrels is forecasted), which would provide fresh direction signal.
Res: 62.80, 63.01, 63.62, 63.84
Sup: 62.56, 62.00, 61.63, 61.08
Forex Technical Analysis: EUR/USD, USD/JPY, GBP/USD
EUR/USD
Current level - 1.2268
The break through 1.2280 confirms the negative outlook, for a slide towards 1.2160. Crucial on the upside is 1.2340 peak and a violation of the latter will signal a reversal of the whole slide since 1.2475 high.
| Resistance | Support | ||
| intraday | intraweek | intraday | intraweek |
| 1.2280 | 1.2560 | 1.2240 | 1.2160 |
| 1.2340 | 1.2560 | 1.2160 | 1.2090 |
 USD/JPY
Current level - 106.55
Yesterday's rise through 106.10 and mostly through 106.40 signals a positive bias, for a further rise towards 107.90. Initial intraday static support is projected at 106.10.
| Resistance | Support | ||
| intraday | intraweek | intraday | intraweek |
| 107.00 | 108.30 | 106.10 | 105.20 |
| 107.90 | 110.40 | 105.20 | 104.60 |
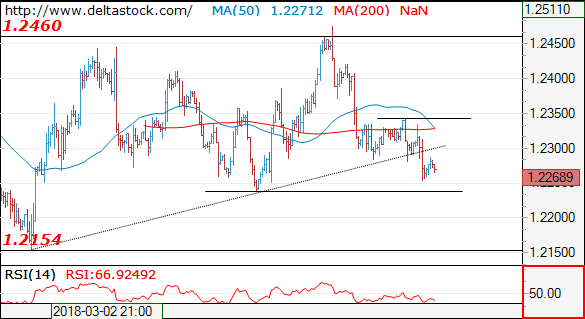
GBP/USD
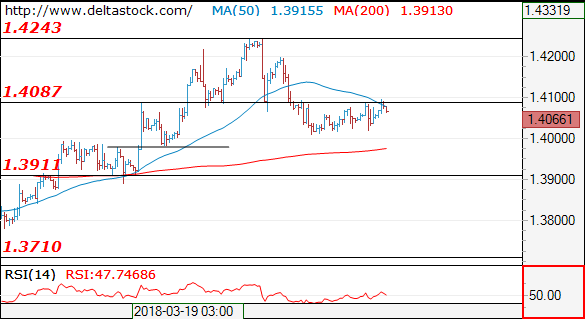
Current level - 1..4066
The overall outlook is still negative below 1.4090, for a slide towards 1.3910 area.
| Resistance | Support | ||
| intraday | intraweek | intraday | intraweek |
| 1.4090 | 1.4280 | 1.4020 | 1.3710 |
| 1.4240 | 1.4340 | 1.3910 | 1.3620 |
Global Markets Consolidate, But Remain Indecisive
Investors are likely to have breathed a sigh of relief after the US stock markets’ worst start to the second quarter since the 1929 Great Depression failed to encourage a widespread selloff across the global markets, as traders returned to their desks after the annual Easter holidays.
While we are still encountering quite a subdued trading atmosphere, where major stock markets are in general struggling to find their direction, we are not facing the type of selling pressure that should worry people that there is some serious distress in the equity markets. It does remain difficult to pinpoint whether trade war concerns, or the recent selloff in stocks like Amazon, are driving the market volatility but there is some room to side with the latter. Another tweet from President Trump reinforcing his negative view on Amazon sent the US stock markets on another volatile ride overnight. It does not appear that trade tensions between the US and China are driving the price action this week.
The general consensus is that a trade war will be of no benefit to anyone, which indicates why investors are not reacting that sensitively to the ongoing headlines between Beijing and Washington. Beijing has, as you would expect, condemned the news that the United States published a list of over 1000 Chinese products that it plans to hit with a 25% tariff, but it has not created much of a reaction in the financial markets as it stands.
There has been just as muted of a reaction in the currency markets, where it can be said that many currencies are not reacting as heavily to the ongoing shifts in sentiment for the equity markets as you would usually expect in a period of higher volatility. This can be seen as another reason to suggest that trade war concerns are not driving the direction of the markets, and that it is the selloff in corporations like Amazon that is behind the erratic behaviour in stock markets. If investors were significantly concerned that there was a risk of a trade war, currencies like the Japanese Yen and the Swiss Franc would be performing much stronger than they have over recent trading sessions. Emerging market currencies like the Malaysian Ringgit, Thai Baht, Indonesian Rupiah and even the Chinese Yuan itself are, on the other hand, outperforming what you would expect if there were fears that a trade war is upon us.
GBPUSD attempting 4 days of consecutive gains
The British Pound appears to be attempting its fourth day of gains against the US Dollar during early Wednesday trading, with the Sterling receiving support after the UK manufacturing survey for March exceeded expectations yesterday. As long as the GBPUSD maintains its ground above 1.40, there is potential for the Pound to trade higher this month. We have noticed in recent weeks that investors are potentially using the 1.40 level in the GBPUSD as a possible pivot level, before deciding what direction the Pound could trade next; therefore, I will continue to monitor the 1.40 level in this pair.
If the GBPUSD manages to slip back below 1.40, it would put the Cable at risk to concluding its current run of gains.
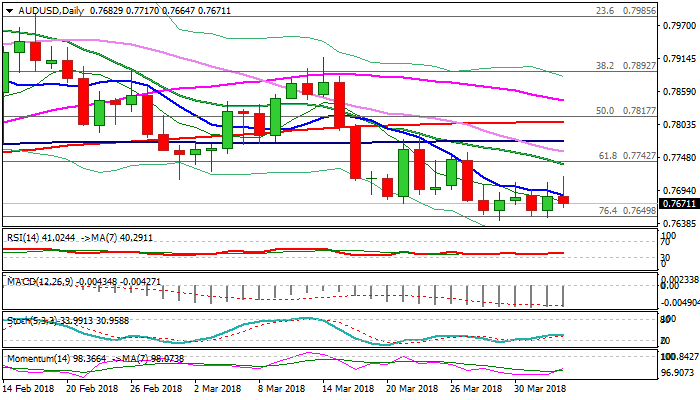
AUDUSD Erases Overnight’s Gains On Risk Aversion After China Tariffs Announcement
The Aussie dollar fell sharply to the session low at 0.7664 after China announced new tariffs on US good, sparking strong risk aversion in the markets.
Fresh weakness erased gains on upbeat Australian retail sales, when the pair spiked to one-week high at 0.7717, but gains were short-lived.
The price returned below 10SMA which capped the action in past five days and is back to week-long congestion after failure to break higher.
News further weakened the sentiment, with immediate risk turning lower again as daily techs are in full bearish setup.
Repeated close below 10 SMA would maintain bearish pressure and keep key n/t support at 0.7642 (29 Mar low) exposed.
Break here (also near Fibo 76.4% of 0.7500/0.8135 rally and weekly 100SMA) would open way towards key med-term support at 0.7500 (11 Dec low).
Res: 0.7685, 0.7717, 0.7738, 0.7759
Sup: 0.7664, 0.7642, 0.7631, 0.7600
USD/CHF Consolidates Gains
USD/CHF better bid despite escalating trade war
During the Asian session, the US dollar lost some ground against the Swissie with USD/CHF easing to 0.9576, down from yesterday high of 0.9597. However, it looks more like a consolidation, reflecting investors' caution in uncertain investment condition, namely the escalating trade war between China and the USA. Nevertheless, the situation didn't prevent traders to build long USD/CHF positions as the currency pair increased more than 4.40% since mid-February, rising from 0.9188 to 0.9597.
The pair is on the cusp of testing the 200dma resistance level that currently stands at 0.9658. Given the positive development in the option market, together with the increase in short CHF positioning, there is a good chance that resistance would be broken to the upside. The 25-delta risk reversal measure has been continuously improving across all maturities since mid-February. The 1-month gauge rose from -1.18% to -0.62% yesterday, while the 6-month one jumped from -1.36% to -1.03%. The latest CFTC speculative positioning data puts CHF net short positioning at 21% (of open interest), compared to 10% the previous week.
Finally, the escalating tensions between China and the USA did not triggered a rush towards safe haven assets, which suggests that investors are confident that the world largest economic would be able to bear the economic choc. USD/CHF is currently trading at 0.9588 and the momentum firmly positive.
Germans bought less in February
Yesterday's February retail sales disappointed, coming in negative at -0.70% instead of an expected slight gain. Private consumption has declined for three months in a row, and this is the key contributor to economic growth. Nonetheless, consumer confidence is firm, unemployment is at historic lows (5.30%) and wage growth accelerated 4.3% in Q4 2017. So we remain confident that private consumption will recover and that retail sales data must be taken with a grain of salt.
The euro continues to appreciate against the USD, currently at 1.2265 and expected to head toward 1.2254 short-term. There's been an increase of US non-commercial long EUR futures, equivalent to 141'064 or 60% of total long open interest contracts, so expect to see continued pressure on the greenback.
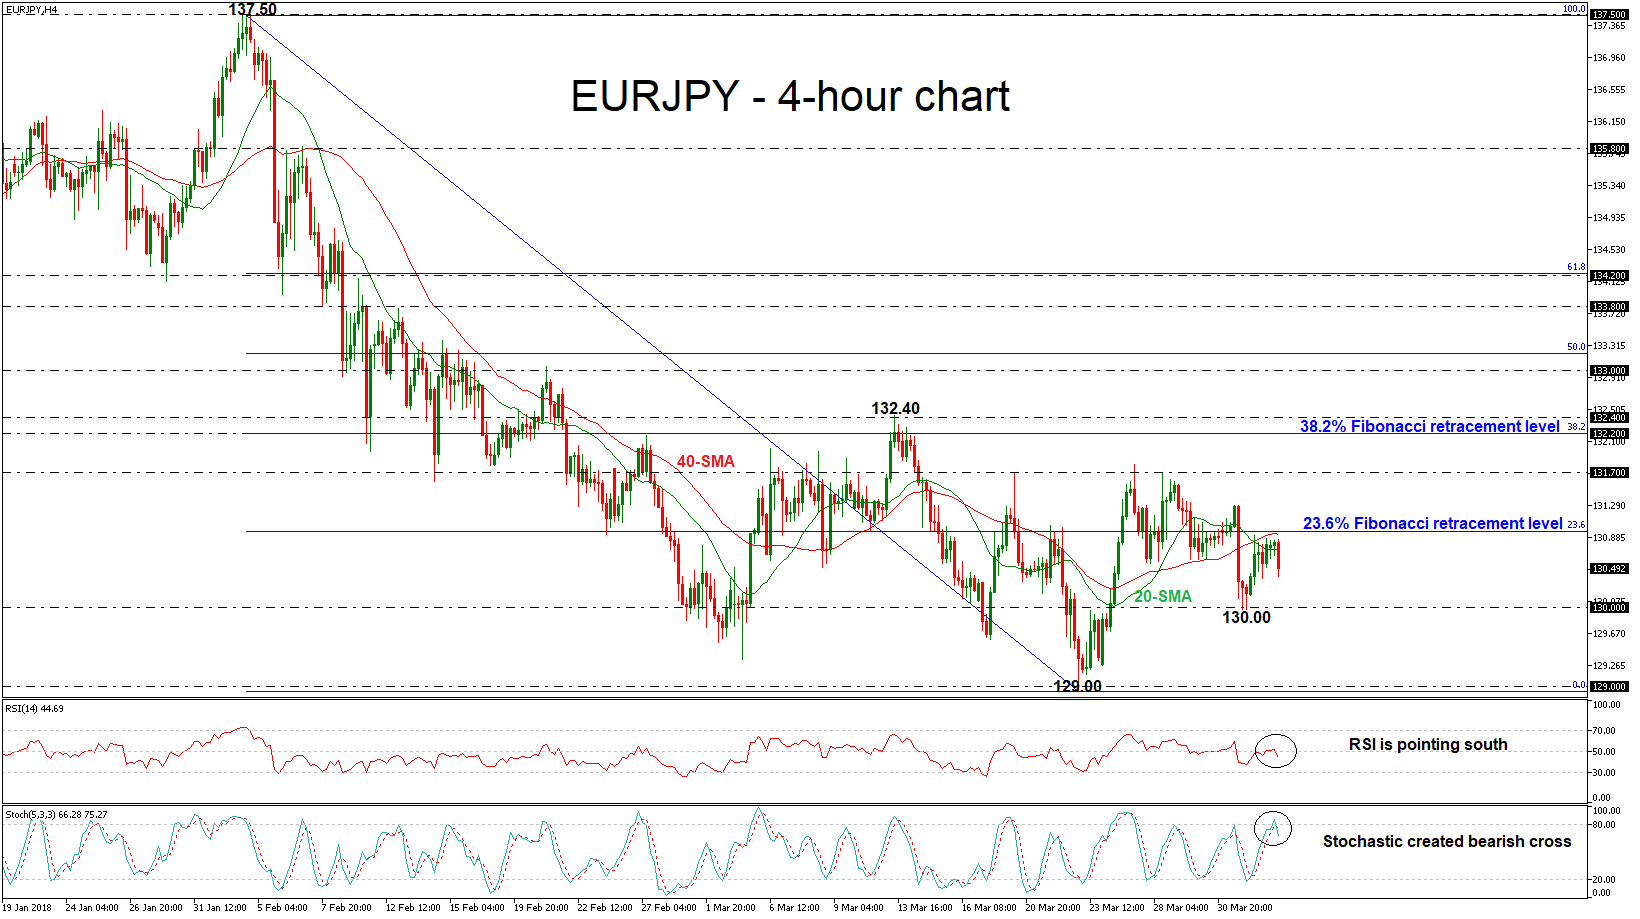
EURJPY Maintains Weak Bias In Near Term, Broader Trend Is Bearish
EURJPY remains under pressure in the medium-term and risk is still to the downside as prices continue to drift lower from the 137.50 strong resistance level. Over the last two months, the price has no clear tendency as it is trading within a range, bound by the 129.00 and 132.40 levels. The short-term technical indicators are bearish and point to more weakness in the market.
Looking at the 4-hour chart, the pair is looking capped by the 20- and 40-simple moving averages (SMAs) which are negatively aligned. The RSI indicator is pointing south and slipped below the threshold of 50, while the %K line of the stochastic oscillator created a bearish cross with the %D line near the overbought zone, suggesting further losses.
If prices remain below the two SMAs, there is scope to test the 130.00 key psychological level. Clearing this barrier would see additional declines towards the 129.00 handle. This is considered to be a strong obstacle which has been rejected a few times in the past.
An alternative scenario is a climb above the 23.6% Fibonacci retracement level near 131.00 of the downleg from 137.50 to 129.00. Then the focus would shift to the upside towards the 131.70 resistance level. If this level breached, the next barrier to watch is the 38.2% Fibonacci of 132.20.
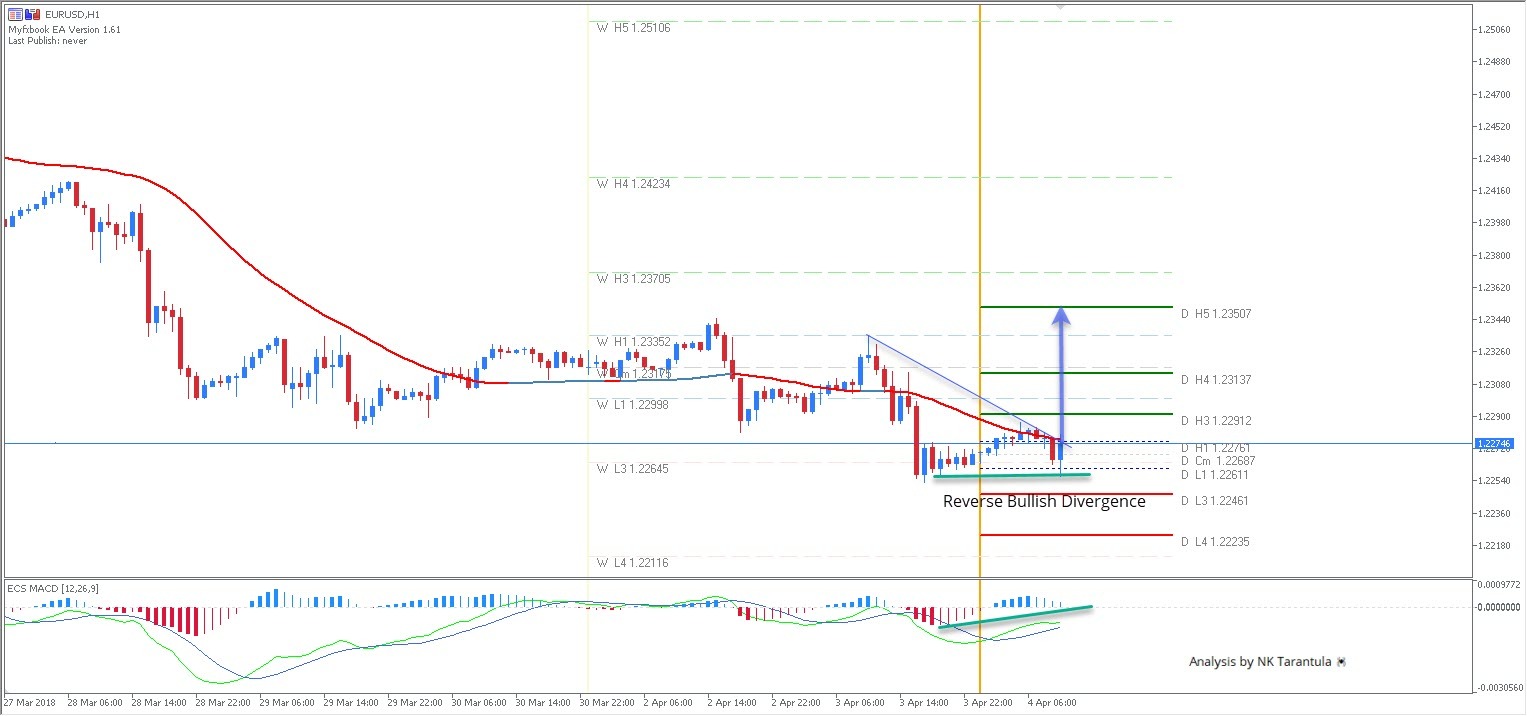
EUR/USD Reverse Bullish Divergence At W L3 Pivot
The EUR/USD has formed a reverse bullish divergence exactly at W L3 Pivot point. Reverse or exaggerated bullish divergence is the type 3 divergence. The price is double bottom-ish while the oscillator makes a higher low. The EUR/USD price might bounce from 1.2255-65 and go straight up. If the 1h candle closes above the blue trend line and above EMA89 we might see 1.2291, 1.2213 and 1.2350. Ideally for bullish scenario to work out, the EUR/USD should be kept above W L3
W L3 - Weekly Camarilla Pivot (Weekly Interim Support)
W H3 - Weekly Camarilla Pivot (Weekly Interim Resistance)
W H4 - Weekly Camarilla Pivot (Strong Weekly Resistance)
D H4 - Daily Camarilla Pivot (Very Strong Daily Resistance)
D L3 – Daily Camarilla Pivot (Daily Support)
D L4 – Daily H4 Camarilla (Very Strong Daily Support)
POC - Point Of Confluence (The zone where we expect price to react aka entry zone)