Sample Category Title
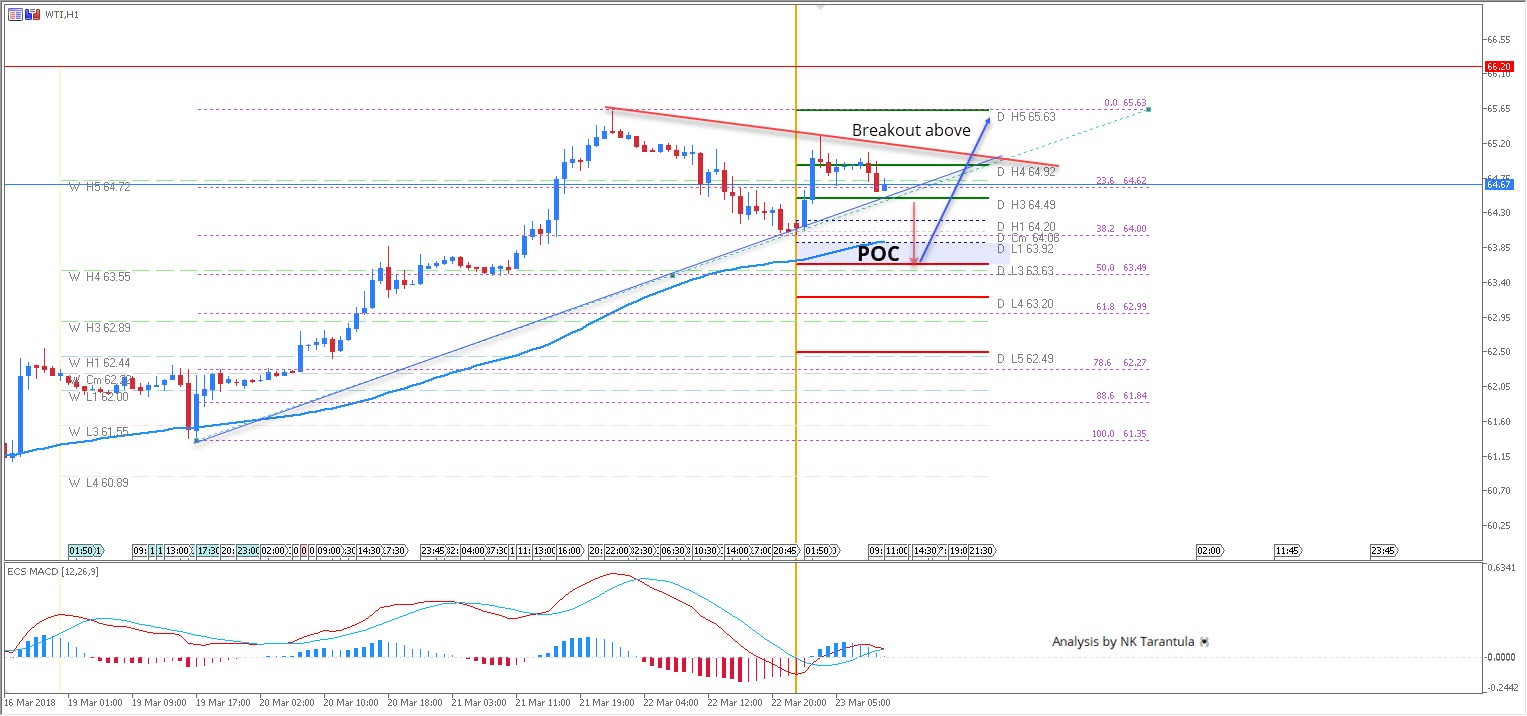
WTI Bullish Zig-Zag Is Progressive
The WTI is still in a strong uptrend. The price behaved exactly as planned as you could have read in my previous WTI analysis. Today it’s Friday and we might see some profit taking. Pay attention to a blue trend line break for a retracement down to POC. The POC 65.85-90 could provide a bounce to price towards red trend line – 65.00. However if we don’t see any retracement to the POC, we need to pay attention to a possible breakout above red trend line or 4 close above 65.00. In that case the WTI could spike to 65.63. The price has already reached the W H5 (strongest weekly resistance), so it needs a lot of momentum to proceed towards 65.63 and above.
W H3 - Weekly Camarilla Pivot (Weekly Interim Resistance)
W H4 - Weekly Camarilla Pivot (Strong Weekly Resistance)
D H4 - Daily Camarilla Pivot (Very Strong Daily Resistance)
D L3 – Daily Camarilla Pivot (Daily Support)
D L4 – Daily H4 Camarilla (Very Strong Daily Support)
POC - Point Of Confluence (The zone where we expect price to react aka entry zone)
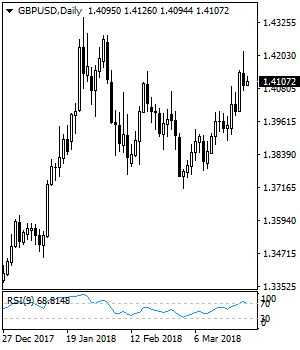
GBPUSD – Remains Vulnerable Below Key Resistance
GBPUSD - The pair turned lower on Thursday after failing to hold on to its intra day gain. It faces the risk of more weakness. Support lies at the 1.4050 level where a break will turn attention to the 1.4000 level. Further down, support lies at the 1.3950 level. Below here will set the stage for more weakness towards the 1.3900 level. Conversely, resistance stands at the 1.4150 levels with a turn above here allowing more strength to build up towards the 1.4200 level. Further out, resistance resides at the 1.4250 level followed by the 1.4300 level. On the whole, GBPUSD looks to follow through lower.
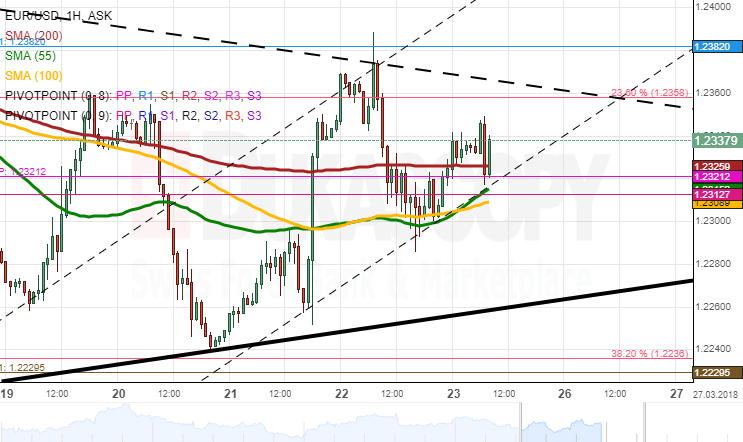
EUR/USD Analysis: Regains Positions On Friday Morning
After reaching this week's high of 1.2380 early on Thursday, EUR/JPY started a new decline. This fall was caused by disappointing Markit PMI data for the Euro zone and Germany. As a result, the pair dashed through the 200-hour SMA and the weekly PP.
Some bullish pressure was introduced late in the evening when the US Dollar weakened in response to new tariffs on China imposed by the Trump administration. The Euro found support at the 55– and 100-hour SMAs circa 1.23 and was trading near 1.2335 at the time of this analysis.
From technical point of view, the pair should push for the trend-line and the 23.60% Fibo at 1.2360. It is likely that the pair remains stranded between this line and the SMAs prior to US fundamentals.
The general tendency is likely to remain upwards closer to 1.24.
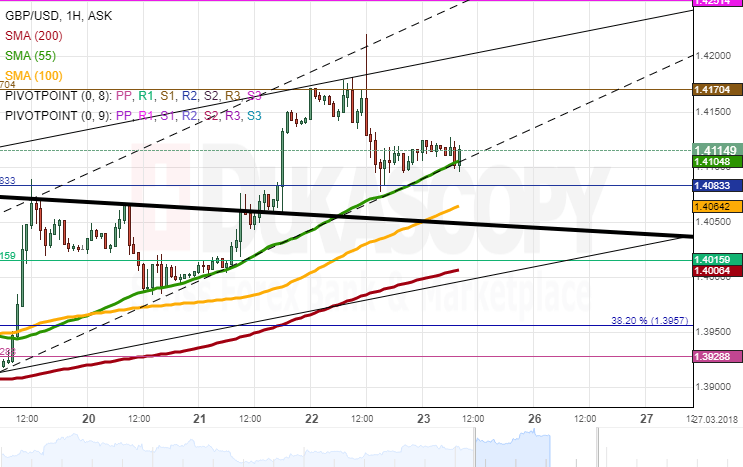
GBP/USD Analysis: Consolidates Above 55-Hour SMA
The Sterling was trading at its seven-week high of 1.4170 on Thursday morning, as the strong resistance of the weekly R3 did not allow it to push above this mark for several hours.
High volatility was introduced at 1200GMT when the BOE published its Monetary Policy Summary. Even though its benchmark rate was kept steady in line with expectations, the surprise element was introduced by MPC Official Bank Rate votes. The impact was the rate's fluctuation in a 92-pip range after the release. The subsequent price decline was stopped by the 55-hour SMA which has guided the pair ever since.
The pair consolidating slightly above this line suggests that some downward momentum until 1.4050 could occur. Technical indicators, on the other hand, are bullish and favour a climb towards the 1.4170 area.
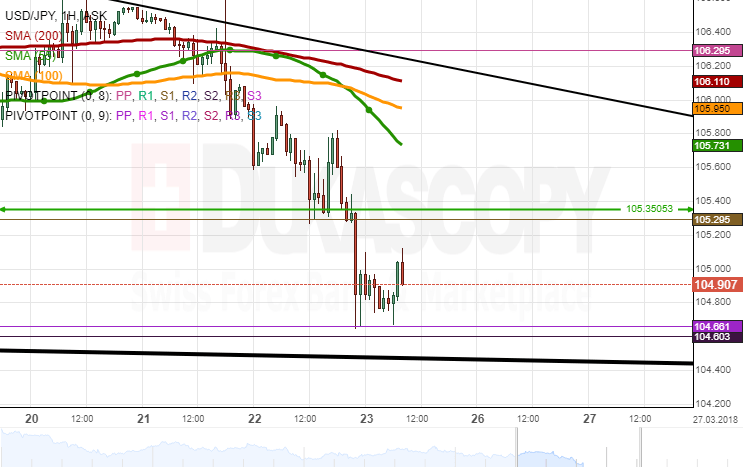
USD/JPY Analysis: Plunges To New Yearly Low
The US Dollar continued to trade lower against the Yen for the second consecutive session. This bearish momentum was rather steady during the most session on Thursday, as bears were reluctant to push the rate below its 2017/2018 low and the weekly S1 at 105.30.
Strong downside risks were introduced late in the evening when the US Dollar weakened substantially in response to Trump announcing tariffs on Chinese imports.
The Asian session marked a slight consolidation above the weekly S2, the monthly S1 and the bottom boundary of a four-month channel circa 104.50. It is expected that this cluster supports the rate and pushes the Greenback higher. The pair could hinder at 105.30, but eventually continue even higher to cap gains near the 106.30 area
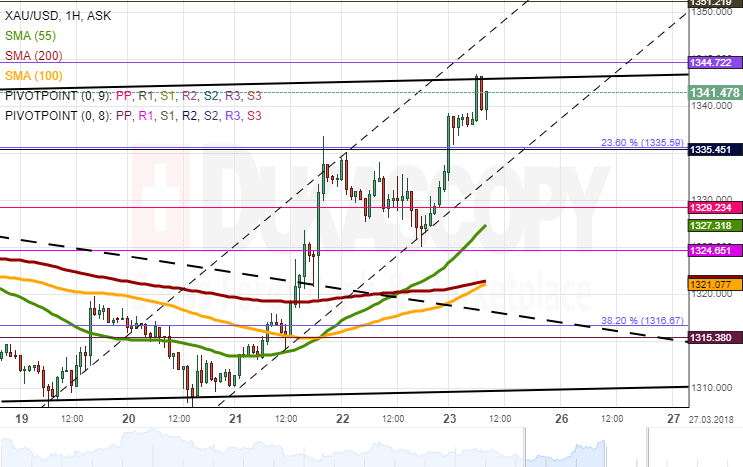
Gold Analysis: Pushes Towards 1,345.00
Gold was moving south during the first part of Thursday's trading session. It was fluctuating around the 1,330.00 mark which had previously provided a strong resistance level.
The yellow metal gained late in the evening when the Trump administration announced tariffs on Chinese imports. This resulted in a massive sell-off of the US Dollar. As a result, the pair was able to reach the 1,350.00 area by Friday morning.
A short-term ascending channel shows that the pair might still appreciate towards 1,350.00 prior to forming a minor correction south. This scenario, however, could occur even earlier, given that the pair is overbought. A possible fall should not exceed the 1,320.00 mark.
Meanwhile, the general tendency still remains upwards towards the senior channel located near 1,355.00.
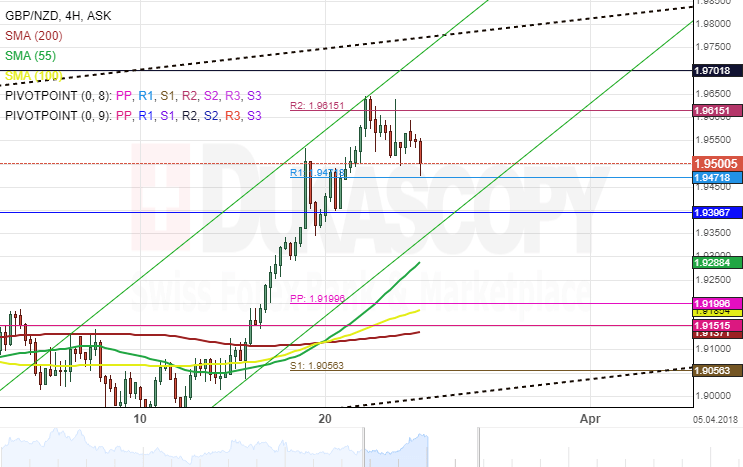
GBP/NZD 4H Chart: Stranded Between PPs
The Pound Sterling has increased its gains against the New Zealand Dollar. The exchange rate remained trading in several ascending channels and has tested the upper boundary of a junior channel.
The currency exchange was stranded between pivot points. The weekly R2 was providing resistance while the monthly R1 was providing support for the exchange rate.
As for near future, analysts project that the GBP/NZD currency pair is likely to continue bullish until it breaches the upper boundary of the junior channel. If or it occurs, the price movement could encounter a resistance set by the monthly PP at 1.9701.
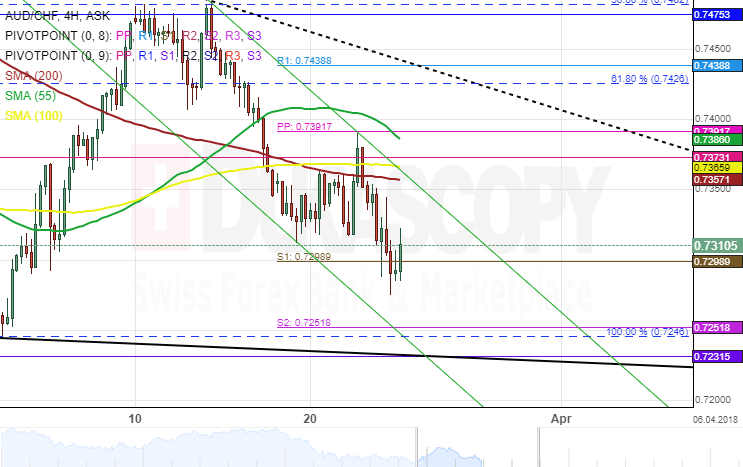
AUD/CHF 4H Chart: Likely Breakout
The Australian Dollar has prolonged its downturn against other major currencies during the past week. Though, the decline can be seen notably in the AUD/CHF chart.
In the four-hour time frame, the AUD/CHF exchange rate breached the 50.00% Fibonacci retracement level and return to the opposite direction. This retracement can be measured by connecting the March low at 0.7248 and the January high at 0.7718.
In the meantime, the currency pair is likely to remain bearish during the following trading session until it breaches the lower boundary of a junior descending channel where the monthly S2 is also located.
Stocks Plunge, Yen Rallies As Trade War Saga Gets New Chapter
Here are the latest developments in global markets:
FOREX: The yen was building on yesterday's gains versus other major currencies on Friday, as rising fears of a global trade war acted as a catalyst for the currency to attract safe-haven flows. Versus the dollar, the Japanese currency recorded a 16-month high of 104.62.
STOCKS: Equity indices were a sea of red in every region, as the new US tariffs aimed at China reignited concerns that the situation could escalate into a full-blown trade war between the world's two largest economies. In the US, the Dow Jones led the charge lower yesterday, shedding 2.9% of its value, while the S&P and the Nasdaq Composite plunged by 2.5% and 2.4% respectively. Futures tracking the Dow, S&P, and Nasdaq 100 are all flashing red currently. The carnage was even worse in Asia. In Japan, the Nikkei 225 and the Topix collapsed by 4.5% and 3.6% correspondingly, as the gains in the yen clouded even further the outlook for Japanese exporting firms. In Hong Kong, the Hang Seng tumbled by 2.8% while in China, the CSI 300 dropped by almost 2.9%. Risk aversion looks set to roll into European trading as well, with futures tracking all the major benchmarks being well-into negative territory, signaling a much lower open today.
COMMODITIES: Oil prices surged even despite the broader decline in equity markets. WTI and Brent crude are trading higher by 1.0% and 0.9% respectively. The catalyst for the gains may have been remarks by the Saudi Energy Minister Khalid al-Falih, who noted his country's willingness to continue coordinating with Russia and other producers in 2019 to rebalance the oil market. Today, attention will fall on the Baker Hughes oil rig count, for an update on the state of US production. In precious metals, gold prices gained 1.0% as risk aversion refueled demand for the safe haven asset. The yellow metal reached a four-week high earlier on Friday, and is currently trading fractionally below the $1340/ounce resistance zone. An intensification in trade risks could see gold extend its gains, and in case of further advances, resistance may be encountered initially at $1350, and subsequently near its recent highs at $1366.
Major movers: Yen on the rise on the back of trade fears
The yen's perceived safe-haven status allowed it to advance versus other major currencies in an environment of rising trade tensions. At 0730 GMT, dollar/yen was 0.35% down at 104.89, having earlier touched 104.62, its lowest since November 2016. Euro/yen and pound/yen also traded lower, with the former recording a seven-month low of 128.94 at its lowest, though it later pared a considerable part of its earlier losses. Elsewhere and yen-related, Japanese core inflation came in at 1.0% y/y in February as expected. This compares to January's 0.9% and the Bank of Japan's target of 2%.
US President Donald Trump signed a presidential memorandum on Thursday targeting tens of billions of dollars of Chinese products with tariffs, though this wouldn't go into effect right away. Market participants fret a trade war between China and the US, the world's two largest economies, and expressed their fears by boosting the yen and selling off risk-on assets such as equities. Another safe-haven perceived currency rising versus the dollar is the Swiss franc.
A Chinese response to US tariffs on steel and aluminum products came on Friday, with the country's commerce ministry saying it was planning measures against up to $3 billion of imports from the US. Should the two countries engage in tit-for-tat retaliatory practices then the equity rout is likely to continue. Meanwhile, Cui Tiankai, the Chinese Ambassador to the United States said “We will retaliate” in a video posted on the embassy's Facebook page.
Adding to the unstable environment, Trump replaced H.R. McMaster as national security adviser with John Bolton, a known hawk who has in the past supported using military force against North Korea and Iran.
Euro/dollar and pound/dollar were up by 0.3% and by around 0.2%, at 1.2337 and 1.4112 respectively. The Bank of England yesterday completed its meeting on monetary policy keeping rates unchanged, though it was seen as coming closer to delivering a 25bps rate hike in May. As a result, sterling gained versus the dollar and the euro, hitting a one-and-a-half-month high of 1.4216 versus the former before eventually retreating to finish the day lower, and rising to its highest since June last year versus the latter, though it also wasn't able to sustain gains.
The aussie and the kiwi were up versus their US counterpart, though they were also losing ground versus the yen, falling to near one-and-a-half-year lows. Australia and New Zealand heavily rely on commodity exports and stand to lose substantially should a global trade war emerge.
Finally, it is notable that the Turkish lira took a beating as Japanese retail investors unwound investments in higher-yielding currencies such as the aforementioned. Apart from losing ground versus the yen, the lira also retreated versus other currencies such as the greenback, with dollar/lira at one point rising to a record high of 4.0346. The pair later gave up part of its gains, but it was still up by 1.0% at 3.9710 at the time of writing.
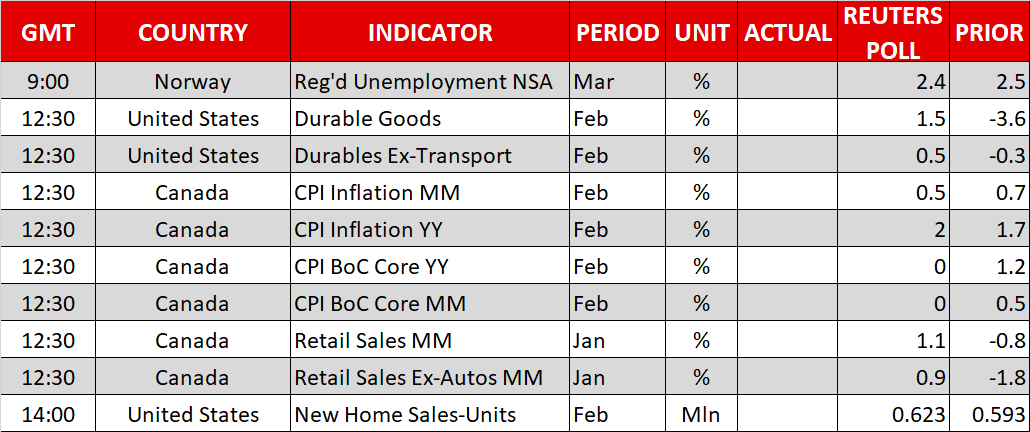
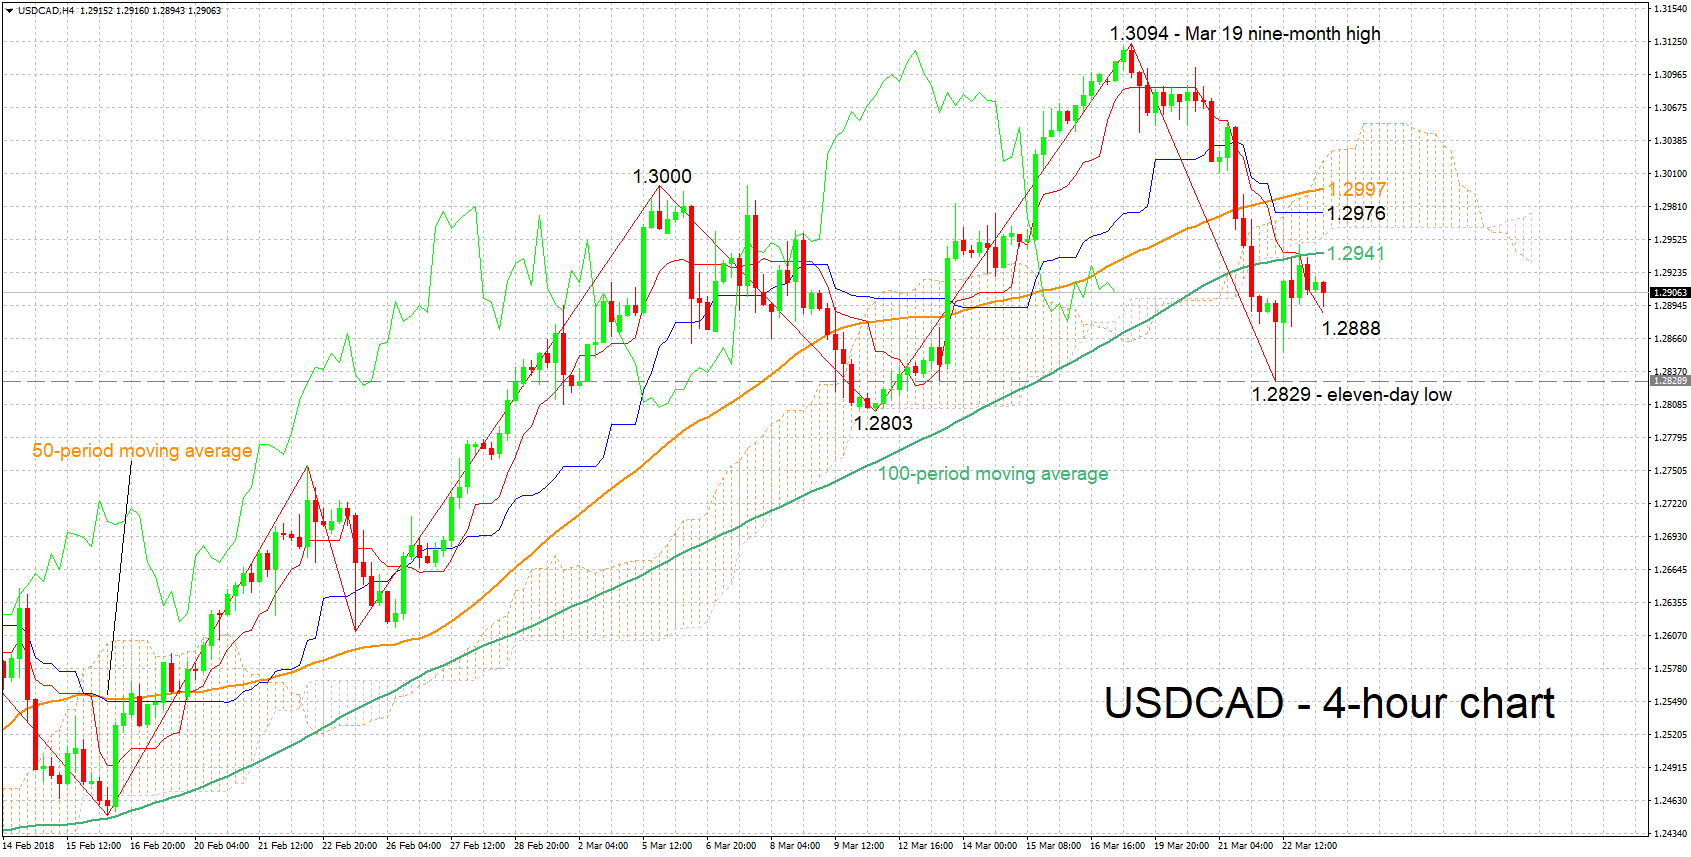
Technical Analysis: USDCAD negative momentum losing steam
USDCAD has lost some ground after reaching a nine-month high of 1.3094 on March 19. The Tenkan- and Kijun-sen lines are negatively aligned in support of a negative bias, though the fact that the Kijun-sen has flatlined hints to a negative momentum that has lost steam.
Upbeat CPI and retails sales numbers out of Canada later today could boost the loonie, pushing USDCAD lower and thus refueling the bearish short-term momentum. Support to declines might come around the current level of the Tenkan-sen at 1.2888 – this was a congested area earlier in March – with a violation turning the focus to the range around Thursday's 11-day low of 1.2829 for additional support.
Disappointing data on the other hand are likely to lead to gains in USDCAD. The area between 1.2941 and 1.3022, encapsulating the 100-period moving average on the lower bound and the Ichimoku cloud top on the upper bound, while encapsulating the Ichimoku cloud bottom (1.2955), Kijun-sen (1.2976), and the 50-period MA (1.2997) as well, could be of importance, acting a barrier to price advancing.
Developments on the trade front also have the capacity to move the pair.
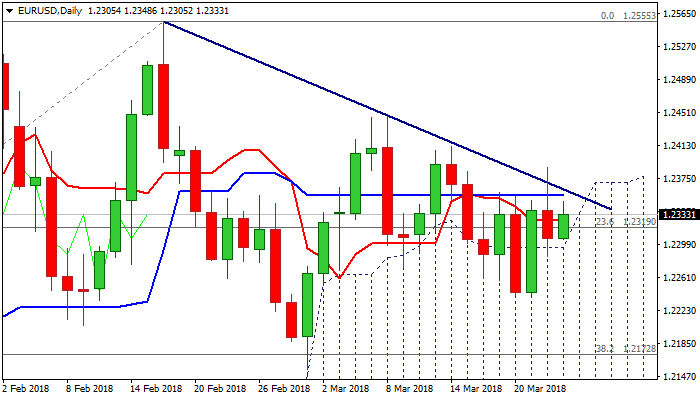
Technical Outlook: EURUSD Holds In Narrowing Range Between Daily Cloud Top And Bear-Trendline
The Euro is holding above strong 1.23 zone supports (rising 55SMA / daily cloud top) in early Friday’s trading, following strong upside rejection on probe above trendline resistance (currently at 1.2355).
The price may hold in extended narrow consolidation between pivots provided by 55SMA and trendline resistance, as techs on daily chart are in neutral setup.
Firmer direction signals could be expected on sustained break of either side. Close above the trendline would be bullish signal for extension towards targets at 1.2412 (14 Mar high) and 1.2446 (08 Mar high), while firm break below 55SMA would expose double-bottom at 1.2240, which marks strong support, break of which would spark stronger bearish acceleration and expose daily cloud base at 1.2136.
Res: 1.2355. 1.2388. 1.2412. 1.2446
Sup: 1.2300. 1.2240, 1.2172. 1.2136