Sample Category Title
Moderate Chinese Retaliation – But Keeping The Powder Dry
Key points
- The Trump administration yesterday announced that it plans to impose tariffs on USD60bn of imports from China.
- China plans retaliatory measures - but the first round is only muted. China is keeping its powder dry, awaiting specific measures from Trump.
- The US trade actions put at risk 75 years of global trade integration.
- This has been promoted by a significant reduction in emerging market tariffs, including by China, to levels close to US and European ones.
- Hence, average tariff rates in China, the EU and US are now roughly the same.
Trump announces new trade measures against China
The Trump administration yesterday announced plans to impose tariffs on up to USD60bn of imports from China. The tariffs will target the ten focus sectors for China identified in the Chinese authorities’ strategy ‘Made in China 2025’ (see table below). The White House has given the US Trade Representative 15 days to identify specific goods that will be subject to tariffs. Following this period, there will be a 30-day period for public comment. Hence, the formal implementation of the tariffs will most likely be in 45 days. Furthermore, President Trump has instructed the US Treasury to come up with a plan to impose new restrictions on Chinese investment in areas such as those below within 60 days. The new measures are designed to penalise China for trade practices that the Trump administration says involve stealing American companies' intellectual property.
Overnight, China responded strong verbally but soft in actual retaliatory measures. The Chinese Ambassador to the US Cui Tiankai said, ‘If somebody imposes a trade war on us, we’ll fight to the end’. China also outlined plans to put tariffs on 128 products accounting for USD3bn in imports including a 15% tariff on US steel pipes, fresh fruit and wine and a 25% tariff on pork and recycled aluminium. This is a very measured reaction as USD3bn is a drop in the ocean out of the USD131bn the US exports to China every year. Also, the new tariffs do not include soybeans, sorghum and aircrafts, which could hurt Trump more. However, the retaliation was not to the news from Trump yesterday of the tariffs on USD60bn of Chinese goods. Instead, according to the Chinese Commerce Ministry, it is a reaction to the US tariffs on steel and aluminium announced a few weeks ago.
China is thus keeping its powder dry still but is likely to target soybeans and aircrafts in a new round of retaliatory steps when Trump announces his specific measures over the next 15 days. In Research: 10 areas where China could retaliate vs US measures, 15 March 2018, we also point to other areas China could target.
While important on a political level, the direct effect on Chinese or US GDP should not be overestimated. Trump is targeting USD60bn of Chinese goods, which corresponds to 10% of Chinese exports to the US. However, this is only 0.5% of Chinese GDP, which reached USD12trn in 2017.
 Assuming the tariffs were to shave off 25% of the targeted Chinese exports, this would correspond to a reduction of 0.1% of Chinese GDP. If we additionally assume that imported contents in exported goods amount to 50% (for many goods it is higher), we end up at an effect of 0.05% of Chinese GDP. For the US, exports of USD3bn correspond to 0.015% of GDP and the actual effect on growth would be less than 0.1 percentage points.
While the direct effects are small, the risk is that it triggers a tit-for-tat trade war between the US and China. It is not our baseline scenario, as neither the US nor China would benefit from a trade war. But it is a risk that needs to be watched closely. Also, for at least the next couple of weeks the fear of an escalation will continue to hang like a heavy cloud over financial markets and the global economy.
Reversal of global trade integration?
he trade actions taken today and over the past weeks by the Trump administration do put at risk the global trade integration that has taken place since the end of the Second World War. Apart from the already announced trade measures, the US administration is likely to seek re-negotiation of NAFTA. Furthermore, President Trump has denounced the World Trade Organisation as a “catastrophe”. The series of tariff reductions in the context of the General Agreement on Tariffs and Trade (GATT) have helped boost global trade from a mere 17% of global GDP in 1960 to almost 50% of global GDP in 2016. While global trade has come under pressure since the financial crisis (due to a fall in investment and waning global outsourcing according to the IMF), the new trade measures and retaliation by the US trading partners risk hitting global trade even further in years to come.
 The effects of trade liberalisation have especially led to a reduction in emerging market tariffs. The process accelerated when the WTO was created in 1996. This was particularly true for China, which reduced its average tariffs from almost 30% to 15% in a matter of a few years. The entry of China into the WTO in 2001 led to a further reduction in average tariffs to about 5% currently. Also Latin America and the wider East Asia reduced their tariffs in the 1990s and early 2000s. This has narrowed the difference with developed countries such as the US and EU markedly.
 Looking at the (average) tariff rates between the US and the EU/China, it is difficult to see that the US is being unfairly treated on this front. Yes, China has higher tariffs, but only a couple of percentage points. And Europe has lower overall tariffs than the US. Note though that the numbers below are averages, and individual goods may be subject to significantly higher tariffs, while others apply zero rate tariffs.
 How much damage would a global trade war do?
A key question is how much damage the trade restrictions could do to the global economy. In our base case of limited retaliation by China and other US trading partners to the US measures and few additional trade restrictions by the US, the impact on US growth and inflation and more broadly the global economy would be limited (for more discussion, see Research US: Symbolic protectionism with limited impact on growth and inflation but risks remain).
In the case of a more severe global trade war, where the trade restrictions are more pervasive, the impact would of course be more significant. The OECD found in 2016 that the global loss in GDP would be about 1.3% in the case of a full blown global trade war. With regard to the impact on countries, such as the US, China and the EU, which impose the tariffs, the loss to their GDP could be closer to 2%.
The impact of US trade restrictions on the global economy may be less damaging than in the past. First, the US share of global trade has declined significantly over the past 15 years, accounting for just 12% in 2016, down from almost a fifth in 2000. This is explained partly by the growing importance of emerging markets, notably China, which now export two-thirds of their exports to other emerging markets.
Secondly, a trade war would most likely be between the US and the rest of the world. As such, it would probably affect the US economy more than other countries. We think it is unlikely that China, Europe and other regions will not engage in trade wars with each other. Quite the contrary, these regions may seek to strengthen ties in response to a more closed US trade regime. For example, the EU and Mercosur countries have recently restarted their free trade negotiations
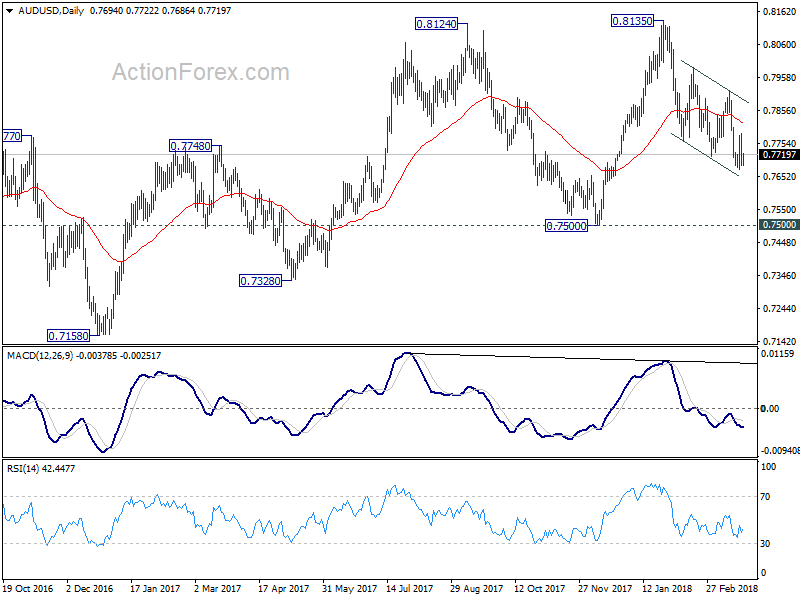
AUD/USD Daily Outlook
Daily Pivots: (S1) 0.7657; (P) 0.7721; (R1) 0.7754; More...
Intraday bias in AUD/USD remains neutral at this point. The pair is staying well inside near term falling channel. And prior recovery was limited well below 0.7915 resistance. Hence, outlook stays bearish and deeper decline is expected. Below 0.76171 will turn bias to the downside and resume whole fall from 0.8135 to 0.7500 key support level.
In the bigger picture, medium term rebound from 0.6826 is seen as a corrective move. It might still extend higher but we'd expect strong resistance from 38.2% retracement of 1.1079 to 0.6826 at 0.8451 to limit upside to bring long term down trend resumption. On the downside, break of 0.7500 support will now be an important signal that such corrective rebound is completed. In that case, AUD/USD would be heading back to 0.6826 low in medium term.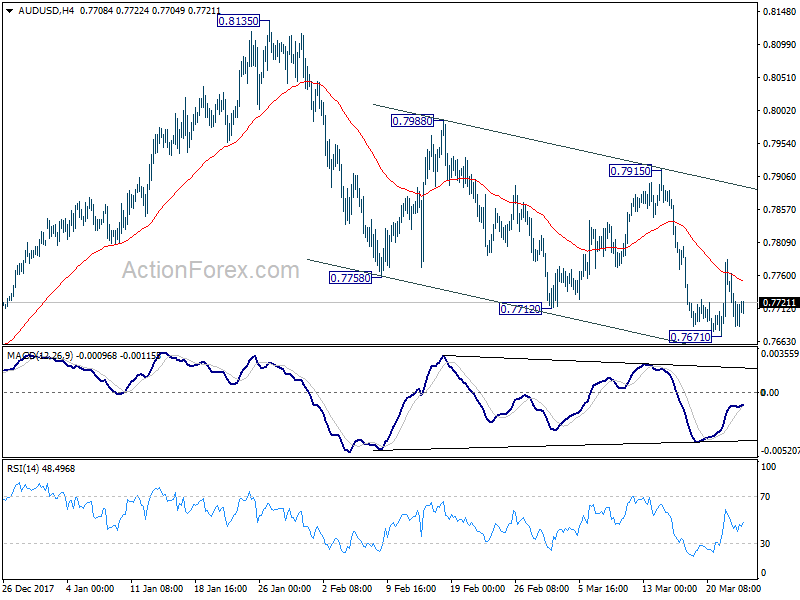
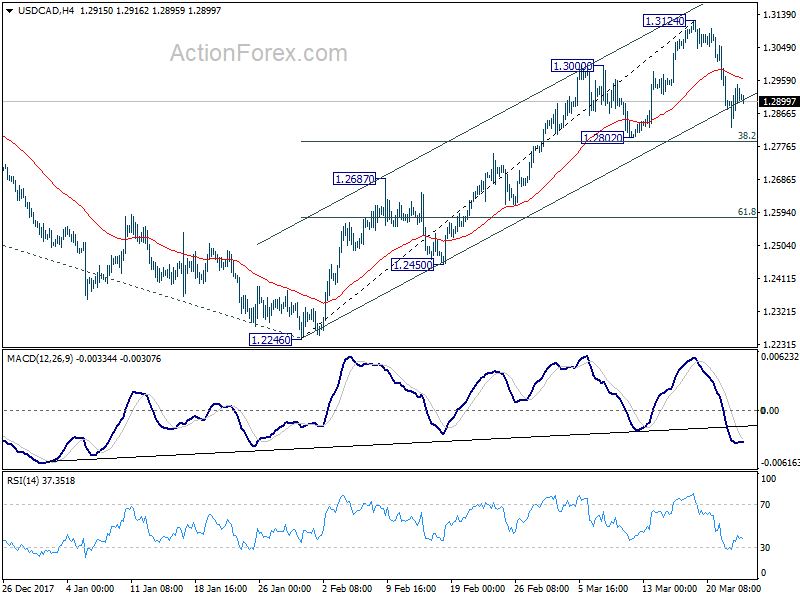
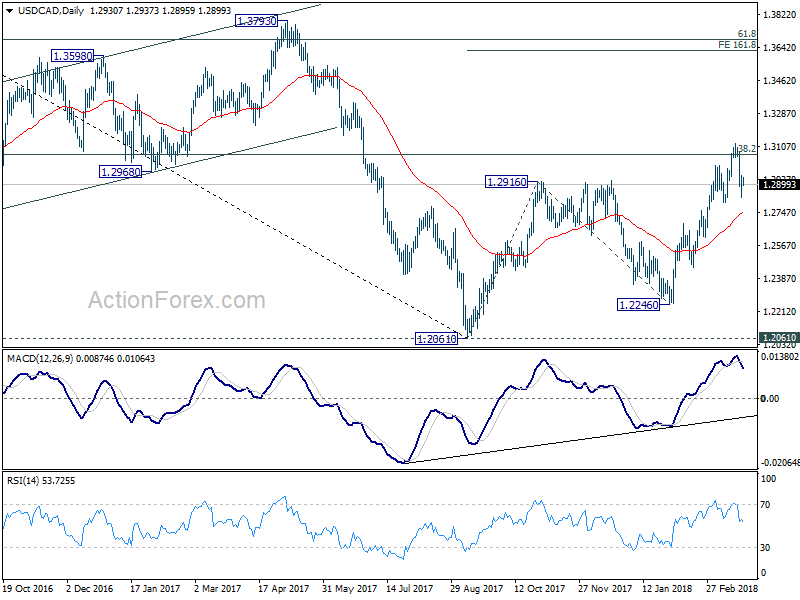
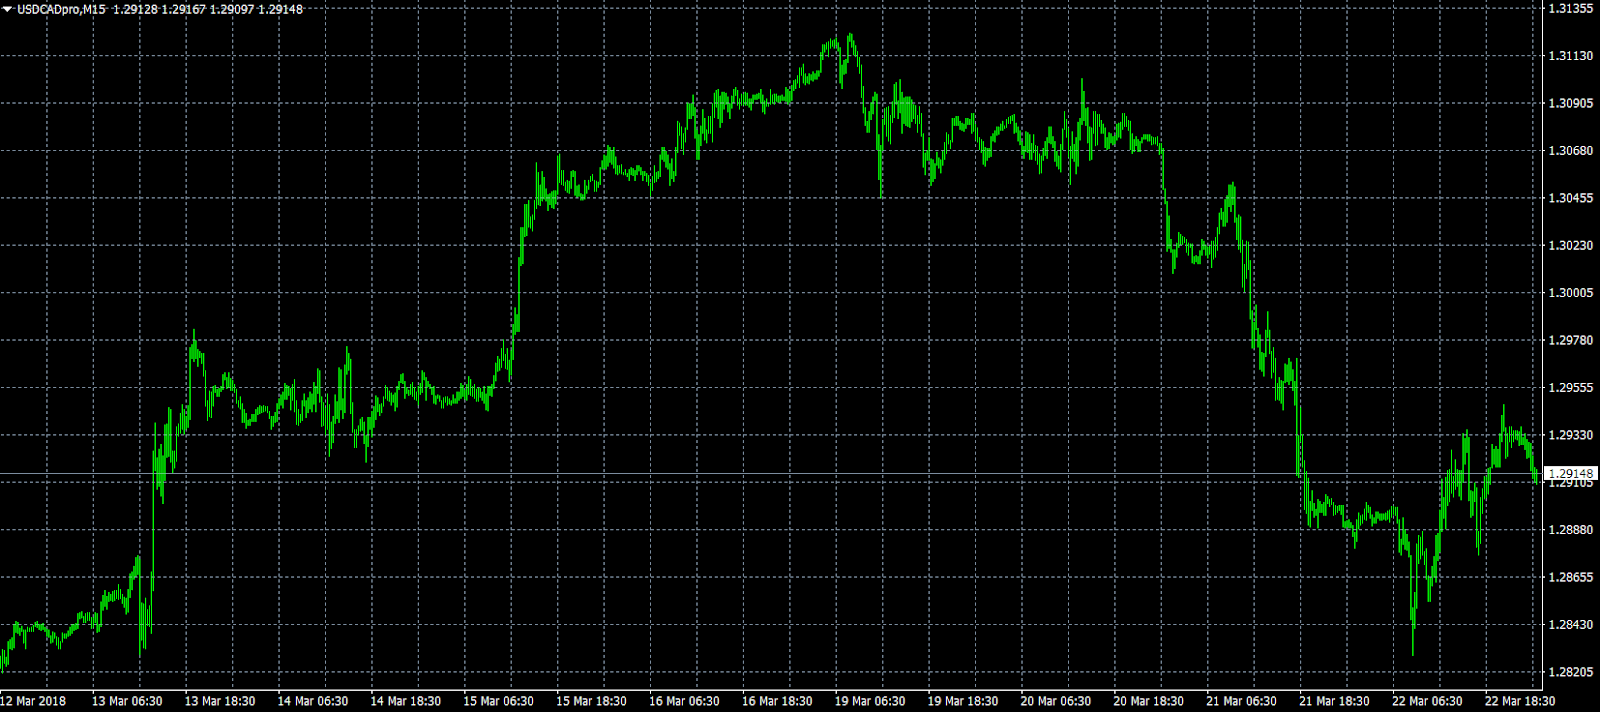
USD/CAD Daily Outlook
Daily Pivots: (S1) 1.2863; (P) 1.2905; (R1) 1.2982; More....
At this point, USD/CAD is holding above 1.2802 cluster support zone (38.2% retracement of 1.2246 to 1.3124 at 1.2789). Intraday bias remains neutral and bullish outlook is unchanged. That is, further rally is expected. On the upside, break of 1.3124 will extend recent rally to 161.8% projection of 1.2061 to 1.2916 from 1.2246 at 1.3629 next. However, firm break of 1.2789/2802 will raise the chance of rejection by 1.3065 medium term fibonacci level and bring deeper fall to 55 day EMA (now at 1.2741).
In the bigger picture, we're favoring the medium term bullish case. That is larger down trend from 1.4689 has completed at 1.2061 as a correction, drawing support from 50% retracement of 0.9406 (2011 low) to 1.4689 (2015 high) at 1.2048. Sustained break of 38.2% retracement of 1.4689 to 1.2061 at 1.3065 will pave the way to 61.8% retracement at 1.3685. This will be the preferred case now as long as 1.2802 support holds. However, rejection by 1.3065 will argue that price action from 1.2061 is merely a three wave corrective pattern. And 1.2061 will be put back into focus with medium term bearishness revived.
EUR/USD Daily Outlook
Daily Pivots: (S1) 1.2261; (P) 1.2324 (R1) 1.2364; More....
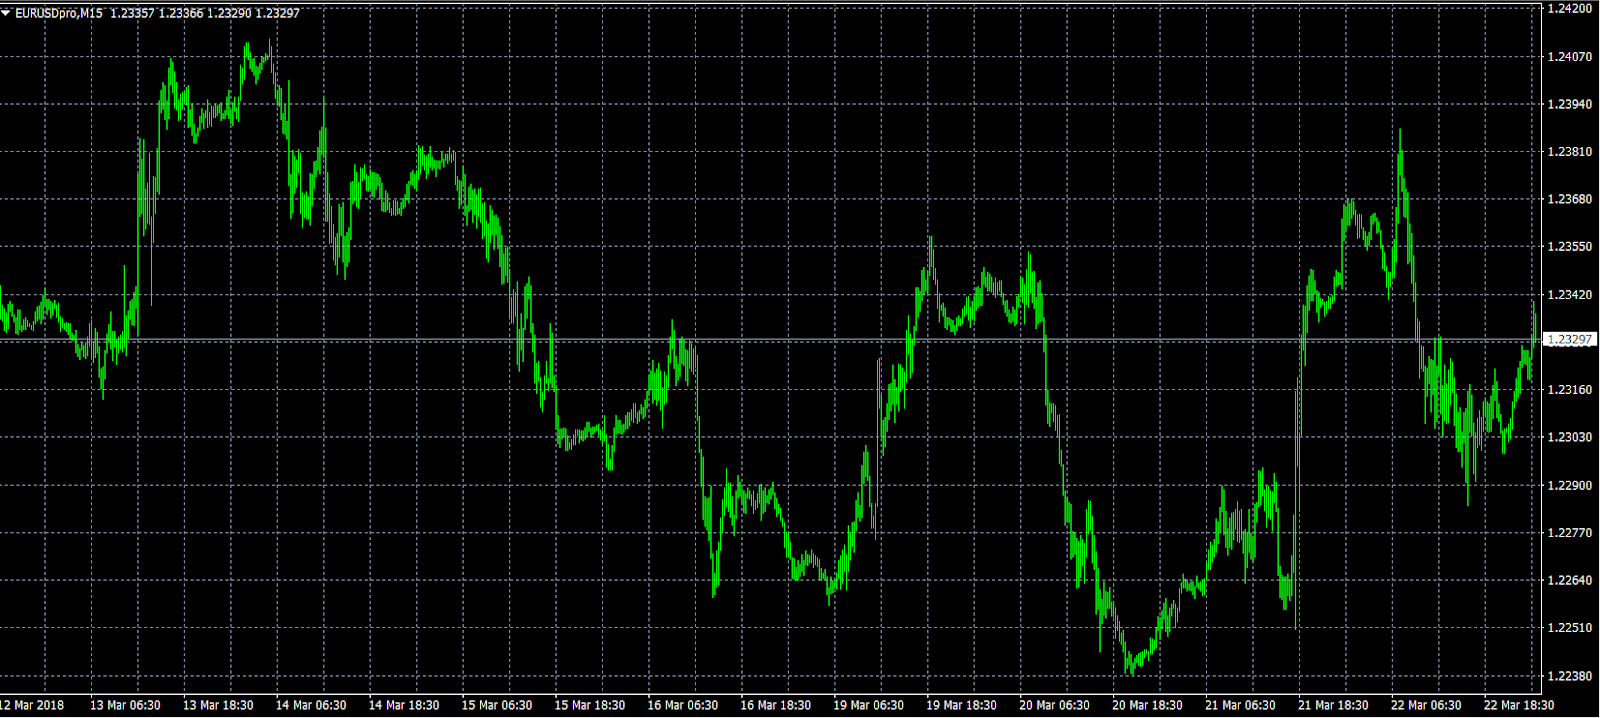
Outlook in EUR/USD remains unchanged. Price actions from 1.2445 is a corrective pattern in form of falling wedge. And, it might be completed at 1.2238 already. Further rise should be seen to 1.2445 first. Break will resume whole rebound from 1.2154 and target 1.2555 high, which is close to 1.2516 key long term fibonacci level. On the downside, however, firm break of 1.2238 will turn bias back to the downside, to resume the fall from 1.2555 through 1.2154.
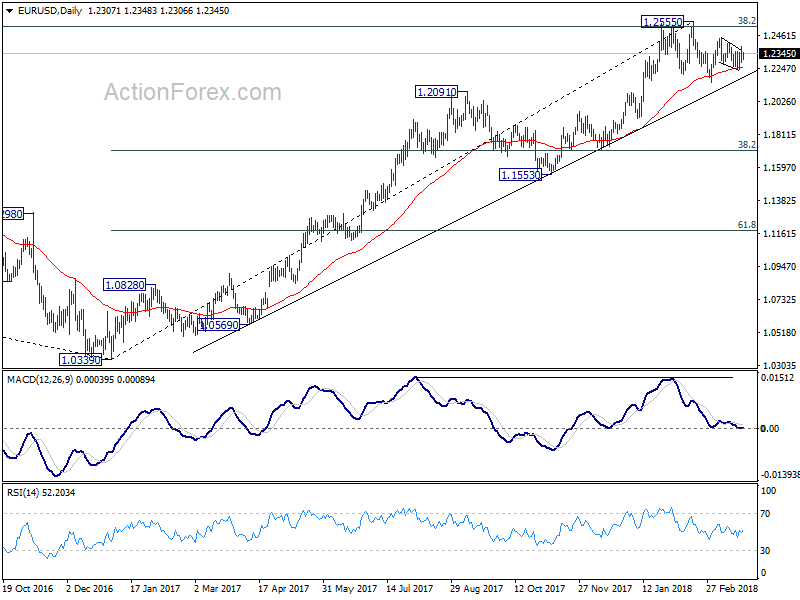
In the bigger picture, key fibonacci level at 38.2% retracement of 1.6039 (2008 high) to 1.0339 (2017 low) at 1.2516 remains intact despite attempts to break. Hence, rise from 1.0339 medium term bottom is still seen as a corrective move for the moment. Rejection from 1.2516 will maintain long term bearish outlook and keep the case for retesting 1.0039 alive. Firm break of 1.1553 support will add more medium term bearishness. However, sustained break of 1.2516 will carry larger bullish implication and target 61.8% retracement of 1.6039 to 1.0339 at 1.3862.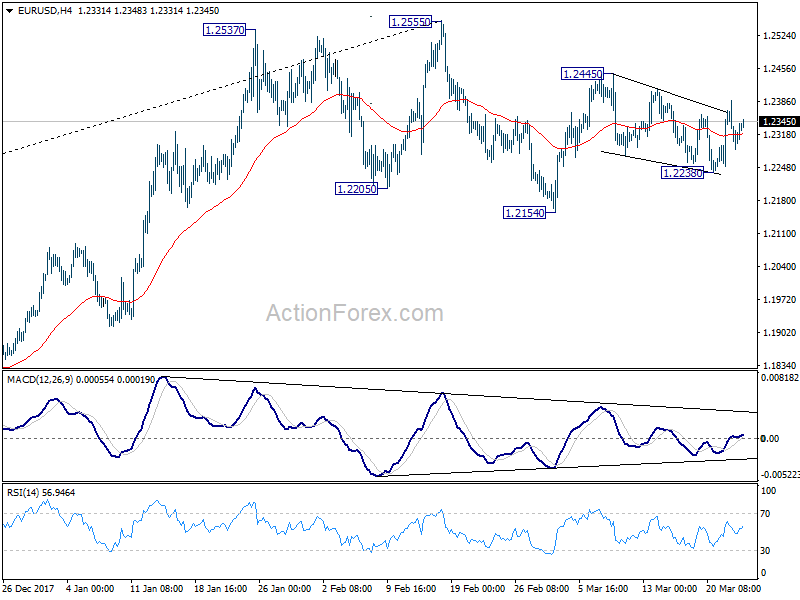
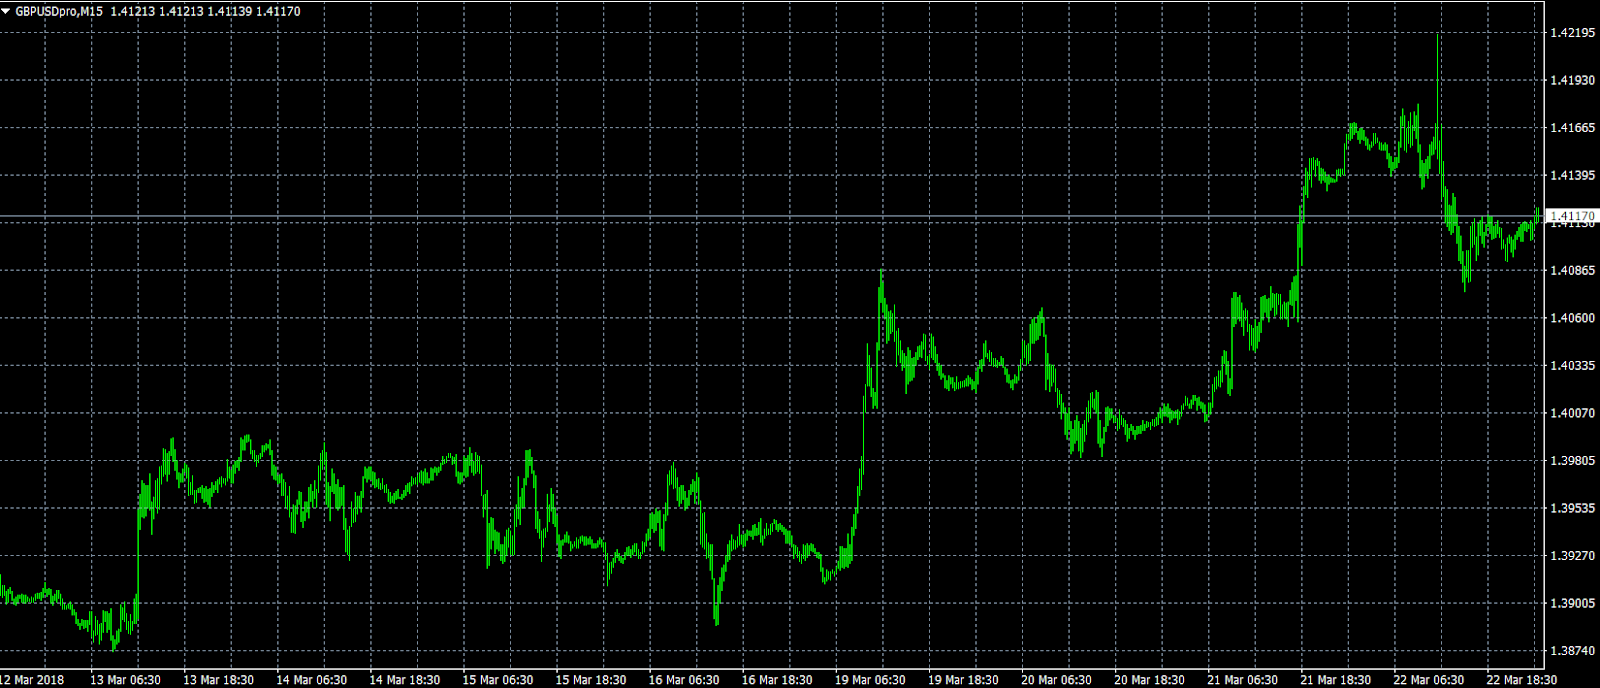
GBP/USD Daily Outlook
Daily Pivots: (S1) 1.4041; (P) 1.4128; (R1) 1.4181; More....
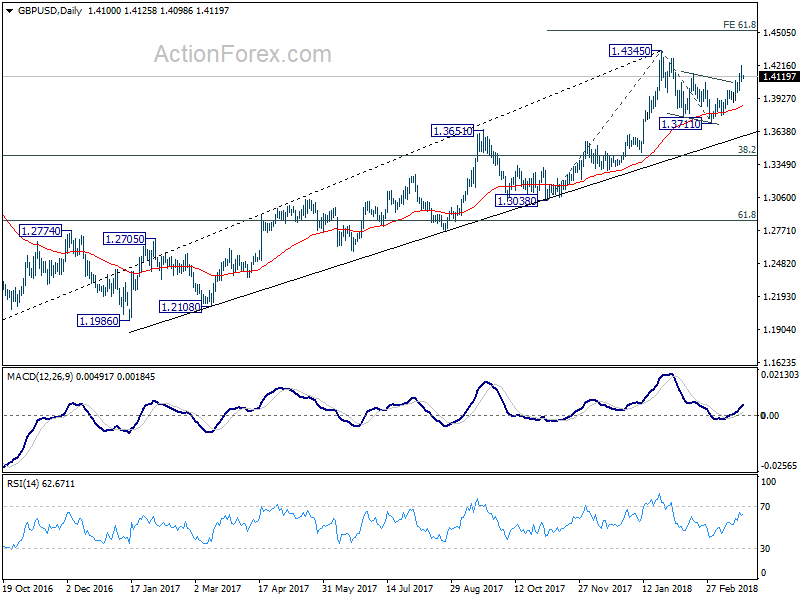
No change in GBP/USD's outlook. With 1.3982 minor support intact, further rise is expected to retest 1.4345. Break there will resume larger up trend and target 61.8% projection of 1.3038 to 1.4345 from 1.3711 at 1.4519 next. Nonetheless, break of 1.3982 will argue that rebound from 1.3711 has completed. And, intraday bias will be turned back to the downside for 1.3711 support and possibly below, to extend the corrective pattern from 1.4345.
In the bigger picture, as long as 1.3038 support holds, medium term outlook in GBP/USD will remains bullish. Rise from 1.1946 is at least correcting the long term down from 2007 high at 2.1161. Further rally would be seen back to 38.2% retracement of 2.1161 (2007 high) to 1.1946 (2016 low) at 1.5466. However, GBP/USD fails to sustain above 55 month EMA (now at 1.4259) so far. Break of 1.3038 support, will suggest that rise from 1.1946 has completed and will turn outlook bearish for retesting this low.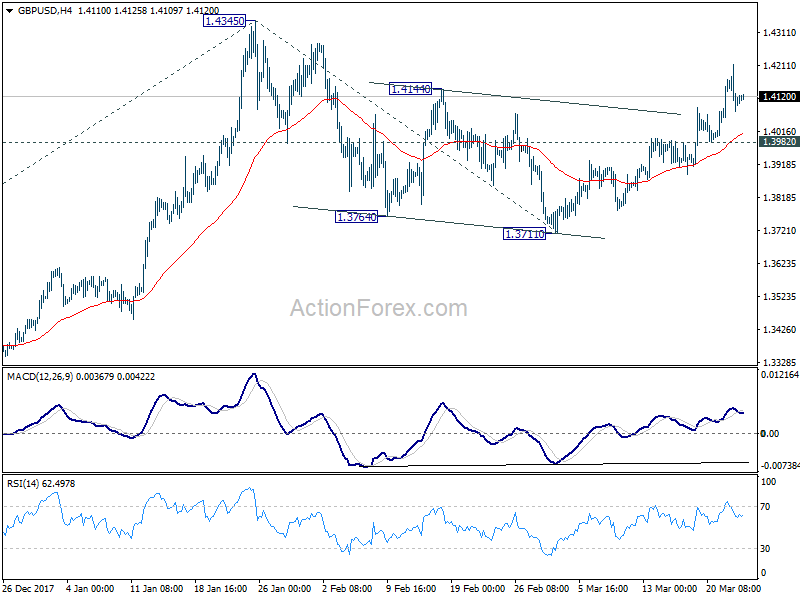
USD/CHF Daily Outlook
Daily Pivots: (S1) 0.9461; (P) 0.9488; (R1) 0.9516; More...
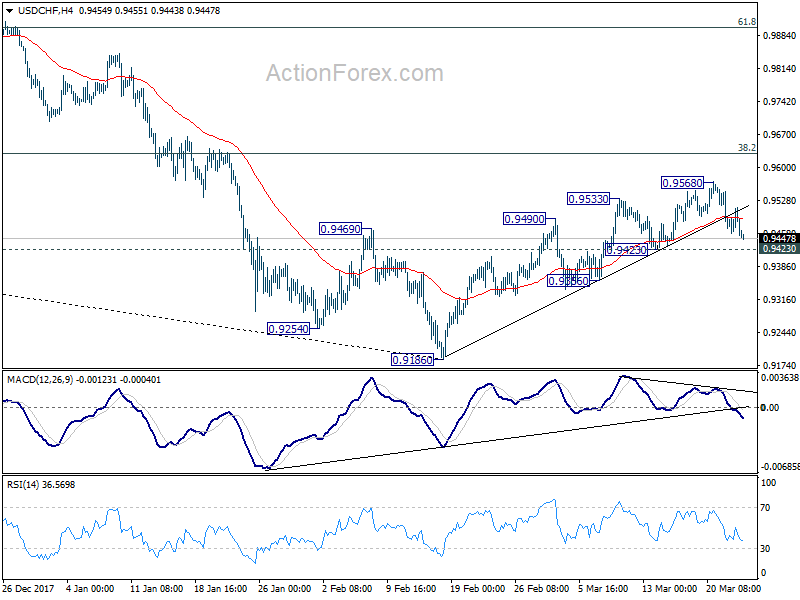
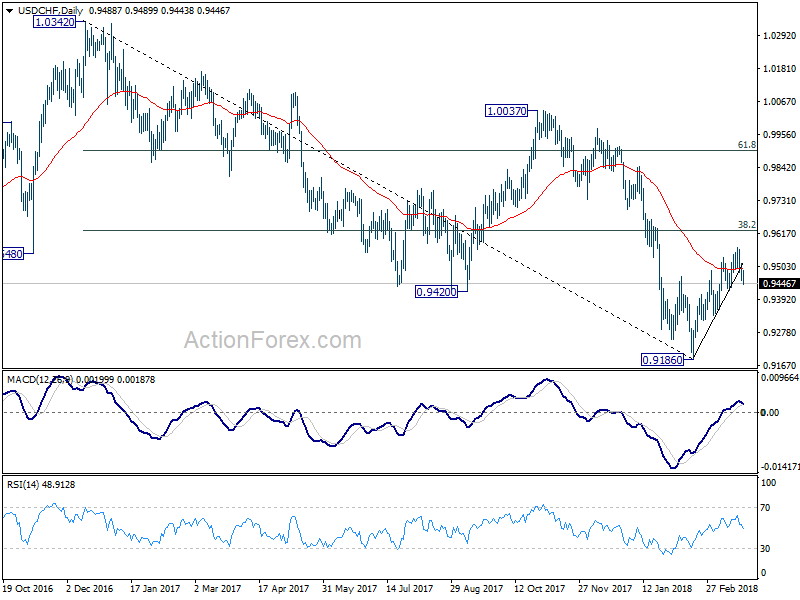
USD/CHF's fall from 0.9568 extends lower today. But still it's staying above 0.9423 minor support. Intraday bias remains neutral first. At this point, rebound from 0.9186 could still extend higher. But considering bearish divergence condition in 4 hour MACD, upside should be limited by 0.9626 key fibonacci level, to complete the rebound from 0.9186. Break of 0.9432 support will indicate near term reversal and turn bias to the downside for retesting 0.9186 low. Nonetheless, sustained break of 0.9626 will carry larger bullish implications.
In the bigger picture, fall from 1.0342 is seen as a medium term down trend. Current development is raising the chance that it is completed. But there is no confirmation yet. Focus will now be back on 38.2% retracement of 1.0342 (2016 high) to 0.9186 (2018 low) at 0.9626. Sustained break there will add much credence to the case of trend reversal and target 61.8% retracement at 0.9900 and above. However, rejection from 0.9626 will maintain medium term bearishness for another low below 0.9186.
North America Takes The Spotlight On Friday
A steady stream of North American data will capture the spotlight on Friday, giving investors the latest on the U.S. and Canadian economies.
There are no major data releases scheduled during European trading. On the policy front, the European Council is planning to conclude a meeting in Brussels on Friday. In the UK, the Bank of England (BOE) will unveil its Quarterly Bulletin, which provides regular commentary on economic and financial developments.
Federal Open Market Committee (FOMC) member Raphael Bostic will kick off the North American session with a speech at 12:30 GMT. Bostic was part of the policy-setting committee that voted to raise interest rates on Wednesday.
FOMC member Neel Kashkari is also expected to speak later in the day.
On the data front, the US Department of Commerce will report on durable goods orders at 12:30 GMT. Orders for manufactured goods meant to last three years or more is projected to rise 1.5% in February after falling 3.7% the month before. Excluding transportation equipment, durable goods orders likely rose 0.5%.
Later in the morning, the Commerce Department will also report on new home sales for the month of February. Sales are expected to rise 4.4% to a seasonally adjusted 623,000. The same category plunged 7.8% the month before.
North of the border, the Canadian government will also release a pair of high-profile reports on Friday. Statistics Canada will issue its monthly retail sales report at 12:30 GMT. Receipts at retail stores are projected to bounce back 1.1% after sliding 0.8% the month before. Excluding automobiles, sales are expected to rise 0.9%.
The statistics agency will also report on inflation at 12:30. The February inflation numbers are expected to show annual price growth of 2% in February, up sharply from 1.7% in January. So-called core inflation, which strips away volatile goods such as food and energy, is projected to rise 1.4% from 1.2%.
EUR/USD
Thursday was a volatile session for the euro. The common currency plunged nearly 90 pips against the dollar, hitting a session low around 1.2302. It has since recovered 0.2%, signaling the continuation of its newfound range.
USD/CAD
The Canadian dollar extended its recovery on Thursday, as policymakers on both sides of the border expressed greater optimism over NAFTA. The USD/CAD exchange rate declined to the low 1.2900 region, having given up more than 200 pips since the start of the week.
GBP/USD
Pound sterling backtracked on Thursday, just one day after hitting fresh six-week highs against the greenback. GBP/USD was back in the driver’s seat on Friday, with the pair adding 0.1% to trade comfortably above 1.4100. The pair continues to see strong support above the 21-day SMA near 1.3900. The 200-week moving average is located around 1.4300.
Asian Market Update: Asian Markets Track US Declines As Trump And China Announce Trade Actions: Over 4% Losses In...
Headlines/Economic Data
General Trend:
- Steelmakers and exporters in Japan decline, as the government continues to seek tariff exemptions
- Samsung Electronics declines over 2%; issued cautious commentary on OLED and mobile businesses in China
- Tencent declines over 4% amid share placement
- Foreigners continued to sell Japanese equities, weekly data
- 10 year US and China bond yields decline in the face of equity weakness, trade concerns
- Japan 10-year JGB yield moves to lowest since Nov 2017
- At the shorter end, Australia 3-month bank bill rate fixed higher
- Japan Feb CPI rises as expected to highest since March 2015; still shy of BoJ price target
- China traded metals move generally lower
- USD/JPY hits 16-month low below ¥105
- Japan Chief Cabinet Sec Suga thinks US trade measures are likely impacting forex
Australia/New Zealand:
- ASX 200 opened -1.1%; closed -2%
- ASX 200 Resources Index -2.6%, Financials -2.2%
China/Hong Kong
- Shanghai Composite opened -2.8%, Hang Seng opened -3.7%
- Hang Seng Info Tech Index -4.3%, Materials -3.6%, Industrial Goods -3.6%, Consumer Goods -3.4%, Energy -3.4%, Property/Construction -3.1%
- Shanghai Composite Property Sub-index declines over 3%
- (CN) China Commerce Ministry (MOFCOM): Plans reciprocal tariffs on US steel and aluminum products; plans tariffs on $3B in US steel, aluminum, pork and wine imports; To take legal action at WTO
- (CN) China Commerce Ministry (MOFCOM): China does not want a trade war but not afraid of one
- (CN) Brokerage companies in China said to increase risk controls related to share pledges - China Securities Journal
- (CN) China regulator said to place curb on negotiable certificate of deposit (NCD) investments by bond funds - US financial press
- (CN) PBoC Open Market Operation (OMO): Skips OMO v CNY10B injected in 7-day reverse repos prior; Net: CNY90B drain v CNY150B drain prior
- (CN) China PBoC sets yuan reference rate at 6.3272 v 6.3167 prior
Japan
- Nikkei 225 opened -1.9%; closed -4.5%
- TOPIX Electric Appliances Index -4.2%, Iron & Steel -3.8%
- Fast Retailing [9983.JP] declines over 5% (has exposure to US and China): expected to report March SSS on April 3rd
- (JP) JAPAN FEB NATIONAL CPI Y/Y: 1.5% V 1.5%E; EX-FRESH FOOD (CORE) Y/Y: 1.0% V 1.0%E (both figures are highest since March 2015
- (JP) Japan Fin Min Aso: US trade move does not warrant 'surge in yen (JPY)'
- (JP) BoJ New Executive Dir Maeda: Not at point where can consider policy exit as BOJ remains distant from price target
- (JP) BoJ Dep Gov Wakatabe: BoJ policy is in the right direction, producing results
- (JP) Exporters in Japan may lose ¥500B if USD/JPY stays at ¥106 - Nikkei
Korea
- Kospi opened -2%
Other Asia
- (ID) Indonesia 10-year government bond yield rises over 5bps; Indonesia Finance Ministry official cites trade war concerns
- (SG) Singapore Feb CPI M/M: 0.5% v 0.5%e; Y/Y: 0.5% v 0.4%e
North America
- US equities ended broadly lower: Dow -2.9%, S&P500 -2.5%, Nasdaq -2.4%, Russell 2000 -2.2%
- S&P500 Financials -3.7%, Industrials -3.3%; Utilities +0.4%
- Micron [MU] declines over 3% in the afterhours amid Q2 results and guidance
- Nike [NKE] rose over 6% in the afterhours after reporting Q3 results and guidance
- (US) Pres Trump announces $50B in tariffs over China intellectual property trade violations (as expected); Tariffs specifics to be published by USTR within 15 days; industry to get 30 day comment period; Identified 1,300 product categories that might be covered by the new tariffs - press
- (US) Trade Rep Lighthizer: EU, Argentina, Australia, Brazil, South Korea will be exempt from trade tariffs; We have told Japan that we want a free trade agreement - Congressional testimony
- (US) John Dowd resigns as Trump's lead attorney as part of Mueller probe – NYT
- (US) Trump Administration National Security Adviser McMaster to resign; to be replaced by Bush Admin official John Bolton
- (US) House passes $1.3T omnibus spending bill (as expected)
- (US) Senate advances $1.3T spending bill; final vote 65 to 32
Europe
- (EU) ECB Draghi said to provide European leaders with upbeat view on economy at EU summit – press
- (EU) S&P affirms ECB rating at AAA; outlook stable
- (EU) EU Summit said to end without conclusion of US tariffs
- (DE) Germany Chancellor Merkel: economy is going well in all EU member states
- (UK) UK PM May: To stay for second day of EU Summit in order to discuss trade
- Saudi Oil Min Al-Falih: reiterates OPEC/non-OPEC partnership will be maintained into 2019
Levels as of 01:00ET
- Hang Seng -3.1%; Shanghai Composite -3.5%; Kospi -2.9%
- Equity Futures: S&P500 -0.7%; Nasdaq100 -1.1%, Dax -0.8%; FTSE100 -0.3%
- EUR 1.2299-1.2342 ; JPY 104.63-105.42; AUD 0.7686-0.7724 ;NZD 0.7202-0.7229
- Feb Gold +0.8% at $1,338/oz; Feb Crude Oil +1% at $64.97/brl; Mar Copper -0.8% at $3.001/lb
Oil Prices Continue To Rise And Are Now Close To Breaking Through USD70
Market movers today
There are no significant market movers today. Focus will be on the US and China relationship and the risk of a trade war between the two.
The EU Summit in Brussels continues today. A rate decision by the Russian Central Bank is due. The market consensus is for a rate cut of 25bp.
We have a number of rating reviews. We expect Spain to be upgraded by S&P.
Selected market news
The markets continue to be dominated by the fear of a trade war between China and US. China has responded with tariffs against the US, after the US announced tariffs of at least USD50bn. China has put tariffs of USD3bn on US goods, which includes pork and steel.
This sent equities tumbling yesterday and the Asian markets are all in negative territory this morning with a decline of 2-4%. Safe haven assets such as US Treasuries and Bunds have gained significantly. Treasuries continued their gains this morning in Asian trade and 10Y US Treasury yields are now close to breaking through 2.8%.
Oil prices continue to rise and are now close to breaking through USD70.
Yesterday, Spain's Luis de Guindos was, as expected, formally appointed as new ECB Vice President by EU leaders yesterday. We view de Guindos as less dovish than outgoing Vitor Constâncio, but still as a leaning dove. De Guindos will start on 1 June for a non-renewable eight-year period. We do not expect a market impact on the appointment.
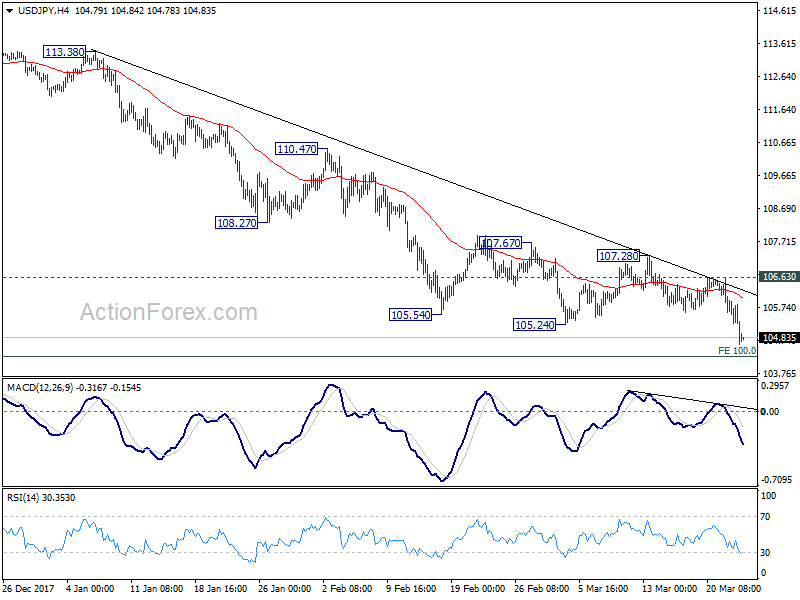
USD/JPY Daily Outlook
Daily Pivots: (S1) 104.99; (P) 105.53; (R1) 105.82; More...
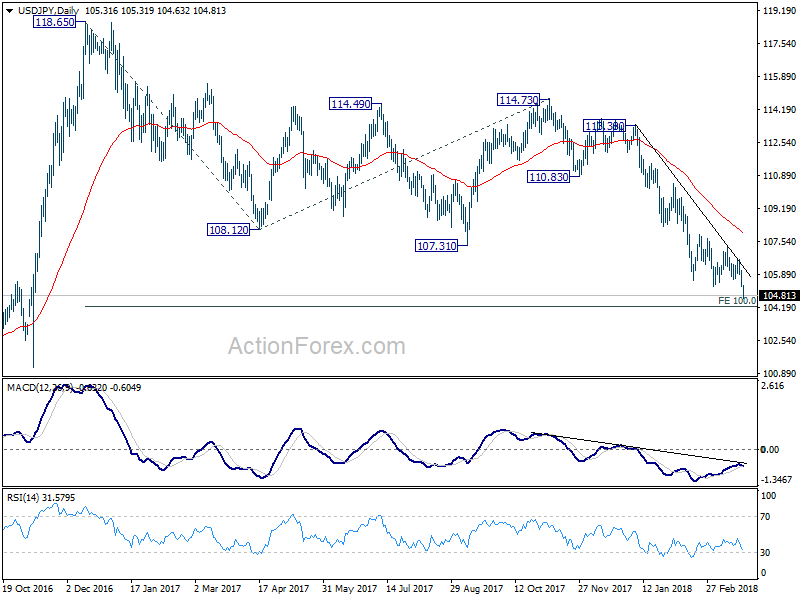
USD/JPY dives to as low as 104.63 so far as decline accelerates. Firm break of 105.24 support confirms resumption of decline from 114.73. Such fall is part of the whole pattern from 118.65. Intraday bias now stays on the downside for 100% projection of 118.65 to 108.12 from 114.73 at 104.20 next. Sustained break there will pave the way to 98.97 (2016 low). On the upside, break of 106.63 resistance is needed to indicate short term bottoming. Otherwise, outlook will remain bearish in case of recovery.
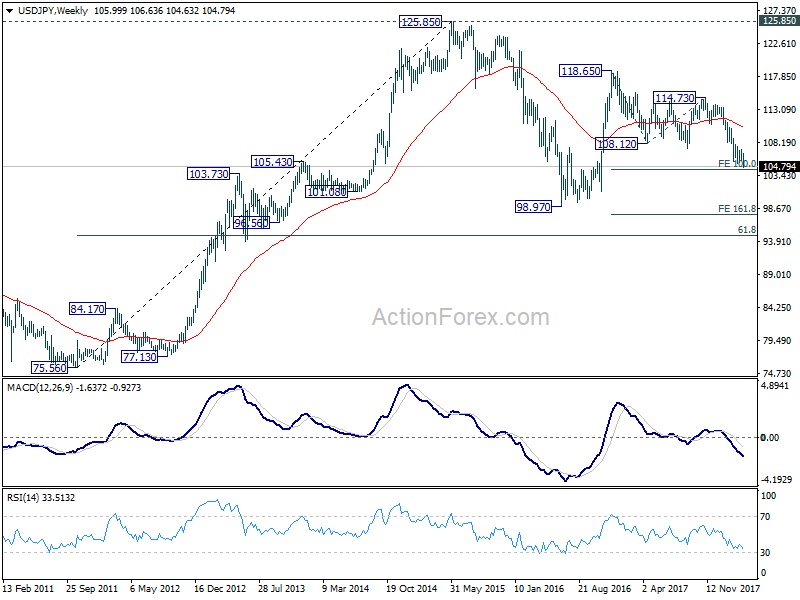
In the bigger picture, medium term down trend from 118.65 2016 high is still in progress and extending. Build up in downside momentum argues that it might be extending the whole corrective pattern from 125.85 (2015 high). 100% projection of 118.65 to 108.12 from 114.73 at 104.20 will be a key level to watch as firm break there could bring downside acceleration. And in that case, 98.97 key support level (2016 low) would at least be breached. This bearish case will now be favored as long as 108.12 support turned resistance holds.