Sample Category Title
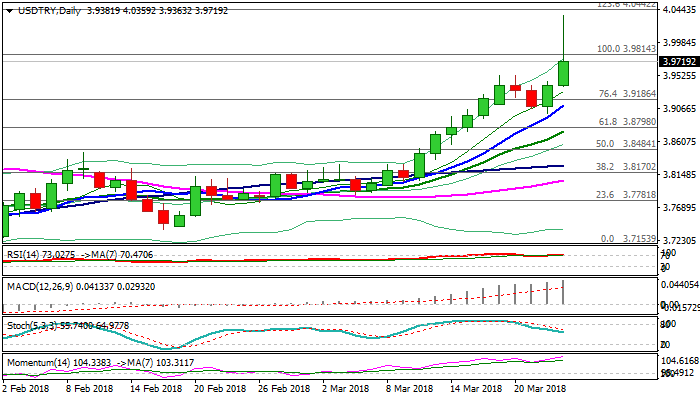
Technical Outlook: USDTRY – Hit New Record High On Break Above Psychological 4.00 Barrier
As signaled in my previous reports, the USDTRY pair regained its previous high at 3.9814 and surged through psychological 4.00 barrier into uncharted territory, hitting new record high at 4.0359 on Friday.
There were several factors that prompted lira’s most recent bearish acceleration, which signals that the fall is not over and weakness could extend.
Failure of CBRT to react on rising inflation, with recent rate hike seen as rather symbolic action and the central bank being unable for more significant action with only $90 bln reserves, along with widening Turkey’s current account deficit and higher US interest rates, marking the key factors that brought lira into current position.
The pair is on track to extend rally as negative sentiment around lira has worsened. Break above psychological 4.00 barrier is another negative signal which could drive the pair higher.
Today’s rally approached initial target at 4.0442 (Fibo 123.6% projection of the bull-leg from 3.7153 (25 Jan trough), break of which would expose 4.0830 (Fibo 138.2% projection) and psychological 4.10 barrier in extension.
Corrective easing could be seen as positioning for fresh rally and should be ideally contained above 3.9520 (19/20 Mar highs).
Res: 3.9814; 4.0000; 4.0359; 4.0442
Sup: 3.9520; 3.9363; 3.9186; 3.9097
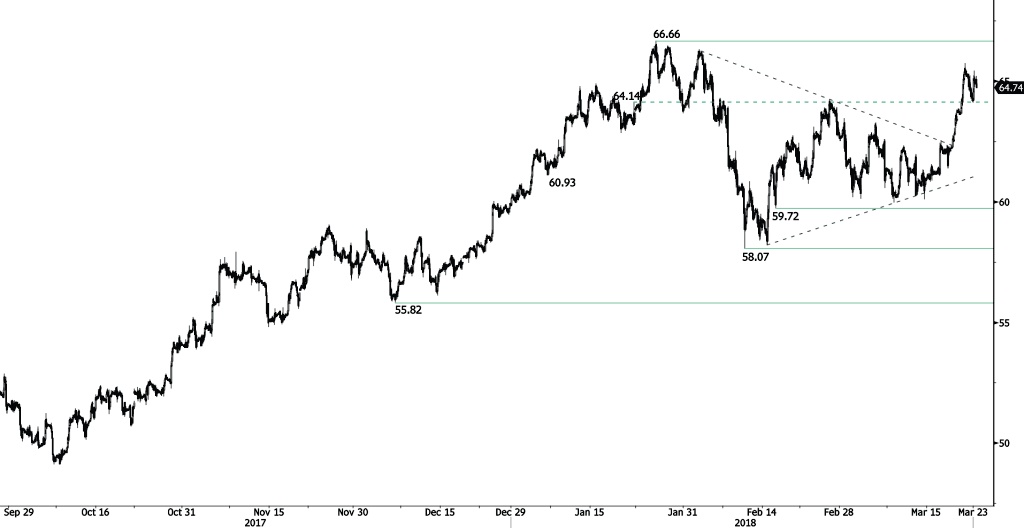
CRUDE OIL Strenghtening
Crude oil bullish trend starts back, heading along the 65.40 range. Hourly support and resistance are given at 59.72 (15/02/2018 low) and 66.66 (25/01/2018 high). The technical structure suggests short-term upward moves.
In the long-term, crude oil has recovered after its sharp decline last year. However, we consider that further weakness is very likely. For the time being, the pair lies in an upside trend since June 2017. Support lies at 42.20 (16/11/2016) while resistance is located at 77.83 (20/11/2014). Crude oil is trading largely above its 200 DMA.
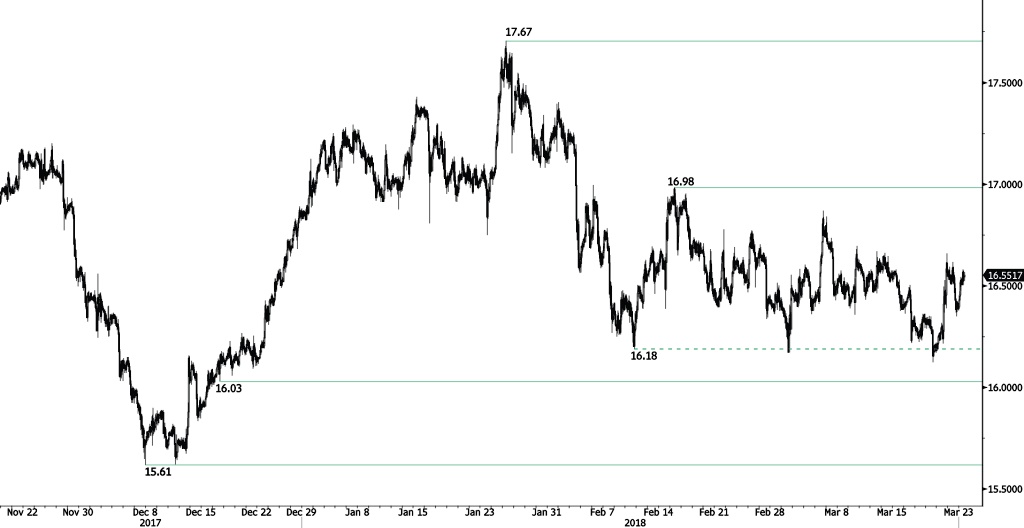
SILVER Edging Higher
Silver is currently trading at yesterday's price, heading higher along the 16.60 range. Silver is contained between hourly support and resistance at 16.03 (18/12/2017 low) and 16.98 (15/02/2018 high). The short-term technical structure suggests further short-term rising moves.
In the long-term, the trend remains negative/ sideways. Further downside is very likely. The pair is trading below its 200 DMA. Resistance is located at 21.58 (10/07/2014 high). Strong support can be found at 11.75 (20/04/2009).
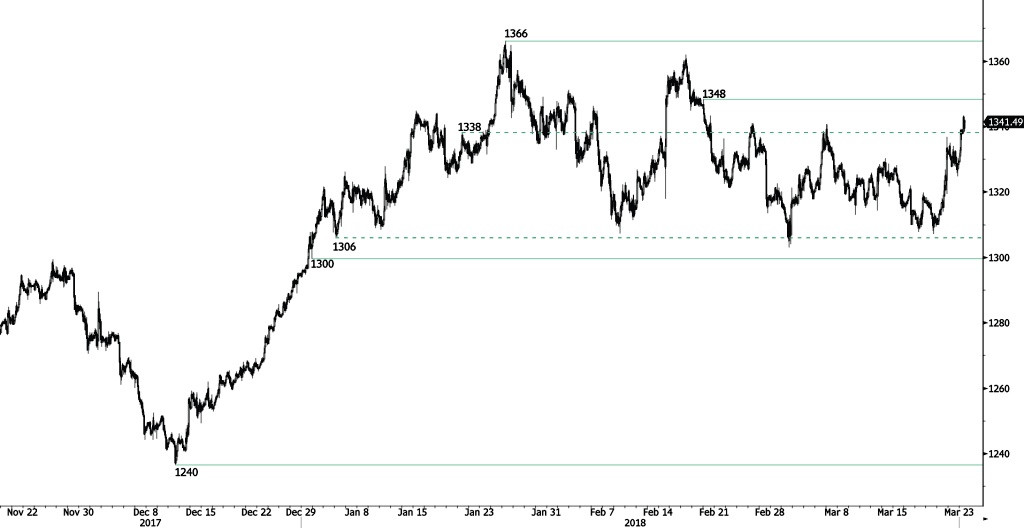
GOLD Approaching Resistance At 1348
Gold is edging higher following recent sideways trading phase, breaking hourly resistance at 1338 (19/01/2018) and heading for new hourly resistance given at 1348 (20/02/2018 high). Hourly support remains at 1300 (29/12/2017 low). The technical structure suggests short-term increase.
In the long-term, the technical structure suggests that there is a growing upside momentum. A break of 1'392 (17/03/2014) is required to confirm it. A major support can be found at 1'045 (05/02/2010 low).
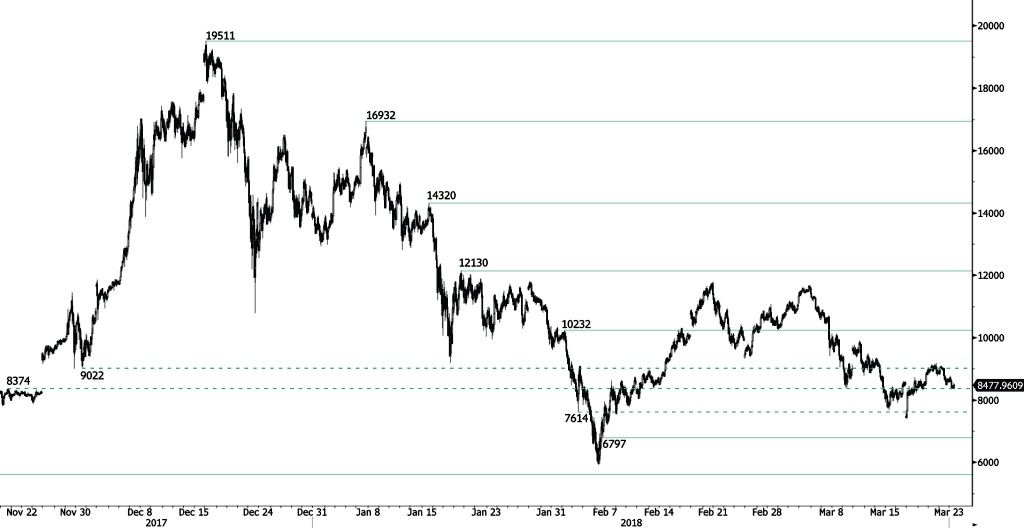
BITCOIN Bearish Consolidation
Bitcoin is trading sideways at 8500 range, expected to head slightly lower along the 8350 range. Bitcoin is contained between hourly support and resistance given at 6797 (06/02/2018 low) and 10232 (01/02/2018 high). The technical structure suggests further short-term sideways trading moves.
In the long-term, the digital currency has had an exponential growth but also presented important downturns. There is decent likelihood that the currency could stabilize between 7'000 - 12'000 in 2018. Bitcoin is approaching its 200 DMA (7000 range).
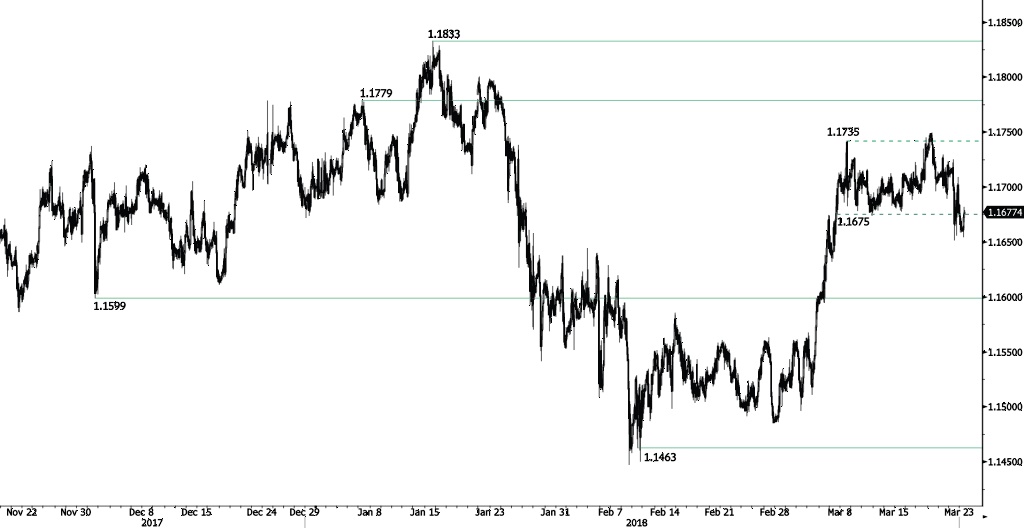
EUR/CHF Consolidation
EUR/CHF consolidation phase continues, the pair is maintained along the 1.1680 range and recently broke hourly support at 1.1675 (07/03/2018 low). Hourly support and resistance are now given at 1.1599 (01/12/2017 low) and 1.1779 (05/01/2018 high). The short-term technical structure suggests short-term sideways trading moves.
In the longer term, the technical structure has reversed. Strong resistance is given at 1.20 (level before the unpeg). Yet, the ECB's slowing QE program is likely to cause buying pressures on the euro, which should weigh in favour of the EUR/CHF. Support can be found at 1.0234 (20/04/2015 low).
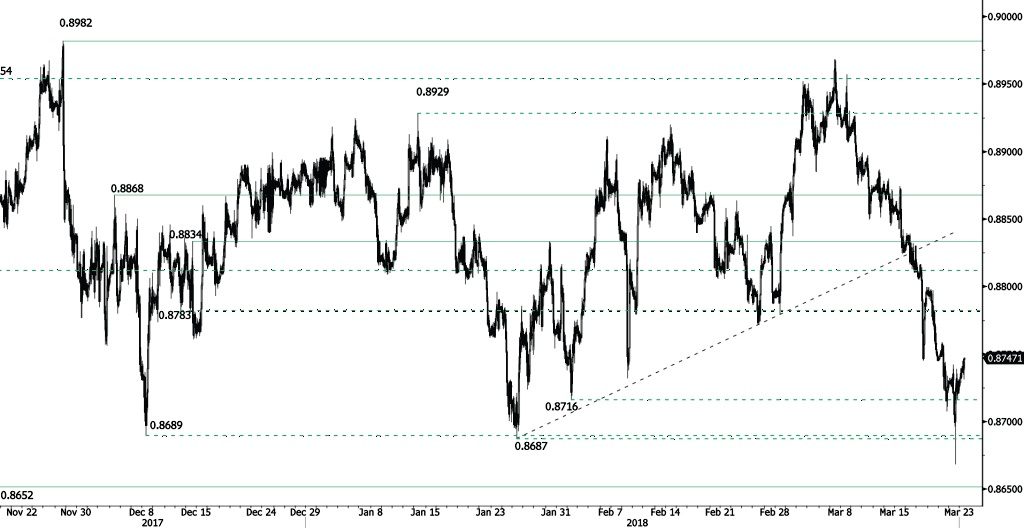
EUR/GBP Recovery Phase Stops
EUR/GBP recovery phase stopped following recent descent at 0.8668, breaking hourly support at 0.8687 (25/01/2018 low). The pair is heading along the 0.8725 range. Hourly support and resistance are given at 0.8687 (25/01/2018 low) and 0.8652 (08/06/2017 low). The technical structure suggests further short-term decrease.
In the long-term, the pair has largely recovered from 2015 lows. The technical structure suggests further upside pressure. Strong resistance can be found at 0.9500 (psychological level) while support remains at 0.8304 (05/12/2016 low). The pair is trading below its 200 DMA.
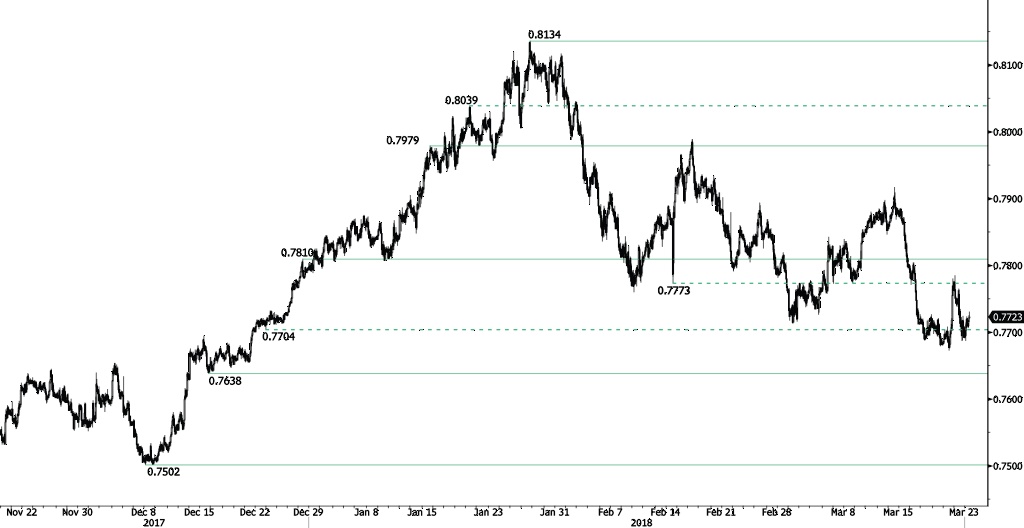
AUD/USD Increasing
AUD/USD is increasing following recent decline at 0.7687, currently trading above the 0.77 range and expected to head along 0.7730. Hourly support and resistance are given at 0.7638 (15/12/2017 low) and 0.7810 (28/12/2017 high). The technical structure suggests shortterm increase.
In the long-term, the upward trend slows down after failing to reach key resistance at 0.8164 (14/05/2015 low). Key support stands at 0.6009 (31/10/2008 low). A break of the key resistance at 0.8164 (14/05/2015 high) is needed to invalidate our long-term bearish view.
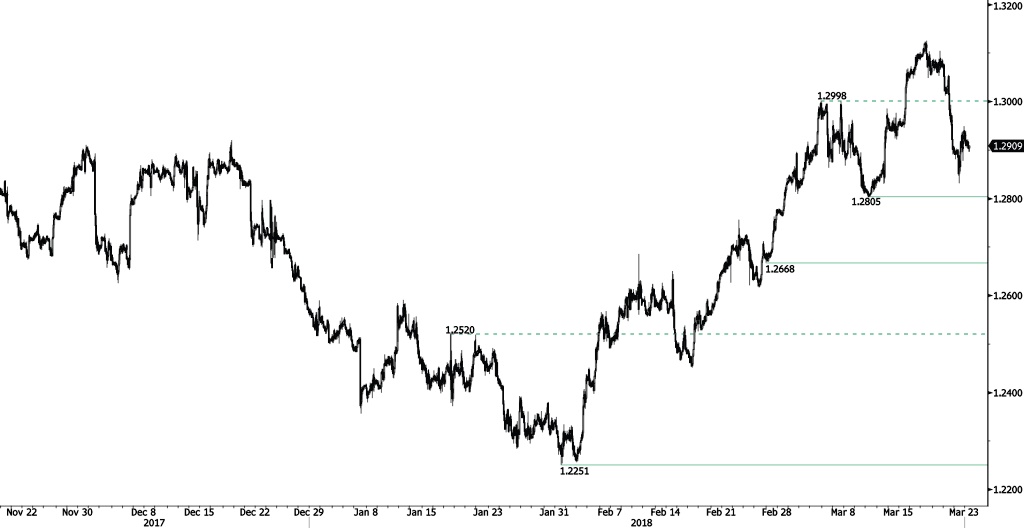
USD/CAD Trying To Bounce
USD/CAD is bouncing off from 1.2830 low heading higher along the 1.2950 range. Hourly support and resistance are given at 1.2805 (12/03/2018 low) and 1.3308 (23/06/2017 high). The short-term technical structure suggests short-term increase.
In the longer term, the pair is trading between resistance point at 1.3805 (05/05/2017 high) and support at 1.2128 (18/06/2015 low). Strong resistance is given at 1.4690 (22/01/2016 high). The pair is likely to head lower. The pairs is trading above its 200 DMA.
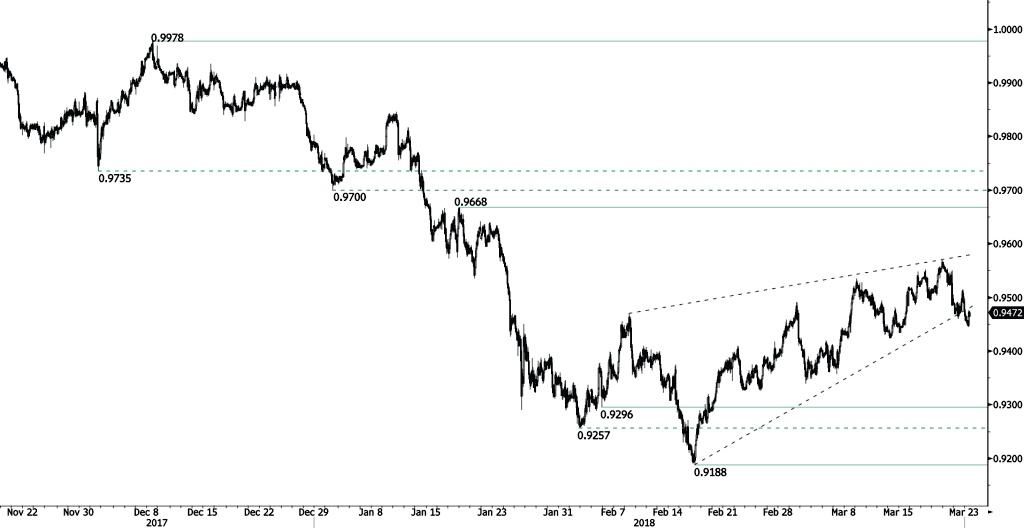
USD/CHF Exiting Symmetrical Triangle
USD/CHF bearish pressures pushed the pair lower at 0.9445, exiting the symmetrical triangle. USD/CHF is now recovering, approaching the 0.95 range. Hourly support and resistance are given at 0.9296 (05/02/2018 low) and 0.9668 (17/01/2018 high). The technical structure suggests short-term increase.
In the long-term, the pair is still trading in range since 2011 despite some turmoil when the SNB unpegged the CHF. Key support lies at 0.9072 (07/05/2015 low) while resistance at 1.0344 (15/12/2016 high) is distanced. The technical structure favours a long term bullish bias since the unpeg in January 2015.