
Sample Category Title
Japan 225 Stock Index Slides to 5-Month Lows; Bearish Bias in Place
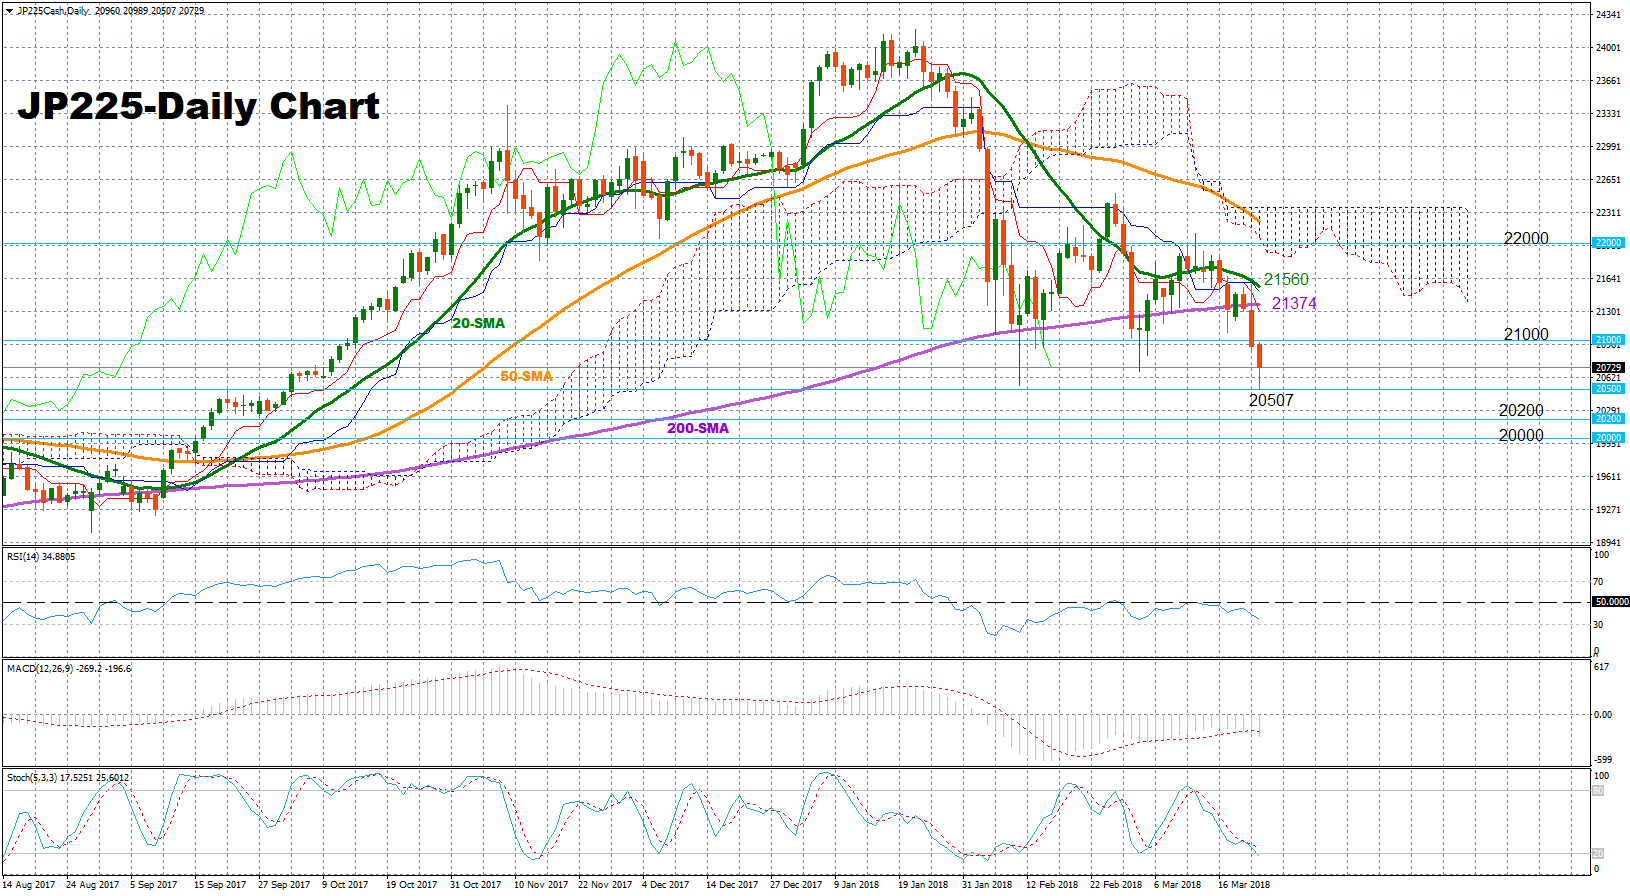
The Japan 225 stock index had a rough ride in recent days, extending negative momentum towards a five-month low of 20,507 during today’s Asian session. While the index’s range-bound trading started in early February remains very much in place, technical indicators point to further downside movements in the short-term, but such moves may soon lose steam given that the indicators are not far away from oversold levels.
The RSI continues to fluctuate in bearish territory below 50 and is currently moving downwards towards oversold levels, meaning that the risk is tilted to the downside in the short-term, though, a trend reversal could occur if the indicator falls below 30. The fast stochastics are also negatively sloped and around their oversold zone. MACD adds to the bearish picture as well, with the indicator gaining pace on the downside.
Should the market stretch lower, support could come first at around 20,500 before the focus shifts to 20,200, a frequently congested area during May-August. A drop under the 20,200 area, could raise bearish sentiment and drive the index further down to the 20,000 psychological level.
On the other hand, if the market rebounds, resistance could be found around the 21,000 handle, with a close above the area between 21374-21560, where the 200-day and the 20-day simple moving average lines are currently located, could decisively fuel bullish sentiment. In this case, the door could open to the 22,000 key-mark.
Turning to the medium-term picture, the structure is bearish given that price actions are currently taking place below the Ichimoku cloud and all the moving average lines displayed.
How Have EM Currencies Fared Amid Trade Risks?
The past few weeks have seen very interesting developments in emerging markets (EM). Some EM currencies have plunged, as rising concerns over a tit-for-tat global trade war amplified the already-troubled outlook for those economies. Others, however, have managed to hold their own quite well so far, defying the conventional wisdom that EM economies are the most exposed to the threat of increased protectionism.
The possibility of a retaliatory trade war appears increasingly more realistic with every passing day. The latest US tariffs on China, and the Chinese pledge to respond in kind, have caused investors to shy away from risky assets and to seek the safety of havens like the yen. Meanwhile, economic theory would suggest that emerging markets are also likely to feel the heat, as carry trades are unwound and capital flees those nations. How have prominent EM currencies performed in reality though?
Turkish lira – In dire straits
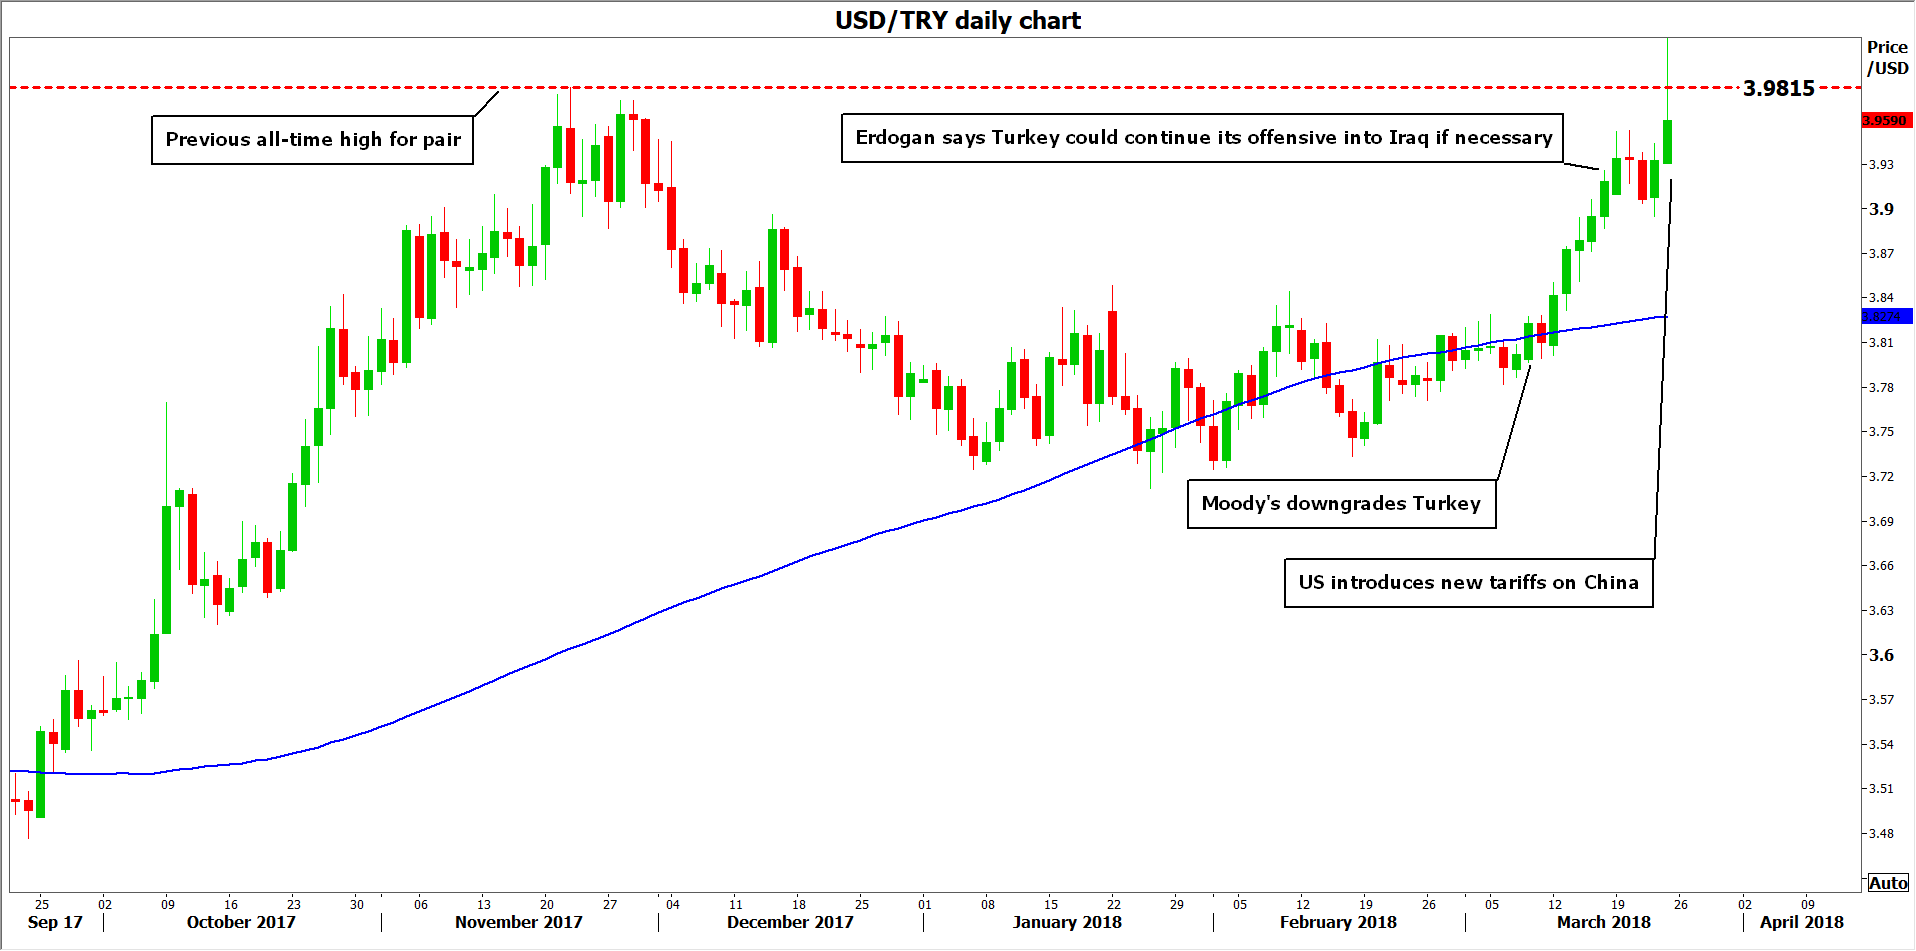
The Turkish lira is the worst performing currency this month, down 4.4% against the dollar and 5.3% versus the euro. It’s down a whopping 6.2% with the yen. In fact, the lira has recorded fresh all-time lows against all three (USD, EUR, JPY) this month, marking new milestones in the currency’s multi-decade downtrend. What is most striking is that the lira is at an all-time low against the dollar even in a period when the dollar is a major underperformer itself.
Concerns over global trade have clearly weighed on the currency, which was among the biggest losers following the new US tariffs on China. Besides trade woes though, the lira’s weakness is also owed to a worrisome cocktail of economic and political developments. Economically, core inflation stands well-into the double digits (roughly 12%) and while the central bank has adopted a hawkish tone, it has not raised rates materially enough to rein in inflation. The lack of concrete action enhances concerns over the Bank’s independence, considering President Erdogan’s frequent criticisms of high interest rates. Then there is the country’s widening current account deficit, signaling Turkey is increasingly reliant on foreign demand and would thus be vulnerable should risk appetite falter in markets, as is the case now. A downgrade of Turkey’s credit rating by Moody’s last week didn’t do the lira any favors either. Politically, Turkey’s deteriorating relationship with the US, as well as its military operations in Syria and potentially in Iraq soon, are other sources of anxiety.
Judging by the lira’s sensitivity to the latest US tariffs, the currency is likely to continue underperforming in case the situation escalates further, not least due to Turkey’s ballooning current account deficit and the capital flight that appears to be occurring. A factor that could limit further declines though, is the central bank. While it has not taken decisive action yet, if the lira weakens even more, it may choose to “defend” the currency by raising rates, an action that would also benefit the country’s inflation outlook.
 Russian ruble – Down, despite higher oil prices
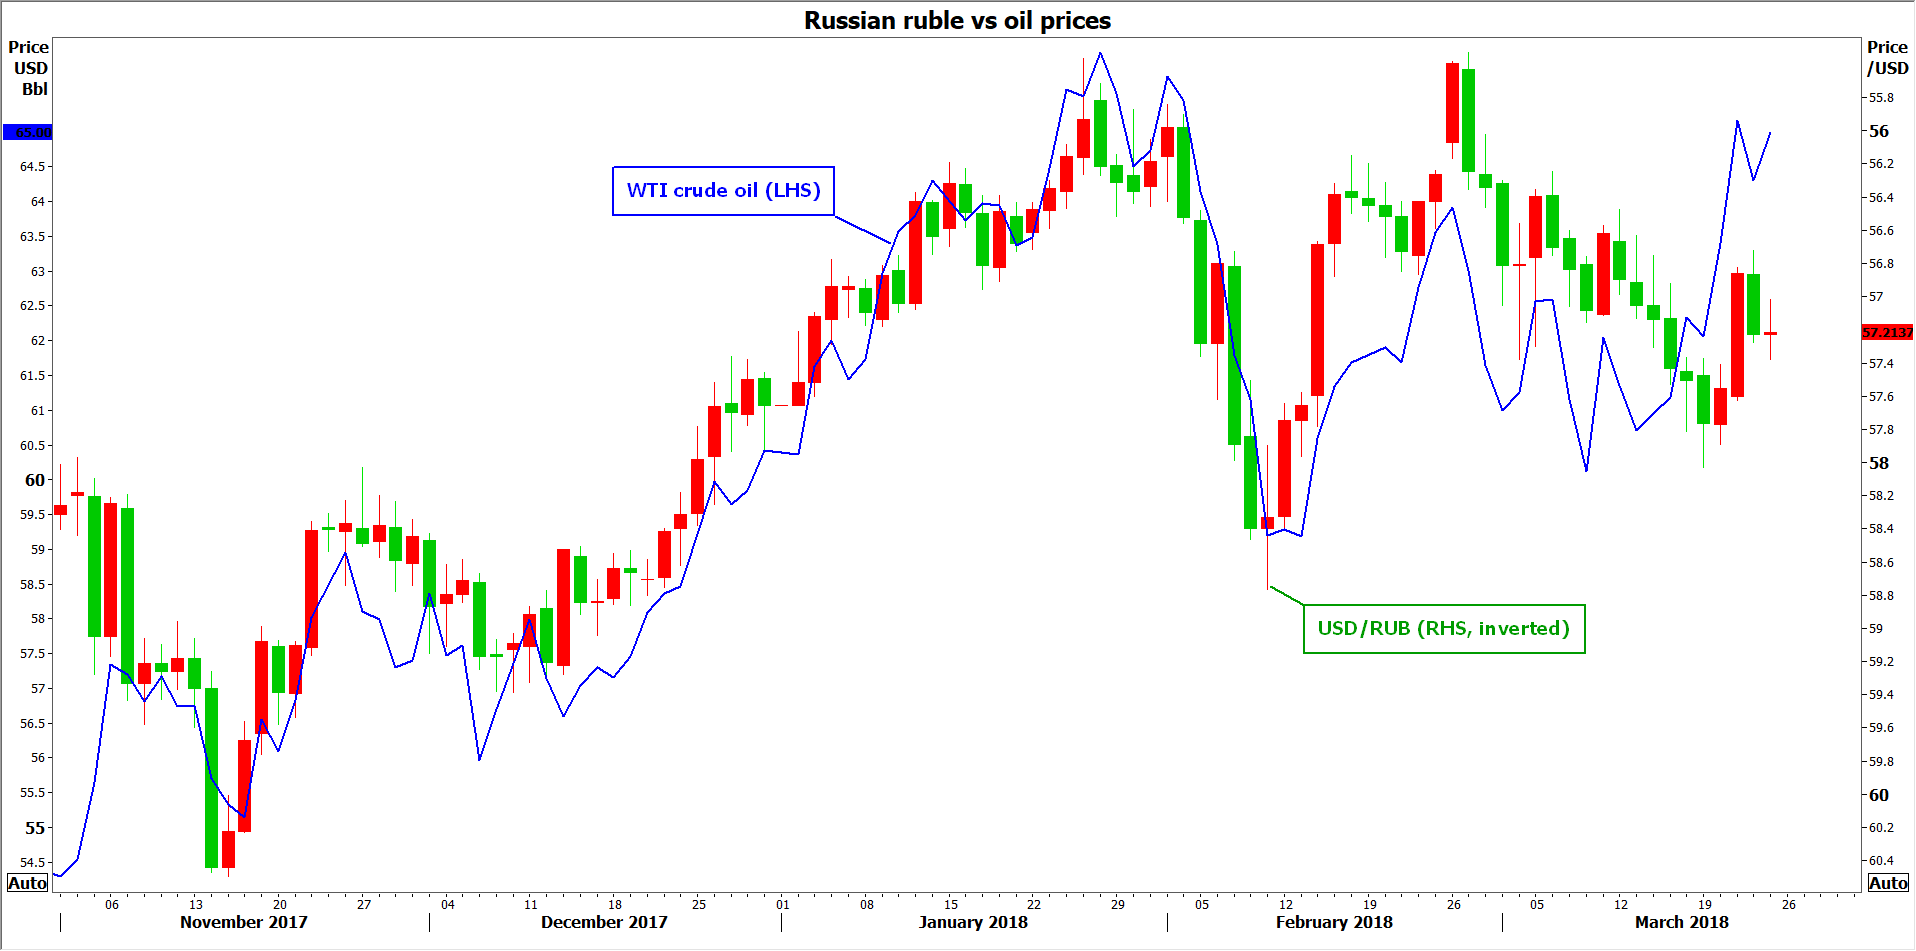
The Russian ruble is also down so far this month. It’s 1.3% lower against the dollar, and 2.6% versus the euro. In general, the currency is being dragged lower by the Bank of Russia, which has cut rates in 8 out of its 9 latest meetings in order to lift inflation. Additionally, political uncertainties have returned after the UK accused Russia of poisoning an ex-Russian spy on British soil, generating speculation that the West could impose fresh economic sanctions on Moscow. On the flipside though, oil prices have surged recently and since oil is Russia’s largest export, the ruble has enjoyed some demand, limiting larger declines in the currency.
In terms of tariffs and trade risks, the ruble did weaken after the initial announcement of US steel tariffs, but did not react much to these risks thereafter. A plausible explanation for that may be that while Russia does export some metals, its predominant export is oil, and no nation has so far mentioned tariffs on energy products. Thus, while the ruble could be negatively impacted by a further escalation in tensions, its downside may not be too large, unless of course Russia’s energy exports come under threat.
The currency’s forthcoming direction will also hinge on movements in oil prices, as well as expectations around the possibility of fresh sanctions by the US and EU.
 South African rand – Surprisingly resilient
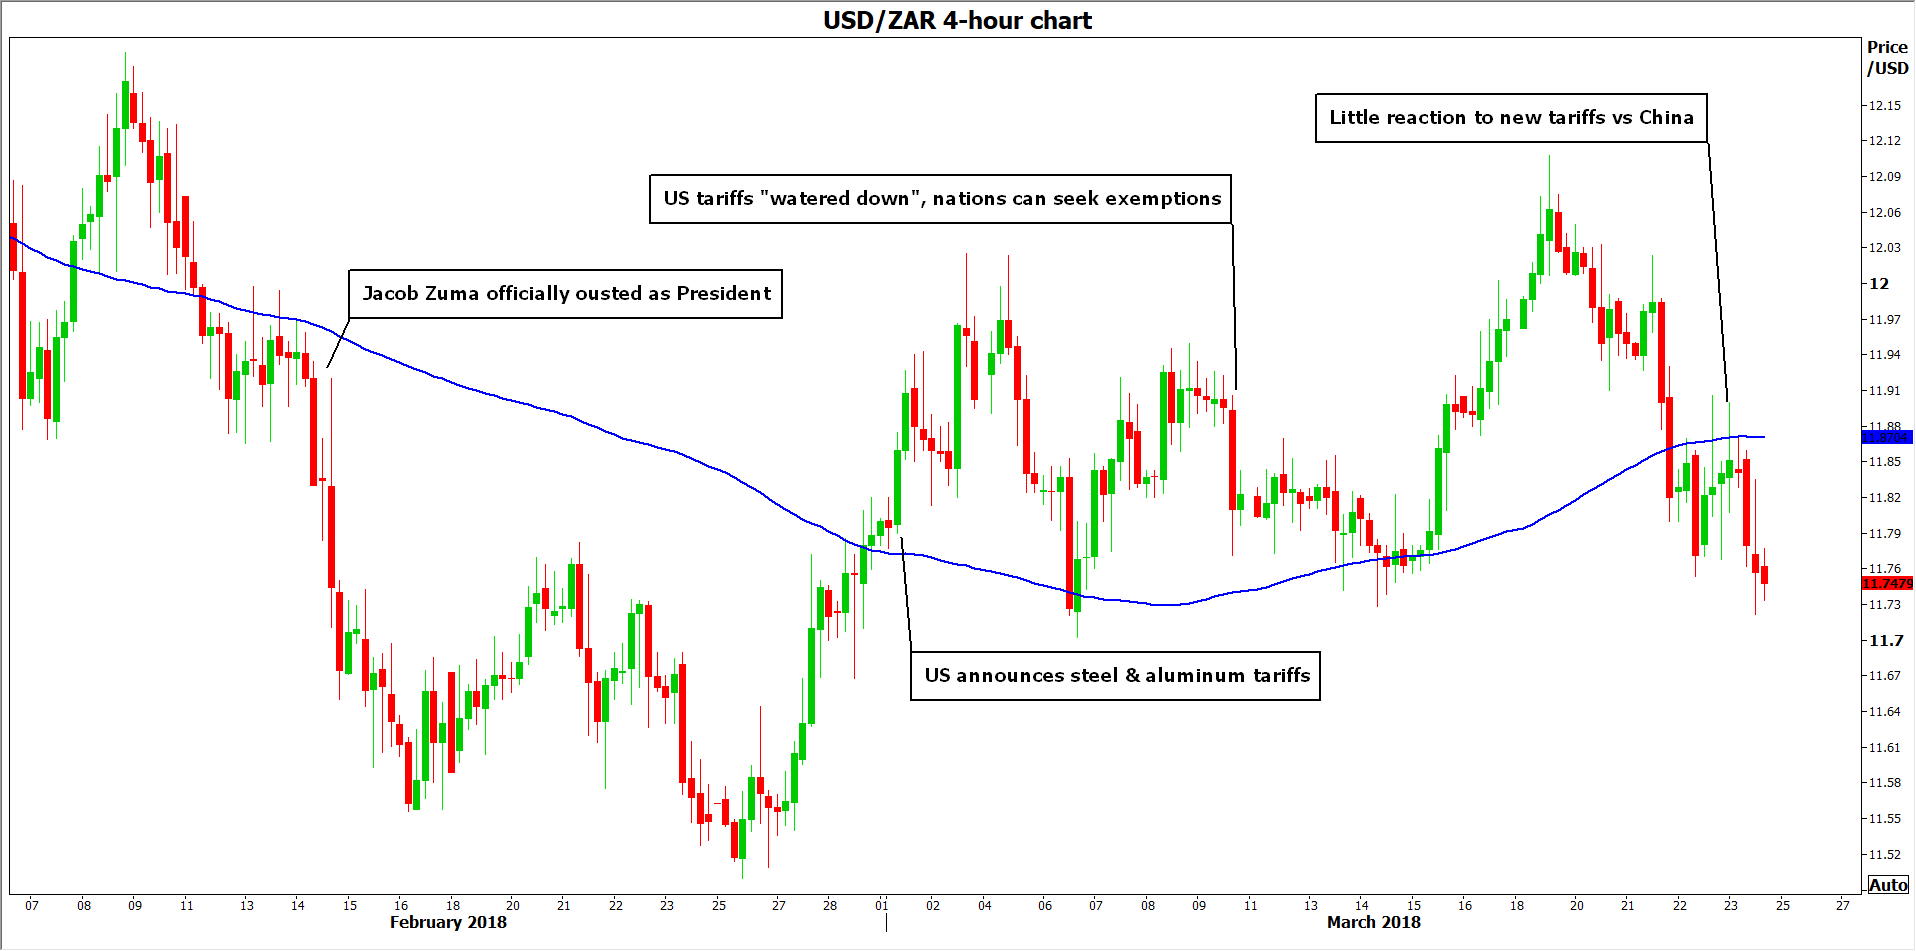
The South African rand has been performing relatively well this year, even amid a domestic political shakeup and global trade uncertainties. Specifically, the rand is up by nearly 5% against the dollar this year, and 2.2% higher against the euro. The ousting of Jacob Zuma from the Presidency in mid-February was a very pleasant development for the currency, which rallied on speculation his exit would usher in a new era of much-needed structural reforms.
Moreover, the rand was not hit as hard as one would expect from trade risks. Month-to-date, the currency is 0.8% lower versus the euro, but practically unchanged against the dollar. This is quite peculiar, as South Africa exports a broad variety of commodities, rendering its economy vulnerable to increased protectionism. That said, among those commodities are many precious metals like gold that have appreciated given the recent turmoil, a factor that has probably helped to offset any serious losses in the rand.
In the near-term, the currency’s performance is likely to depend on an upcoming credit rating review by Moody’s due later today, and a rate decision by the South African Reserve Bank (SARB) on March 28. Moody’s is the last remaining major ratings agency with an “investment grade” rating on South African debt, and in case of a downgrade to “junk”, the rand could come under selling interest as outflows intensify. Meanwhile, markets appear split on whether the SARB will cut rates next week, which represents another risk event for the currency.
 Mexican peso – Higher, despite trade risks
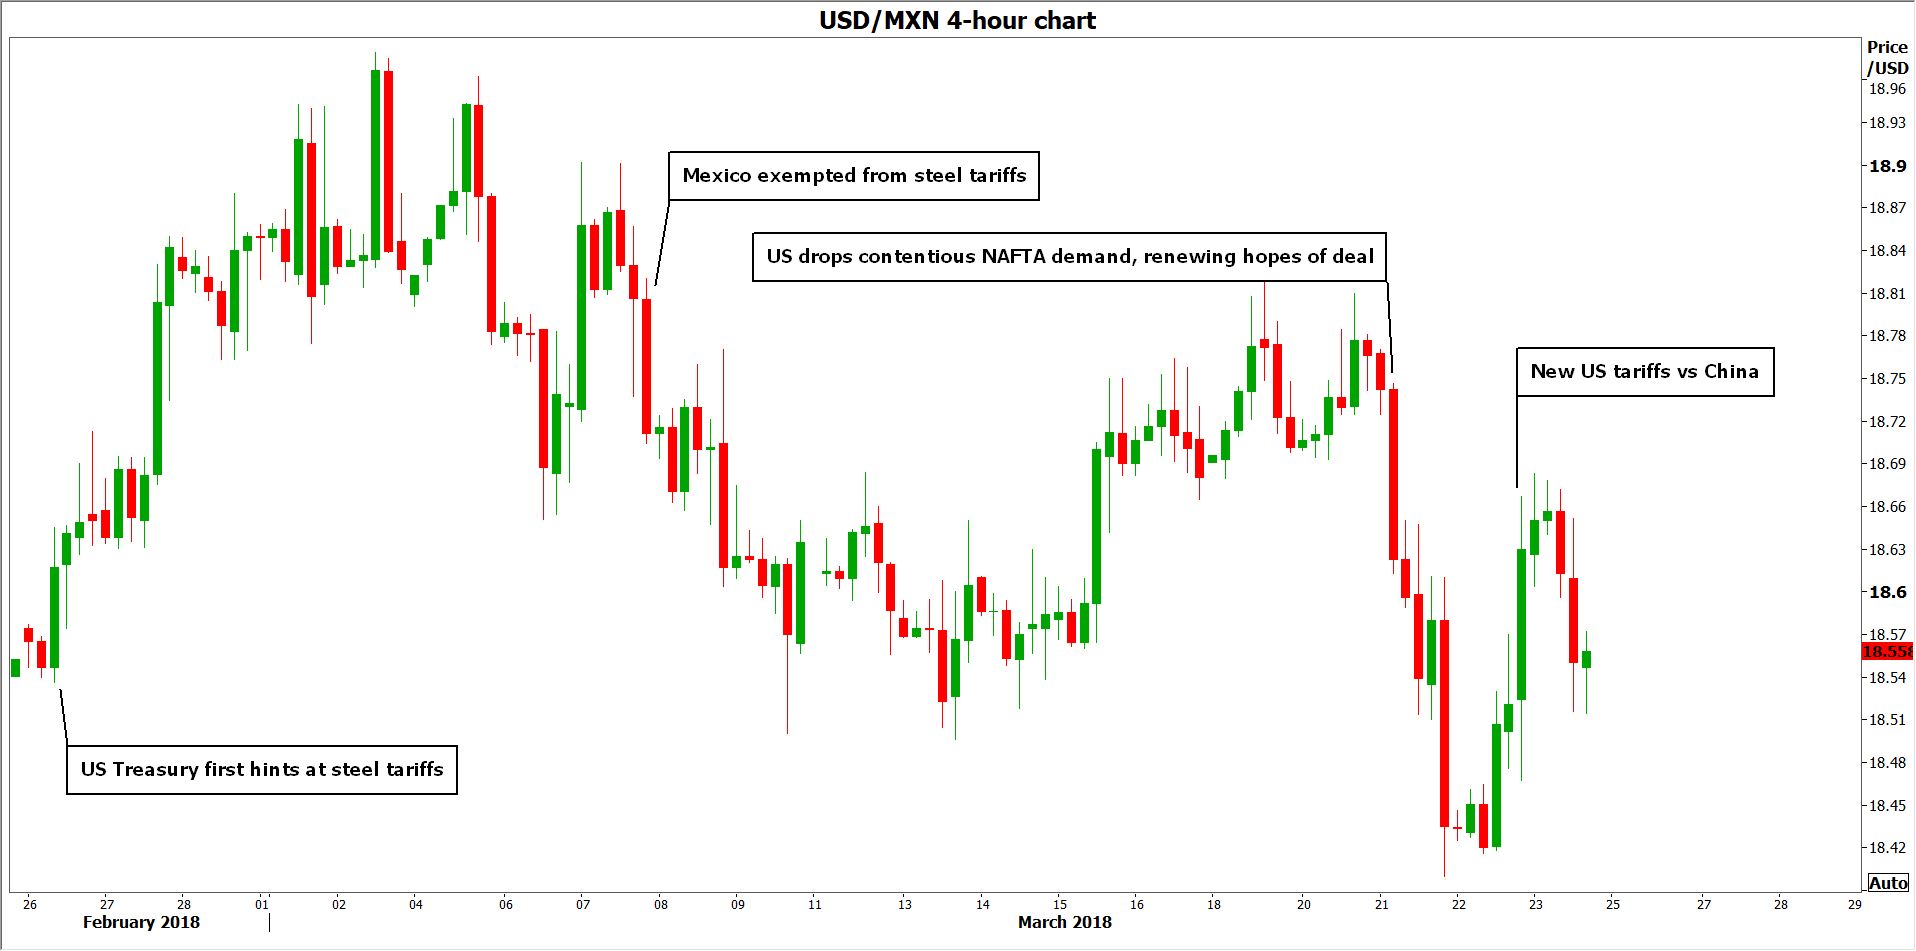
The Mexican peso, meanwhile, has practically become a liquid proxy for the NAFTA negotiations, rallying on signs of progress in the talks and tumbling when the likelihood of a successful deal is seen as declining. While the peso lost some ground in early March after the US announced its steel tariffs, it quickly recouped its losses after Mexico was exempted from those levies. Then, the currency gained further following reports the US will drop one of its most contentious NAFTA demands, which was a “thorn” in the talks.
Strikingly, the peso is higher against the euro and the dollar, both month-to-date and year-to-date. To be fair, the currency has also enjoyed some support from monetary policy, with the nation’s central bank hiking rates at both of its latest meetings in an effort to tame above-target inflation.
The next round of NAFTA negotiations is scheduled for mid-April, though no exact date has been announced. This is seen as a “make or break” round of talks, as it will probably be the last one before Mexico’s general election on July 1. According to media reports, all sides realize there needs to be a breakthrough before that date, as the elections will probably complicate and prolong the negotiations. The peso’s fortunes will likely be determined by whether these talks bear fruit; remember that nearly 80% of all Mexican exports go to the US.
Elliott wave Analysis: USDCHF and USDJPY Update
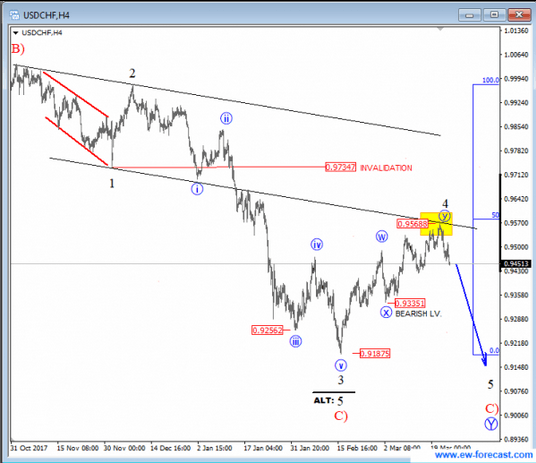
USDCHF is slowly and steadily turning to the downside, away from our interesting resistance zones near the 0.9570 region, which can be first evidence of a completed wave 4 correction, and for more weakness to follow into final wave 5 of C). That said, ideally a new five-wave drop is in the making which can target 0.9087 zone.
USDCHF, 4H
 USDJPY can be trading in final stages of a bigger bearish impulse, which we labelled as blue wave C of C. That said, recent correction within wave 4) unfolded as a clear EW triangle which later pushed price towards new lows. We now see price trading within sub-wave 5) of C, which can see support and limited downside near the 104.73-104.00 region. A latter rally in impulsive fashion to the upside can suggest a low in place.
USDJPY, 4H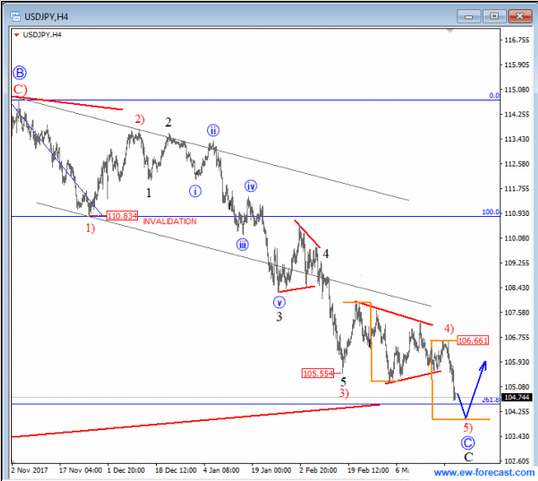
USDJPY Hits Fresh 16-Month Low; Bearish in the Short- and Medium-Term
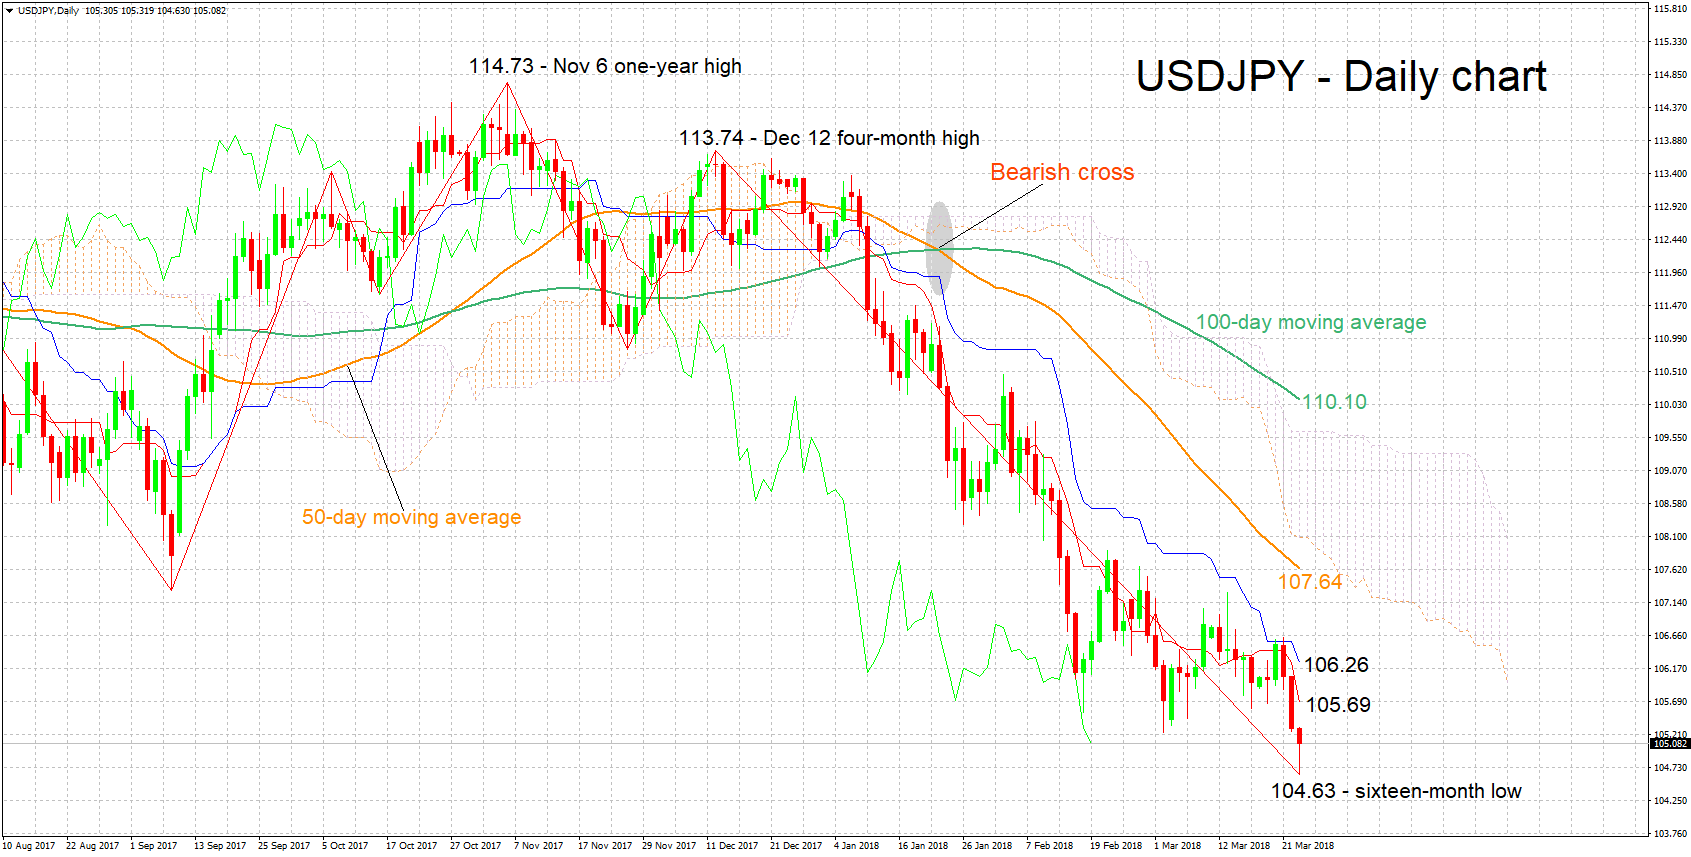
USDJPY has experienced considerable declines in recent days and in the bigger picture ever since reaching a four-month high of 113.74 on December 12; the pair has shed 7.6% since recording that peak. Earlier in Friday’s trading, USDJPY posted a 16-month low of 104.63.
The Tenkan- and Kijun-sen lines are negatively aligned, projecting a bearish short-term picture.
A more decisive break below the 105 handle would start to increasingly shift the focus to the area around the 103 level which was relatively congested back in 2016 and could provide support, while the 104 round figure above could also act as support before price action starts testing the area just mentioned. Even steeper declines would start bringing into view the 100 mark, a level that may hold psychological significance.
On the upside and in case the pair posts some gains, resistance might come around the current level of the Tenkan-sen at 105.69 and then the Kijun-sen at 106.26. If the range around these levels is overcome, the pair would start challenging the upper bound of the recent movement between roughly 105–108.
The medium-term picture is looking increasingly negative, with the pair further distancing itself to the downside from the 50- and 100-day moving average lines. In this respect and adding to the conviction for a bearish medium-term outlook, a bearish cross was recorded in late January when the 50-day MA moved below the 100-day one, while price action is also taking place below the Ichimoku cloud.
Overall, both the short- and medium-term outlooks are bearish at the moment.
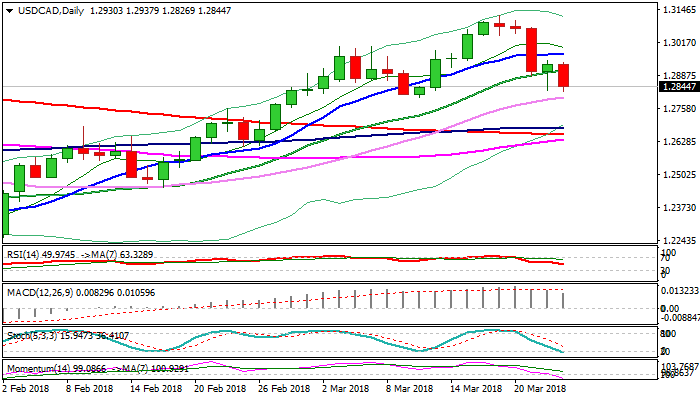
USDCAD – Loonie Rallies on Better than Expected Canada’s CPI Data
Canadian dollar rallied against its US counterpart on Friday, driven by better than expected Canada’s inflation data (Feb CPI y/y 2.2% vs 2.0% Jan; Core y/y 1.5% vs 1.4% f/c).
At the same time, Canada’s retail sales undershot forecasts (Jan m/m 0.3% vs 1.1% f/c), but without stronger negative impact on fresh bullish sentiment.
Fresh weakness probed again below cracked support at 1.2867 (Fibo 38.2% of 1.2450/1.3124 upleg) and retested Thursday’s spike low at 1.2829, signaling continuation of pullback from 1.3124 (19 Mar high).
Bearish momentum is building as south-heading 14-d momentum broke into negative territory, supporting further weakness.
Break below 20SMA (1.2909) which was cracked on Thursday but bears failed to close below, is bearish signal which will be reconfirmed by close below Fibo 38.2% support at 1.2867, for test of 1.2803 (12 Mar low, reinforced by rising 30SMA) and 1.2787 (50% retracement of 1.2450/1.3124).
Stronger bearish acceleration could travel to 1.2680 zone, where strong support is provided by weekly cloud base and converged weekly 200/20SMA’s.
Also, the pair is on track for strong bearish weekly close which could result in weekly bearish engulfing and generate strong reversal signal, as multi-week rally from 1.2249 (2018 low) shows strong signs of fatigues (weekly RSI turned south and slow stochastic reversed from oversold territory).
Res: 1.2907; 1.2948; 1.2971; 1.3000
Sup: 1.2803; 1.2787; 1.2707; 1.2680
Core Capital Goods Orders Roar Back in February
Durables orders rose 3.1 percent in February. After declining the past two months, core orders increased well above expectations and rose 1.8 percent. Even with the rebound, business spending looks to have slowed in Q1.
Core Capital Goods Orders on the Mend
Capital spending and output measures were notably weak in December and January, which has raised some doubts about the outlook for business spending despite all the euphoria surrounding recent tax changes. The state of business spending, however, looks much stronger following the February durable goods report.
Durable goods orders rose 3.1 percent in February, nearly double consensus expectations. While it is not unusual for total durable goods orders to miss so wide off the mark given notoriously large and volatile components like aircraft and defense items, February's miss can in large part be traced to a surprisingly strong increase in core capital goods orders. After two consecutive months of declines, expectations were for capital goods ex-aircraft and defense to rebound 0.9 percent, but orders bested even those high expectations and rose 1.8 percent.
The bounce-back in core orders parallels a rebound in manufacturing output as reported by the February industrial production report. In the January report, manufacturing production was reported to have stalled for two straight months. Manufacturing output jumped 1.2 percent in February, however, lending credence that today's gain in core capex orders has some weight behind it and is more than noise.
With two months of data in for Q1, we are able to get a better sense of equipment spending for the current quarter. Nondefense capital goods shipments, which feed into the GDP estimates for equipment spending, rose 1.2 percent in February. Currently for Q1, shipments are up at a 4.7 percent annualized rate, compared to 6.8 percent in Q4.
Hard and Soft Data Take a Step toward Convergence
For months now, we have written that the "hard" data on spending must converge with the sky-high readings of "soft" survey data. Business confidence, as measured by the NFIB Small Business Optimism index, has been at multi-decade highs, while the ISM manufacturing index sits at a 14-year high. Today's report helps to narrow the gap, but the recent trend in orders still looks soft relative to the breakneck pace registered last fall. With a decline the previous two months, core orders are increasing at just a 0.6 percent annualized pace the past three months, which is down from an 18 percent clip as recently as November.
All told, even with today's solid rebound in core orders, it is unlikely we will see a third straight quarter of double-digit increases in equipment spending. We currently expect growth in real equipment spending to moderate to about a 7 percent pace in first quarter, which still looks fairly solid in our view coming on the heels of the tremendous strength of the second half of last year.
Canadian Inflation Trends Firm again in February
Highlights:
- Year-over-year headline CPI growth rose to 2.2% from 1.7% in January
- Annual energy price growth accelerated but ex-food & energy price growth increased to 1.8% on a year-over-year basis from 1.5% in January.
- The Bank of Canada’s preferred ‘core’ measures ticked up to a 2% rate, on balance. CPI-trim and CPI-median both rose to 2.1% from 1.8% and 1.9%, respectively, and the CPI-common measure inched up to 1.9% from 1.8% in January
Our Take:
Year-over-year CPI growth bounced up to a 2.2% rate — the highest since October 2014 — after falling to 1.7% the prior month. A bounce-back in the headline measure was widely expected. The dip the prior month had more to do with unusually high prices in January a year ago than any slowing in underlying inflation trends. Of more interest to policymakers will be the tick higher in the ’core’ measures that generally all firmed in February. Excluding food & energy components, CPI is up 1.8% from a year ago vs 1.5% in January. The Bank of Canada’s preferred core measures edged above the 2% inflation target, on balance. The CPI-trim and CPI-median rose to 2.1% and the CPI-common rose to 1.9%. The numbers can be choppy on a monthly basis — and a portion of the January-February strength is probably tied to recent minimum wage hikes in Ontario. It is difficult, though, to argue that there hasn’t been some firming in underlying price growth. Indeed, by our calculation, the 6-month rolling average of month-over-month gains in the important CPI-trim and CPI-median measures — as well as ex-food & energy CPI — have been tracking closer to 2 1/2% over the last six months.
The economy is probably operating at if not somewhat beyond longer-run capacity limits currently. Inflation now seems to have ticked back up to the Bank’s 2% inflation target. Wage growth is modest but has been edging higher. And yet the overnight interest rate is still 175 basis points below the mid-point of the central bank’s assessment of its long-run neutral level. We expect policymakers to remain cautious about the pace of interest rate hikes in light of trade uncertainty and increased sensitivity of highly leveraged households to rate increases. We, nonetheless, still expect interest rates to grind gradually higher this year and next.
Canadian Retail Sales Edged Only Slightly Higher to Start the Year
Highlights:
- Retail sales rose 0.3%, falling short of expectations for an increase closer to 1%.
- Despite a modest gain, the increase was broadly-based with sales rising in 7 of 11 subsectors. Declines in motor vehicle sales and building supply stores provided the main offset.
- Gains in a number of sectors represented a rebound from declines in December.
- E-commerce sales were up just 15% from a year ago. That is down from the nearly 40% year-over-year increase recorded last January.
- Today’s data makes up the last sectoral release ahead of January GDP, which we expect rose by 0.1%. That remains consistent with our forecast for annualized growth of 1.9% in Q1/18.
Our Take:
The 0.3% increase in January’s retail sales fell short of expectations. That was largely due to a surprising decline in motor vehicle sales that went against earlier data showing an increase in unit auto sales. Excluding autos, retail sales rebounded by nearly one percent following a 1.7% decline in December. That confirms our expectation that the earlier dip reflected shifting holiday sales patterns rather than a pronounced slowdown in spending. Overall, sales during what has become an extended holiday shopping season looked quite healthy though growth didn’t match the heady pace seen a year ago.
Indeed, when factoring in today’s reported decline in motor vehicle sales, retail is off to a somewhat slower start to the year—certainly when compared to last January’s 2.6% increase in sales. We don’t want to put too much emphasis on one data point, but this does fit with our expectation that 2018 consumer spending growth won’t maintain last year’s pace. Rising interest rates and more trend-like job gains will be the main factors behind that slowing.
USD/CHF Mid-Day Outlook
Daily Pivots: (S1) 0.9461; (P) 0.9488; (R1) 0.9516; More...
No change in USD/CHF's outlook as it's staying in range of 0.9423/9568. Intraday bias remains neutral. As noted before, rebound from 0.9186 could still extend higher. But considering bearish divergence condition in 4 hour MACD, upside should be limited by 0.9626 key fibonacci level, to complete the rebound from 0.9186. Break of 0.9432 support will indicate near term reversal and turn bias to the downside for retesting 0.9186 low. Nonetheless, sustained break of 0.9626 will carry larger bullish implications.
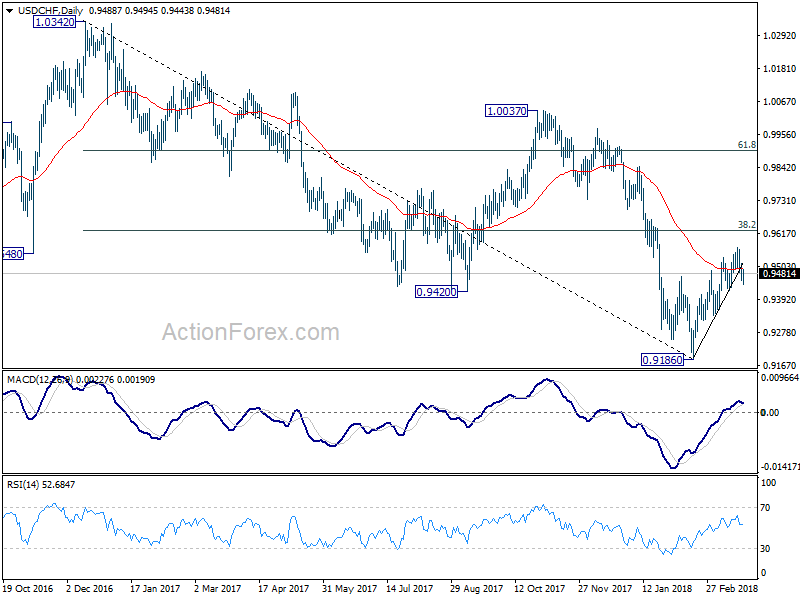
In the bigger picture, fall from 1.0342 is seen as a medium term down trend. Current development is raising the chance that it is completed. But there is no confirmation yet. Focus will now be back on 38.2% retracement of 1.0342 (2016 high) to 0.9186 (2018 low) at 0.9626. Sustained break there will add much credence to the case of trend reversal and target 61.8% retracement at 0.9900 and above. However, rejection from 0.9626 will maintain medium term bearishness for another low below 0.9186.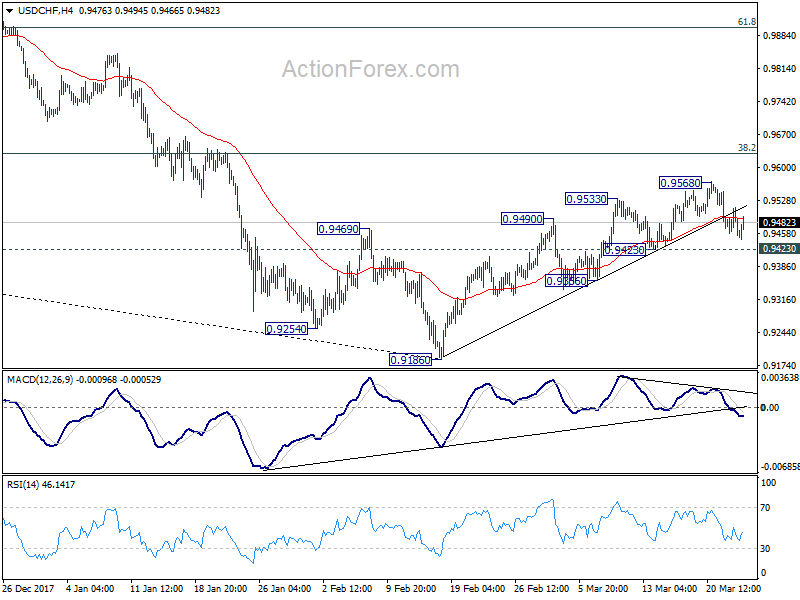
Canada: Core Inflation Hits the Bank of Canada’s Target in February
Consumer prices rose a faster-than-expected 2.2% year-on-year (y/y) in Canada in February (consensus was for 1.9%), up from 1.7% in January.
The acceleration in price growth was broad-based, with all major categories but food and clothing and footwear picking up speed in the month. The biggest gain year-on-year was in energy prices (up 5.3% from 2.4%), but ex-food and energy prices also accelerated to 1.8% year-on-year (up from 1.5%).
The Bank of Canada's core price measures showed a clear firming trend with the CPI-common moving up to 1.9% (from 1.8%), and both CPI-median and CPI-trim hitting 2.1% (up from 1.9% and 1.8% respectively). As a result, the average of the three measures rose to a hair above 2.0% (from 1.8%) in January.
Key Implications
After several months below 2%, inflation pressures have picked up and have moved on top of the Bank of Canada's target. As noted, the move higher appears broad-based, as evidenced by all three of the Bank of Canada's core measures, which aim to strip out idiosyncratic price movements.
The Bank of Canada's dovish tone of late will surely be challenged in light of today's robust core inflation numbers. Still, the Bank of Canada's inflation target is symmetric: a slight overshoot of 2% is no 'worse' than an undershoot, and it is possible that minimum wage gains are pushing core measures higher – an impact that should be discounted. All told, today's data does create the risk that the Bank of Canada moves sooner, but with downside risks to the economic outlook still elevated, this summer remains most likely to see the next policy interest rate hike.