
Sample Category Title
EUR/AUD Weekly Outlook
After some consolidations, EUR/AUD's rally extended to as high as 1.6054 last week and closed strongly. Initial bias is back on the upside this week. Current rise would target 61.8% projection of 1.5130 to 1.5976 from 1.5621 at 1.6130 first. Break there will target 100% projection at 1.6444 next. On the downside, break of 1.5857 support is needed to indicate short term topping. Otherwise, outlook will remain bullish in case of retreat.
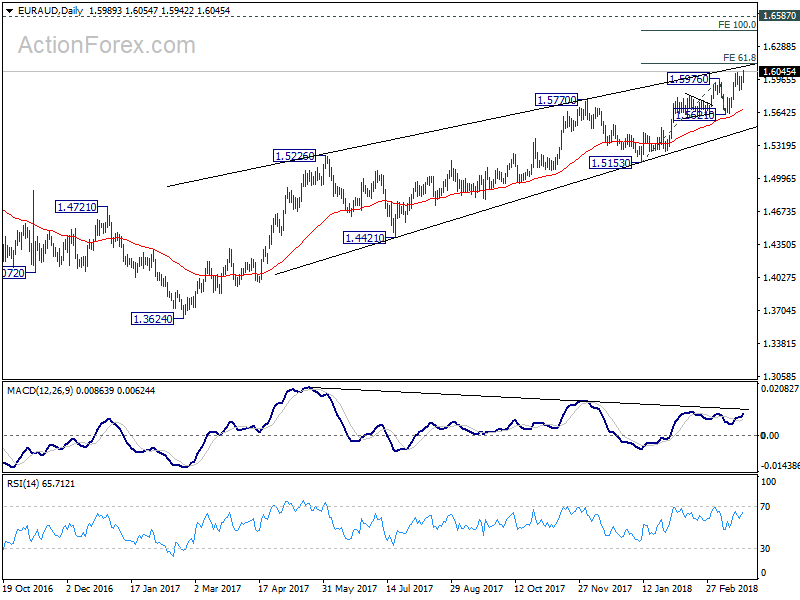
In the bigger picture, current development suggests that rise from 1.3624 is not completed yet. And it's still in progress for 1.6587 key resistance level. We'd be cautious on strong resistance from there to limit upside, on bearish divergence condition in daily MACD. But for now, break of 1.5621 support is needed to be the first sign of medium term reversal. Otherwise, outlook will stays bullish even in case of deep pull back.
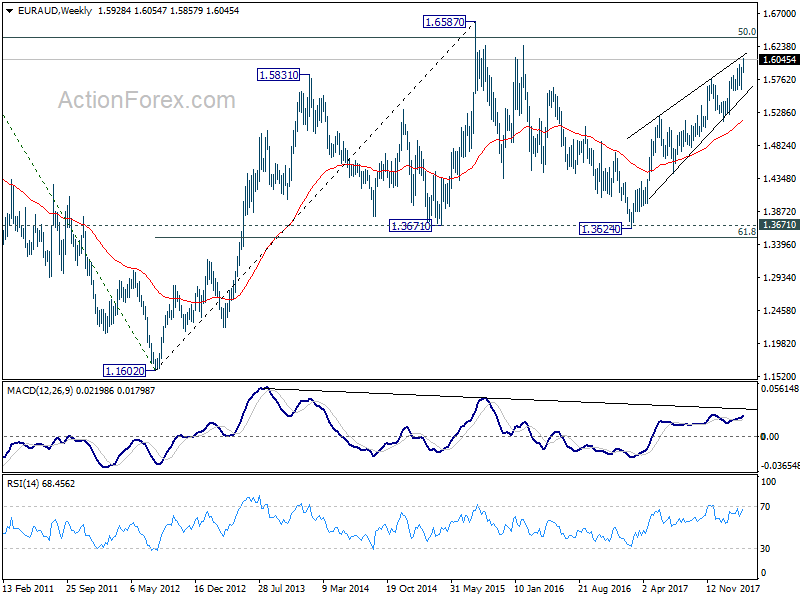
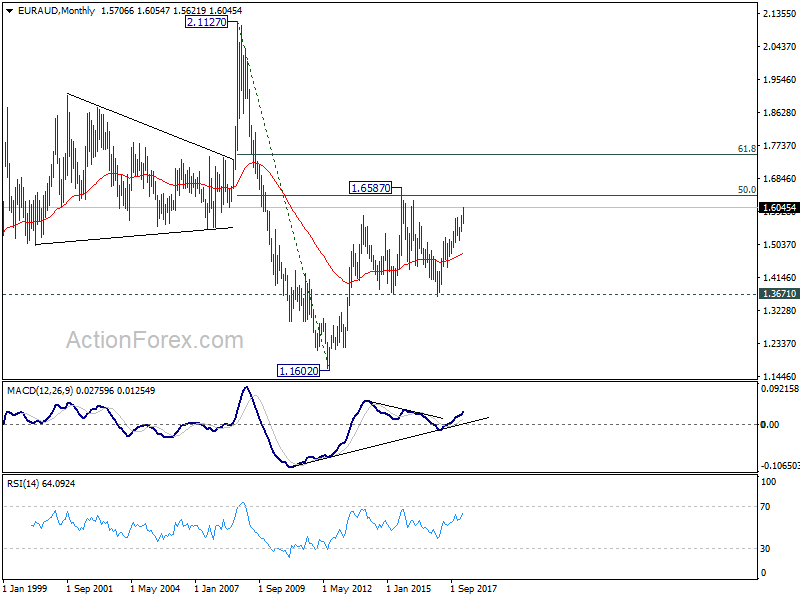
In the longer term picture, the rise from 1.1602 long term bottom (2012 low) isn't over yet. We'll keep monitoring the development but there is prospect of extending the rise to 61.8% retracement of 2.1127 to 1.1602 at 1.7488 and above. However, sustained trading below 1.3671 should indicate long term reversal and target 1.1602 long term bottom again.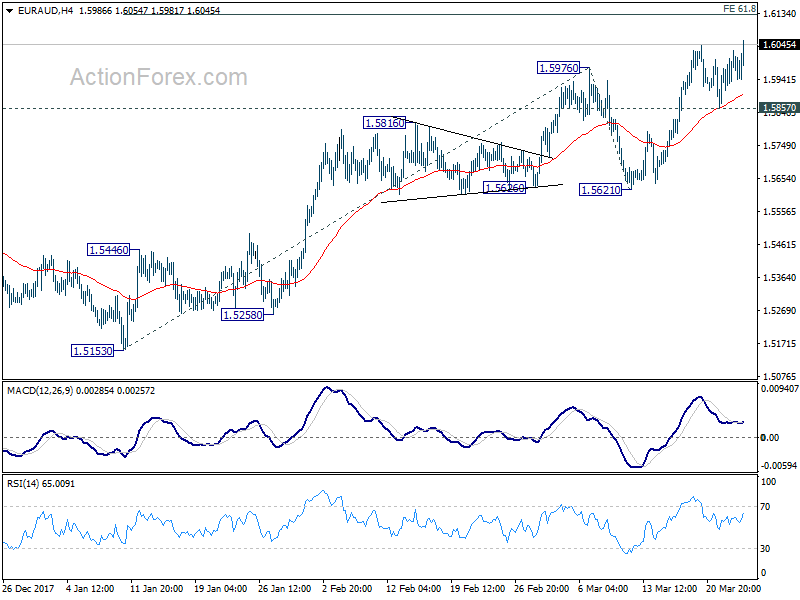

EUR/CHF Weekly Outlook
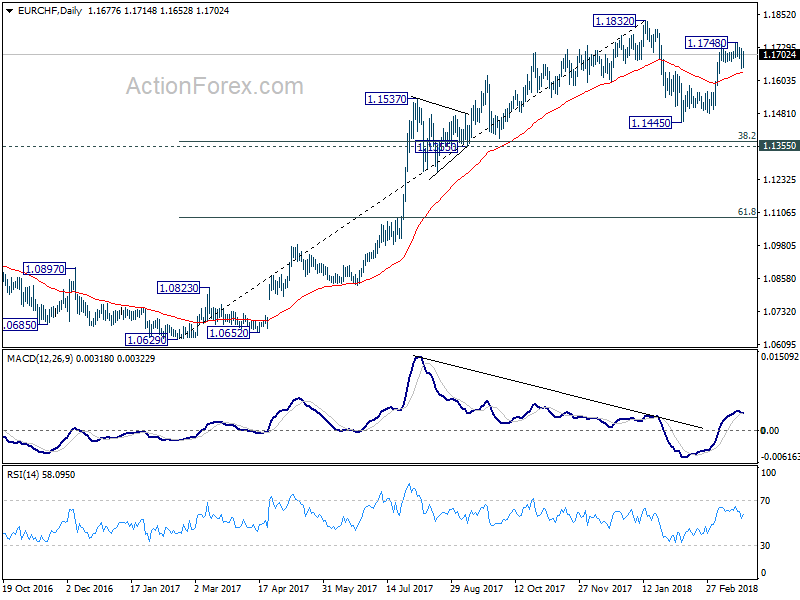
EUR/CHF dipped to 1.1649 last week but quickly recovered. Initial bias is turned neutral this week first. On the downside, below 1.1649 will affirm that case that corrective pattern from 1.1832 is extending with another falling leg. And, intraday bias will be turned to the downside for 55 day EMA (now at 1.1635). Sustained break will target 1.1445 support and possibly below. But we'd expect strong support from 1.1355 cluster support (38.2% retracement of 1.0629 to 1.1832 at 1.1372) to complete the correction and break up trend resumption. On the upside, above 1.1748 will bring retest of 1.1832 high instead.
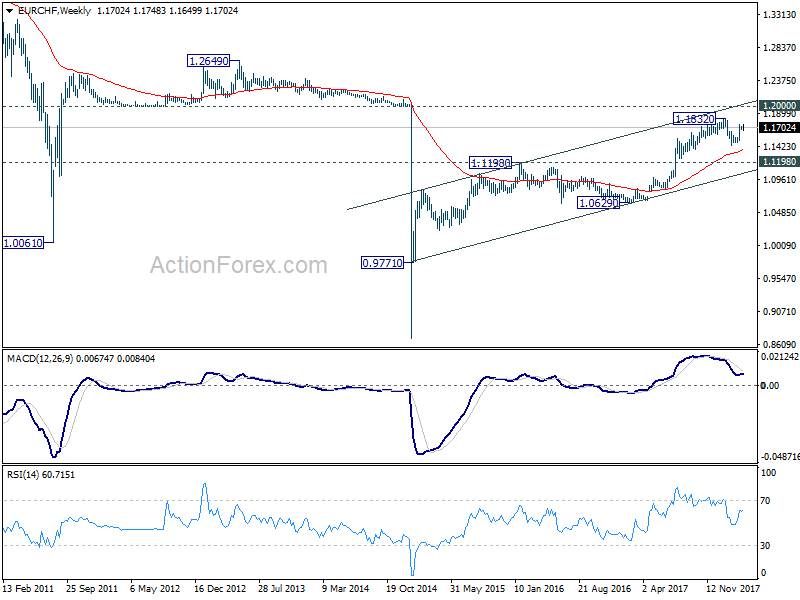
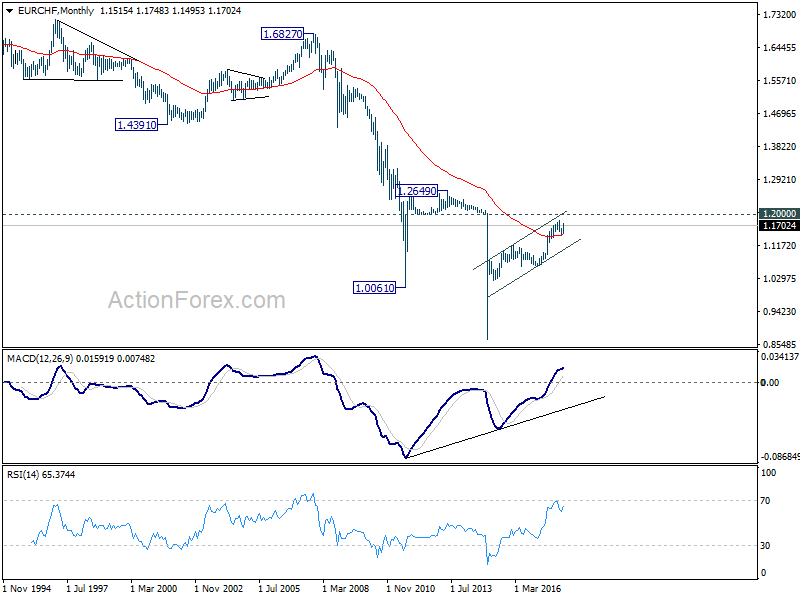
In the bigger picture, a medium term top should be in place at 1.1832 on bearish divergence condition in daily MACD. But there is no indication of long term reversal yet. As long as 1.1198 resistance turned support holds, we'd still expect another rise through prior SNB imposed floor at 1.2000.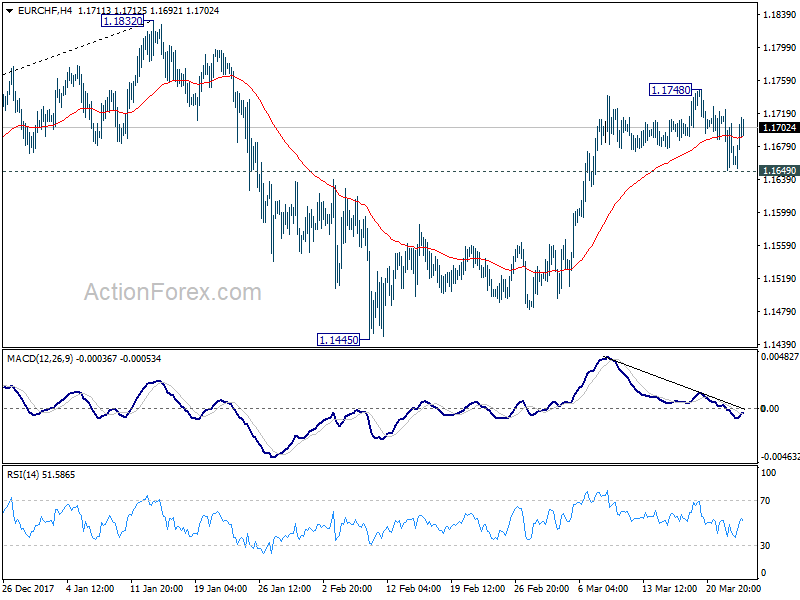
Global Stock Market Crashed, Dollar Tumbled after Episode 1 of US-China Trade War
Global stock markets suffered steep selloff last week as US President Donald Trump has finally declare the start of trade war with China. Dollar was under broad based pressure with the development, but it was only the second weakest one. Australian Dollar suffered most for it's close trade link to both countries. New Zealand Dollar ended as the third weakest, also for its trade link with China.
For Dollar, Fed's widely expected rate hike was not enough to give it any upside momentum. Firstly, Fed kept the forecast of total of three hikes in 2018 unchanged. Secondly, while GDP forecast for 2018 and 2019 were revised notably up, that for 2020 was left unchanged. It indicated Fed officials don't expect Trump's tax cut to have a long lasting effect on the economy. At the same time, core inflation forecast for 2019 and 2020 were revised up by 0.1% only.
Suggested readings on FOMC:
- Powell Starts With Modest Hawkish Shift
- FOMC Review: Only Slightly Steeper Rate Path Due To Trumponomics
- The Fed Remains Resolute, Even in the Face of Softer Data
- FOMC Projects Two More Rate Hikes This Year, Followed By Three In 2019
Yen gained a lot towards the end of the week on risk aversion. But it was Canadian Dollar that's the strongest. The Loonie was firstly supported by positive news on NAFTA renegotiation, as US dropped one of the toughest protectionist demand. That is, the request for vehicles made in Canada and Mexico for export to the US contain at least 50% US content ad dropped. Secondly, Canadian inflation data came in stronger than expected. Both boosted the chance of another BoC hike in first half.
Sterling was the second strongest one as UK has finally secured the Brexit transition deal with EU. However, it failed to extend the gains after BoE rate decision. BoE left bank rate unchanged at 0.50% as widely expected. Two known hawk Michael Saunders and Ian McCafferty came out dissenting and voted for rate hike. But there was a lack of acknowledgement of progress in Brexit negotiation. While BoE could still hike in May, this week's development didn't make it more likely to do so.
Suggested readings on BoE:
- BoE: Rate Hike in May by the MPC Still in Play
- BoE Still on Track for a May Hike
- BOE Voted 7-2 to Leave Bank Rate Unchanged at 0.50%
US-China trade war starts, more to come
On Thursday, Trump announced to impose tariffs on USD 50-60b of Chinese imports, as follow up action to the so called Section 301 intellectual property investigation. The targeted measure on China was seen by the world as declaring trade war. China's reactions were so far retrained. On Friday, China's Ministry of Commerce announce retaliation measure to the 232 steel and aluminum tariffs of the US. And that include imposing tariffs on USD 3b of US imports in two stages.
For now, the announced measures by both country would have little impact on each other's economies, as seen by economists. But firstly, it should be remembered that the 232 steel and aluminum tariffs were across the board. China's counters measures to something that's target to itself could be totally different. So far, there was only verbal complaints regarding the Section 301 tariffs, China is holding their cards to chest. Secondly, there are generally worries that it's now only Season 1, Episode 1 of trade. More is to come and the situation will only turn from bad to ugly.
Suggested readings on trade war:
- U.S. and China Fire Shots Across The Tariff Wall
- Which American Industries Are Vulnerable to Tariff Retaliation?
- Moderate Chinese Retaliation – But Keeping The Powder Dry
Talking about 232 steel and aluminum tariffs, Trump approved temporary suspension to Argentina, Australia, Brazil, Canada, Mexico, EU and South Korea, till May 1, 2018. We'll repeat here that adding together, these seven countries/bloc contributed to 52.7% of steel import to the US in 2017. And, two of the US's closely allies in east Asia, Japan and Taiwan, were not exempted.
DOW resuming medium term correction, heading to 22351.24.
DOW's steep selloff of Thursday and Friday now clearly indicates that the correction from 26616.71 high is resuming. A few weeks ago, after DOW recovered from 23360.29 extended despite solid US CPI reading, we said that the worst in stocks were over. That's indeed not too wrong as the worst about Fed tightening was over. This was also reflected in stock's reaction to Fed's rate hike last week. And remember, Fed did signal it's on track for three hikes this year, and three next. But then the worst is indeed not over yet as trade war came to haunt investors. Judging from current momentum, the markets took the negative impact of trade war much more badly than Fed tightening.
Anyway, there is little doubt that the correction from 26616.71 record high is extending lower. The base case for us is that it's correcting the up trend from 2016 low at 15450.56 only. That is, deeper fall would be seen through 55 week EMA (now at 23000.11) to 38.2% retracement of 15450.56 to 26616.71 at 22351.24. Strong support would likely be seen there to bring rebound. Within this base case, the worse scenario is that DOW would hit 50% retracement at 21033.63 before bottoming. Both scenarios were not too bad.
 However, for now, we cannot rule out the chance that it's a correction of a larger degree. And looking at the monthly chart, the worst case is that DOW is correcting the decade long up trend from 6469.95, March 2009 low. That is, in this case, stocks are correcting all the advancements since Barack Obama took office in January 2009. This is not our preferred case for the moment. But if it turns out to be true, DOW would head to 38.2% retracement of 6469.95 to 26616.71 at 18920.64 before bottoming. This fibonacci level is close to 18351.36 support and 55 month EMA (now at 18724.27).
 Treasury markets didn't care much
Reactions in the bond markets last week were relatively muted. 10 year yield attempted to take out recent resistance at 2.943 after FOMC. But then reversed the gains on Thursday. Nonetheless, TNX stayed in range between 2.80 and 2.95. While deeper fall could be seen, we're expecting strong support from 38.2% retracement of 2.034 to 2.943 to contain downside.
 In the biggest picture, it now looks like there won't be any momentum to push TNX through 3.036 key resistance in near term. But, it should be remembered US debt to China is at USD 1.17T as of January 2018. That's 19% of the USD 6.26T in US debts held by foreign countries, largest among them. If dumping US debt is part of China's retaliation measures, then this 3.036 resistance would be nothing.
 Dollar index range bound, thanks to weak Euro
While Dollar was the second weakest major currency last week, next to Aussie, the dollar index didn't perform too badly. That's mainly because Euro was strong neither. Outlook stays bearish with 91.01 support turned resistance intact. Based on current development, the falling 55 day EMA could finally press dollar index through 88.25 low to resume the down trend from 103.82. In that case, dollar index would try to draw support from 61.8% retracement of 72.69 to 103.82 at 84.58 to form an important bottom.
 USD/JPY Weekly Outlook
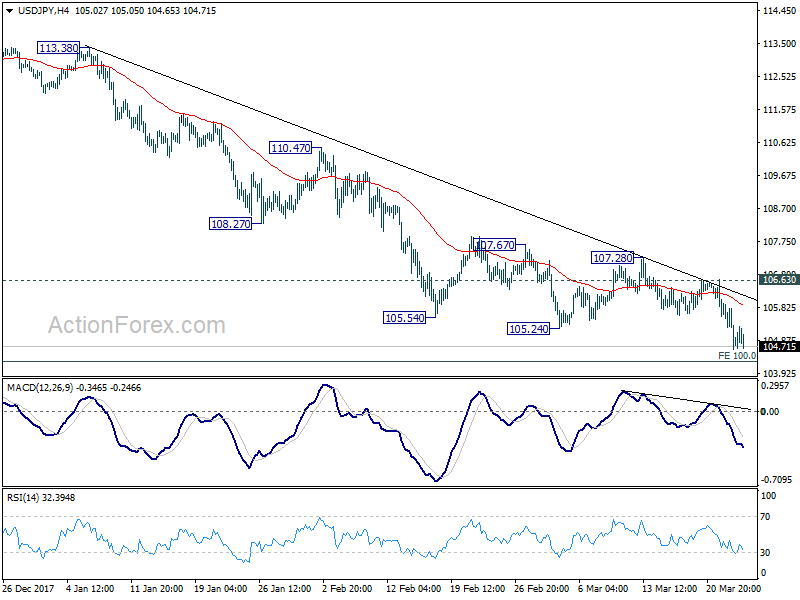
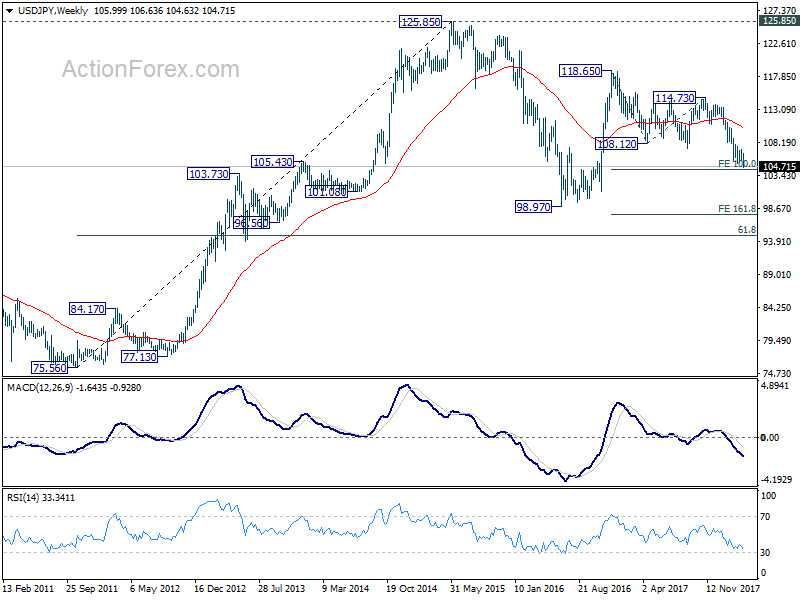
USD/JPY dropped to as low as 104.63 last week and the break of 105.24 support confirms resumption of decline from 114.73. Such decline is viewed as the third leg of the medium term pattern from 118.65. Initial bias remains on the downside this week for 104.20 projection level first. Sustained break there will pave the way to 98.97 (2016 low). On the upside, break of 106.63 resistance is needed to indicate short term bottoming. Otherwise, outlook will remain bearish in case of recovery.
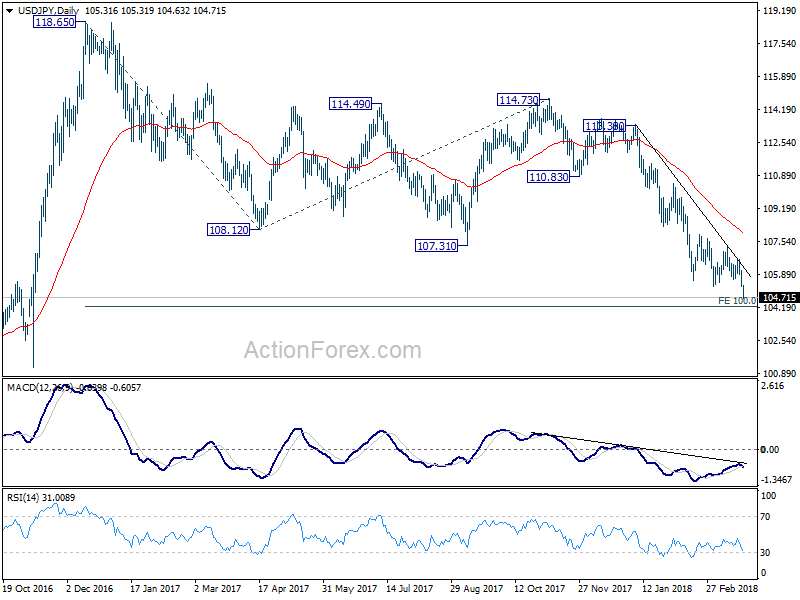
In the bigger picture, medium term down trend from 118.65 (2016 high) is still in progress and extending. Build up in downside momentum argues that it might be extending the whole corrective pattern from 125.85 (2015 high). 100% projection of 118.65 to 108.12 from 114.73 at 104.20 will be a key level to watch as firm break there could bring downside acceleration. And in that case, 98.97 key support level (2016 low) would at least be breached. This bearish case will now be favored as long as 108.12 support turned resistance holds.
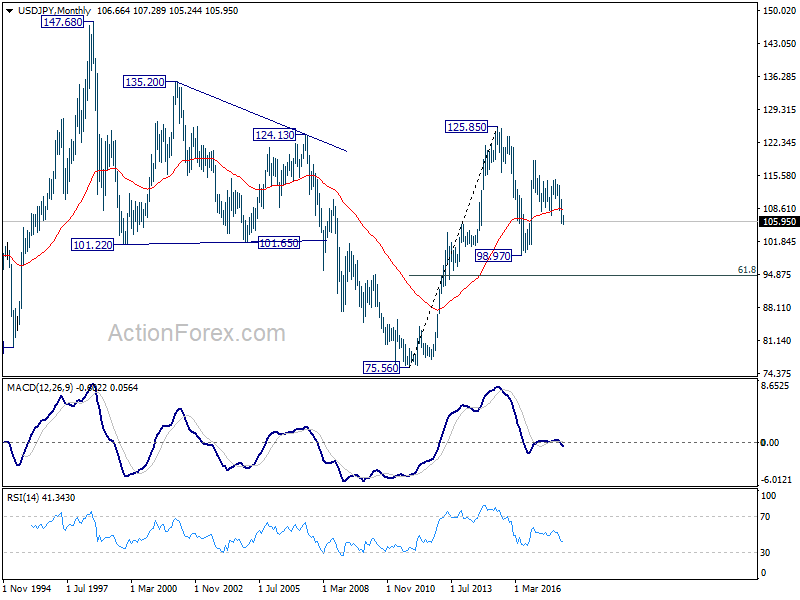
In the long term picture, the rise from 75.56 (2011 low) long term bottom to 125.85 top is viewed as an impulsive move, no change in this view. Price actions from 125.85 are seen as a corrective move which could still extend. In case of deeper fall, downside should be contained by 61.8% retracement of 75.56 to 125.85 at 94.77. Up trend from 75.56 is expected to resume at a later stage for above 135.20/147.68 resistance zone.
Summary 3/26 – 3/30
Monday, Mar 26, 2018
[php_everywhere instance="1"]
Tuesday, Mar 27, 2018
[php_everywhere instance="2"]
Wednesday, Mar 28, 2018
[php_everywhere instance="3"]
Thursday, Mar 29, 2018
[php_everywhere instance="4"]
Friday, Mar 30, 2018
[php_everywhere instance="5"]
U.S. and China Fire Shots Across The Tariff Wall
Highlights
- The U.S. administration announced a 25% ad valorem tariff on at least US $50 billion in annual Chinese imports, targeting aerospace, information and communication technology, and machinery. The tariffs could take effect in 15 days' time.
- We estimate that U.S. inflation could rise by 0.1 to 0.2 percentage points above our baseline forecast. This assumes that the tariffs proportionately target the three main product categories. The impact could be higher if the tariffs are concentrated on information and communication products. The adjustment to the new tariffs could shave about 0.1 percentage points off growth annually, for a cumulative peak level impact on economic activity of 0.2% after 5-qtrs relative to the baseline.
- Direct economic impacts from tariffs are rarely the main factors of consideration. Indirect effects are much harder to gauge and can quickly amplify the economic impacts.
- China has simultaneously announced tariffs on U.S. food and scrap aluminum, targeting $3 billion in annual U.S. exports. The Ministry of Commerce noted that these tariffs are in response to the previously announced steel and aluminum tariffs. China may yet produce another set of retaliatory tariffs in response to recent developments in the weeks to come.
- Ultimately, this tit-for-tat strategy is to the detriment of both economies. The hope is that tariffs are being used as a tactical approach to force a dialogue regarding the continuous violation of intellectual property rights of U.S. firms that operate in China. As such, it's not yet certain if the announced tariffs will come into effect. The conciliatory tone of Chinese authorities and the willingness of the U.S. administration to continue with dialogue are positive signs that a further escalation of a trade war can be averted.
The U.S. administration has gone from targeted tariffs on solar panels, washing machines, steel, and aluminum to a 25% ad valorem tariff on at least US $50 billion in annual imports from China. The latter followed the conclusion of a Section 301 investigation that China's actions have violated the intellectual property rights of U.S. firms.1 Although the specific details are expected to be announced within the next fifteen days, focus has been placed on the imports of aerospace, information and communication technology, and machinery. In addition to the tariffs, the U.S. will file a trade dispute with the WTO and will likely impose investment restrictions on Chinese firms that seek to acquire sensitive technology.2
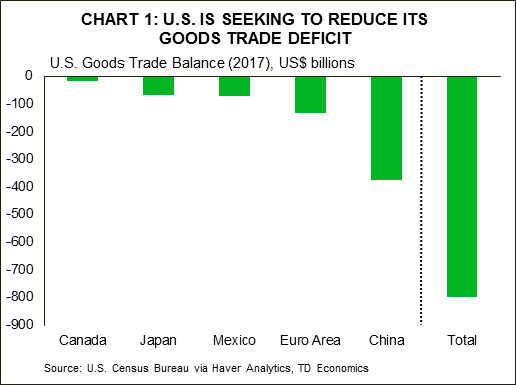
This announcement does not come as a surprise. The U.S. administration has been very vocal about its displeasure with the size of its trade deficit, and has singled out China as a major contributor (Chart 1). The U.S. trade deficit with the world was estimated at about US $800 billion in 2017, and its deficit with China was the largest at $375 billion. Moreover, the targeted import categories are ones China hopes to gain greater global market share, as it works to move the manufacturing sector up the value-chain over the next decade.3
 As widely anticipated, China followed up with its own threat to levy tariffs against U.S. goods in retaliation for steel and aluminum tariffs that take effect today. The Ministry of Commerce announced 15% tariffs on U.S. steel pipes, fruit, wine and other products, and a 25% tariff on pork and pork products, and recycled aluminum.4 This hits about $3 billion in U.S. goods on an annual basis. More specifically, these tariffs target U.S. food exports of fresh fruit, dried fruit and nuts, wine, denatured ethyl alcohol, and American ginseng.
The $3 billion retaliatory tariffs by China may serve three purposes. First, it's a credible shot across the bow from a country that has retaliated in the past to unilateral, U.S.-imposed tariffs. Second, the relatively small size of their initial tariff response could signal a willingness to move forward with dialogue. On that note, the U.S. administration also appears willing to continue to negotiate issues concerning U.S. intellectual property. Third, noticeably absent from China's tariff list are more politically sensitive items such as soybeans, sorghum, and airplanes, all of which are top U.S. exports to China. The Chinese government may be holding back on these initiatives to ensure leverage. In the event that dialogue fails, we may yet see a second round of Chinese tariffs launched on American industries in response to the latest initiatives by the U.S. administration.
So, although the intent to levy tariffs has now officially been announced by both parties, it's still unclear the extent to which action will be taken. For example, since the steel and aluminum tariffs announced fifteen days ago, suspensions have been granted to Argentina, Australia, Brazil, Canada, Mexico, the European Union, and South Korea until at least May 1, 2018.5 As evidence of the tactical play of U.S. initiatives, open-ended exemptions initially granted to Canada and Mexico have now been given the same deadline, no doubt to expedite NAFTA resolution.
Perhaps the greatest threat at this stage to the economic outlook is not from the direct economic feedthrough of tariffs to prices, jobs and output, but the possible erosion of business confidence from an ever-shifting playing field. The rapid-fire of U.S. tariff measures coupled with intensification in stock market and currency volatility certainly muddy the business climate and economic outlook.
Potential Economic Impacts
Along this vein, nailing down precise estimates of the economic impact of the new U.S. tariff announcement is difficult given the lack of specificity on Chinese products. However, we do have enough information to come up with some broad strokes (see Box 1 for methodology).
The U.S. imported about $506 billion in goods from China last year, equivalent to 21.6% of its total imports from the world. About half were imports from the aerospace, information and communication technology. The $50 billion of imports targeted is 9% of total imports from China, and 2.1% of total U.S. imports from the world. In isolation, this would not have a large direct economic impact on the U.S. economy. However, U.S. supply chains depend upon Chinese produced goods, so the indirect effects could materially boost the estimated impacts presented below, particularly if the tariffs are concentrated in the information and communications technology sector (Chart 3). In addition, these tariffs are coming on top of the steel and aluminum tariffs, and it's the layering of cost pressures through supply chains that bring a greater degree of forecast uncertainty. Below, we estimate only the most recent announcement, and the steel and aluminum impacts can be found here.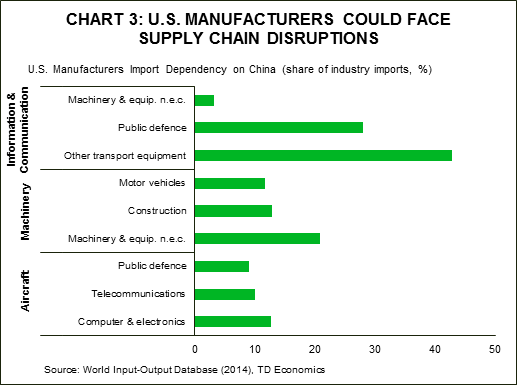
Price impact (inflation): The tariffs target largely investment goods, which are amortized over time so are likely to have a subdued response on the medium-term inflation outlook. Overall, our analysis suggests that the announced U.S. tariffs could boost annual inflation by 0.1 to 0.2 percentage points.
Growth impact (real GDP): Higher import prices could act to slow economic activity as U.S. industries dependent upon affected Chinese suppliers adjust. The impact on annual growth could average about -0.1 percent, for a cumulative level shock to U.S. real GDP of about -0.2% after 5-qtrs relative to baseline. After the initial adjustment period, a rebound in economic activity begins.
The countervailing duties announced by China targeting about $3 billion in annual U.S. exports are not expected to have a material impact on U.S. economic activity.
Layering these tariff impacts on top of our impact estimates of the aluminum and steel tariffs, we anticipate that the tariffs announced over the past two weeks combined could add an additional 0.2 percentage points to annual inflation.
Spillovers to other nations: The imposition of tariffs further elevates economic policy uncertainty globally. This could slow business investment, global trade, and exacerbate financial market volatility. Moreover, although the details are still forthcoming, integrated global supply chains all but guarantee that other major U.S. trade partners could face collateral economic damage from these tariffs. The U.S. is likely to pressure Canada and Mexico to limit the amount of Chinese goods that leak across its Northern and Southern borders that are tariff free. This may result in additional country of origin restrictions imposed as part of a revised NAFTA agreement.
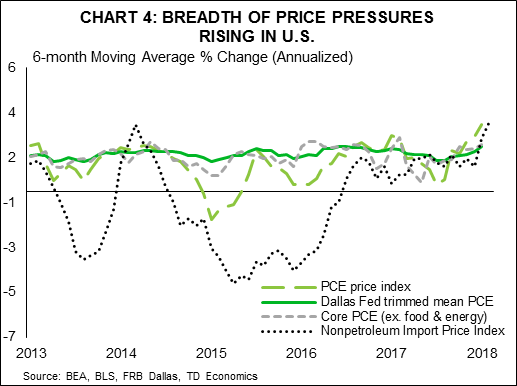
Monetary policy implications: The timing could not be worse for the Federal Reserve. The U.S. economy is already starting to see inflationary pressures build across various measures, and the risks are further elevated by fiscal stimulus and tariffs (Chart 4). A broadening out of price pressures could give the Federal Reserve more conviction to remove monetary stimulus. Although a 0.2% shock to the price level after 12-qtrs in isolation is not sufficient to prompt the fed to raise rates at a faster pace, it is the stacking up of price pressures from multiple sources that is a greater concern.
 U.S. dollar (real effective): The U.S. dollar could see some slight upward pressure if price pressures materialize sufficiently to spur the Fed to raise rates by an additional 25 basis points. More likely, flight to safety sentiment tends to drive near-term funds into the greenback and U.S. Treasuries.
Impact on China expected to be small
China's efforts to rebalance its economy over the last few years have helped make it less dependent on exports. In fact, exports as a share of nominal GDP has fallen to 18% in 2017 from a peak of 35% in 2006. Over that same period, China's economy has shifted towards more domestic services, with tertiary industries rising to 52% of nominal GDP last year, up from 42% in 2006.
That said, if the tariffs do indeed result in a material decline in exports (assuming limited leakage into the U.S. through other trade partners), a decline in exports could still work to shave about 0.1 percentage points off of annual Chinese GDP growth, and may lead to domestic job losses. Any escalation from here could force Chinese authorities to delay plans to address high debt levels that have elevated financial stability risks. A return to investment heavy, credit driven growth would only act to exacerbate these concerns.
Next steps and Risks to the Global Economy
The relatively subdued response of Chinese authorities and the willingness of both sides to engage in dialogue to resolve trade disputes offer some encouragement that an all-out escalating global trade war can be averted. Chinese authorities have recently voiced a more conciliatory tone on intellectual property, citing an ongoing commitment to open its economy to foreign investment without the requirement for firms to share their intellectual property with domestic industries.
Nevertheless, this latest announcement by the U.S. administration could be followed up by more targeted action. President Trump said that he would like Chinese authorities to reduce its trade deficit with the U.S. by $150 billion. Moreover, Congress is contemplating reducing visa issuance to Chinese students. Further escalation could see more potent Chinese retaliation, with detrimental knock-on effects to the U.S., Chinese, and global economy.
Any economic text book, or general common sense, argues that both economies will be on the losing end of this trade war. But, this isn't purely about economics. It's politics. Unintended consequences can easily emerge in this game of chicken. For the U.S., this may come in the form of unwinding the goodwill to business confidence and investment that previously stemmed from tax cuts. Having more cash to invest doesn't equate to a willingness to invest if the landscape becomes uncertain and shifts too quickly. For global trade partners, collateral damage can certainly weigh on the synchronous economic upturn that was established last year. For emerging markets, uncertainty can embed greater bouts of financial market volatility, with capital seeking safety and thereby jeopardize growth in these vulnerable markets.
End Notes
- The full text of the findings of the Section 301 investigation can be found here: https://ustr.gov/sites/default/files/Section%20301%20FINAL.PDF
- Section 301 Fact Sheet published on March 22, 2018. https://ustr.gov/sites/default/files/USTR%20301%20Fact%20Sheet.pdf
- The "Made in China 2025" plan (published in 2015) has been cited as a key economic planning document for China that the U.S. uses as a guide for which Chinese industries to closely monitor for U.S. intellectual property rights violations. It outlines China's strategy to innovate in its manufacturing sector to the extent that 40% of core components are produced domestically by 2020 and 70% by 2025. It focuses on the entire manufacturing supply chain, not just innovation, and promotes both traditional and service industries. The top 10 sectors targeted are: New advanced information technology; 2) Automated machine tools & robotics; 3) Aerospace and aeronautical equipment; 4) Maritime equipment and high-tech shipping; 5) Modern rail transport equipment; 6) New-energy vehicles and equipment; 7) Power equipment; 8) Agricultural equipment; 9) New materials; 10) Biopharma and advanced medical products. Source: Center for Strategic and International Studies. https://www.csis.org/analysis/made-china-2025
- WSJ Article outlining China's response to the steel and aluminum tariffs: https://www.wsj.com/articles/china-unveils-retaliatory-tariffs-on-3-billion-worth-of-u-s-goods-1521767240
- Full Whitehouse statement: https://www.whitehouse.gov/briefings-statements/president-trump-approves-section-232-tariff-modifications/
BoE: Rate Hike in May by the MPC Still in Play
CPI inflation in the United Kingdom fell from 3.0 percent in January to 2.7 percent in February, which could compel the Monetary Policy Committee (MPC) to remain on hold for the foreseeable future. But the labor market and the broader economy appear to be performing well, and the MPC has sounded more hawkish in the past month or so. We look for it to hike rates 25 bps at its next policy meeting on May 10.
The MPC at the Bank of England (BoE) decided at this week's policy meeting to maintain its main policy rate at 0.50 percent, which was widely expected (Figure 1). The U.K. government mandates that the BoE hit an inflation target of 2 percent over the medium term. As shown in Figure 2, the overall rate of CPI inflation has exceeded 2 percent continuously over the past 12 months. The surge in CPI inflation last year reflects, at least in part, the sharp depreciation of the British pound in the aftermath of the Brexit referendum in June 2016. But sterling has stabilized over the past year, and CPI inflation is beginning to recede back toward target. Everything else equal, the MPC would want to remain on hold in coming months to watch the incoming price data.
 But everything else is not necessarily equal. Data released this week showed that the labor market is doing quite well at present. Specifically, payrolls rose by 168,000 between October and January, which was much stronger than most analysts had expected. The strong payrolls number helped to push the unemployment rate down to 4.3 percent, the lowest rate in 42 years. The strength in the labor market has caused earnings growth to trend higher in recent months (Figure 3). Higher earnings growth could raise unit labor costs, which could slow the return of CPI inflation to the BoE's 2 percent target.
 Furthermore, it appears that the economy continues to expand at a reasonable rate in the first quarter. Data released two weeks ago showed that industrial production (IP) jumped 1.3 percent in January relative to the previous month. Although overall IP was pushed higher in January by a one-off surge in the mining and quarrying sector, output in the factory sector rose for the ninth consecutive month. In addition, real retail sales shot up 0.8 percent on a sequential basis in February, although the year-over-year rate of spending growth remains rather lackluster (Figure 4).
 The MPC surprised market participants at its last policy meeting in early February when it said that "the UK economy has only a very limited degree of slack," and that "monetary policy would need to be tightened somewhat earlier and by a somewhat greater extent over the forecast period" than previously anticipated. In its March policy statement the MPC reiterated its view that spare capacity will be used up by the end of next year. Although the MPC voted 7-2 to keep rates on hold this week, the two dissenting members of the committee presumably voted to hike rates.
A few weeks ago we brought forward our expectation of another MPC rate hike, which we had originally penciled in for the August policy meeting, to May due to the more hawkish MPC rhetoric and the incoming data flow. We currently expect that the MPC will then remain on hold until early 2019, but we acknowledge that there is a reasonable probability that it could hike rates yet again later this year. As the MPC itself noted, a major uncertainty facing the U.K. economy remains the Brexit negotiations. If this uncertainty should start to weigh on growth later this year, then the MPC likely will remain on hold after its expected rate hike in May.
Weekly Economic and Financial Commentary: Fed Rate Hikes Remain on Path
U.S. Review
Fed Rate Hikes Remain on Path
- The Fed raised the federal funds rate one quarter of a percentage point to 1.75 percent on Wednesday in a widely expected move, despite less-than-stellar economic data reported so far in Q1. Looking further ahead, seven Fed members now expect four or more rate hikes in 2018, three more than did in December.
- The U.S. current account deficit widened in Q4 to a nine-year high of $128.2 billion, with expectations of further widening this year as the dollar weakens. Durable goods orders rose 3.1 percent in February, much stronger than the consensus 1.6 percent estimate following a weak prior two months.
Fed Rate Hikes Remain on Path
In a somewhat quiet week for economic indicators, the leading story was clearly the FOMC's decision to raise the federal funds rate. The Fed raised the upper bound limit one quarter of a percentage point to 1.75 percent on Wednesday in a widely expected move, despite less-than-stellar economic data in Q1. Business fixed investment and household spending moderated from Q4, the policy statement acknowledged, but an upgrade to labor market conditions encouraged the FOMC. The decision to continue rate hikes amid softer economic data affirms the Fed's confidence in this economy's underlying strength and its determination to normalize rates. Looking further ahead, seven Fed members now expect four or more rate hikes in 2018, three more than did in December. A majority of Fed members now expect three hikes in 2019, up from two hikes in December. We expect economic growth to continue building momentum, and look for three more hikes in 2018, followed by two additional increases in 2019.
The U.S. current account deficit widened in Q4 to a nine-year high of $128.2 billion. The entire deficit comes from the goods sector, with a $214.3 billion deficit, which was partially offset by a $60.4 billion surplus in international services trade. Foreigners made $54.1 billion of direct investment in the U.S. current account in Q4, gladly financing the deficit. We expect the current account deficit to widen further, weighing more on the greenback in 2018.
Existing home sales bounced back from January's 3.2 percent drop with a 3.0 percent gain in February. The rise in home sales was largely driven by warm weather in the West and South, allowing for more home buying activity in the month. Weather in the Northeast and Midwest was a different story, with snowstorms causing declines in home sales. New home sales decreased slightly in February from a 622,000-unit pace to a 618,000-unit pace. January's 7.8 percent drop was revised to a 4.7 percent decline. Housing demand is strong behind job and income growth, but supply shortages are limiting the pace of growth to moderate. The lack of inventory is particularly pointed in lower-priced homes, keeping first-time buyers on the sidelines. The low inventory has driven prices up rapidly and is causing homes to be on the market for a shorter amount of time. Consumers are increasingly viewing now as a good time to sell a home as prices run up and demand strengthens, which could ease supply concerns.
Durable goods orders rose 3.1 percent in February, much stronger than the consensus 1.6 percent estimate following a weak prior two months. Core capital goods orders were particularly strong this month, doubling market expectations and rising 1.8 percent, ex-aircraft and defense. Manufacturing output increased a solid 1.2 percent in February, which foreshadowed the strength in core orders. The gap between the sky-high soft survey data and the hard data such as spending and orders was narrowed in February, but remains wider than historical norms. Though today's report was encouraging, equipment spending has moderated, and we expect real equipment spending to come in at a 7 percent pace in Q1 following last year's strong finish.
U.S. Outlook
Consumer Confidence • Tuesday
The Consumer Confidence Index gained 6.5 points in February to reach its highest level since late 2000, at 130.8. Consumers' assessment of the present situation and expectations for the future both rose solidly. The job market was the main driver of the surge in confidence about the present, with the share reporting that jobs are plentiful jumping to the highest of the expansion. Meanwhile, the share reporting that jobs are hard to get fell to a cycle low.
Rising expectations came from improved consumer outlooks on business conditions, employment and income. New tax withholding tables took effect in February, which likely helped boost the share expecting higher incomes 3.2 points to 23.8 percent, a cycle high. Strength in the job market is likely to continue to support confidence ahead. Nonfarm payrolls rose 313,000 in February, above the three-month average of 242,000, and wage growth has picked up.
Previous: 130.8 Wells Fargo: 129.8 Consensus: 131.0
Pending Home Sales • Wednesday
Pending home sales plunged 4.7 percent in January, after three months of modest gains. January's drop brought the index to its lowest level since 2014. The NAHB/Wells Fargo Housing Market Index, which measures homebuilder confidence, has remained steady at a healthy level. This suggests that demand for homes is not a main barrier to sales. Rather, cold weather and a low inventory of homes available for sale likely weighed on home buying in January. Declines in initial contract signings were most pronounced in the Northeast and Midwest, where cold temperatures in early January would have had the largest effect.
As Spring arrives, the risk of cold weather depressing home sales will diminish. However, low inventories remain a consistent barrier to a significant upturn in pending home sales. A shortage of construction workers and higher materials costs, among factors, have continued to hold back new construction.
Previous: -4.7% Consensus: 2.0% (Month-over-Month)
Personal Income • Thursday
Personal income increased a strong 0.4 percent in January while disposable personal income surged 0.9 percent, as Americans paid less in taxes. Stronger growth in wages and salaries and higher social security transfers also added to income growth.
Americans did not completely spend the increase in their incomes; consumption rose 0.2 percent in January, about $103.6 billion less than disposable income. This lifted the saving rate to 3.2 percent of disposable income, from 2.5 percent in December. Sharp declines in the saving rate over the past two years have been raising concerns about consumers becoming overextended, so January's saving rate increase should help allay those fears. While consumption started the year on a weaker note compared to the last quarter of 2017, the uptick in income growth should help consumers afford to increase their pace of purchases ahead. We expect a recovery in the pace of consumption during the remainder of the year.
Previous: 0.4% Wells Fargo

Global Review
Rate Hike in May by the MPC Still in Play
- CPI inflation in the United Kingdom fell from 3.0 percent in January to 2.7 percent in February, which could compel the Monetary Policy Committee (MPC) to remain on hold for the foreseeable future.
- But the labor market and the broader economy appear to be performing well, and the MPC has sounded more hawkish in the past month or so. We look for it to hike rates 25 bps at its next policy meeting on May 10.
- We look at effects on the U.S. economy from potential tariff retaliation in the "Topic of the Week" section of this report.
Rate Hike in May by the MPC Still in Play
The Monetary Policy Committee (MPC) at the Bank of England (BoE) decided at this week's policy meeting to maintain its main policy rate at 0.50 percent, which was widely expected (see chart on front page). The U.K. government mandates that the BoE hit an inflation target of 2 percent over the medium term. As shown in the top chart, the overall rate of CPI inflation has exceeded 2 percent continuously over the past 12 months. The surge in CPI inflation last year reflects, at least in part, the sharp depreciation of the British pound in the aftermath of the Brexit referendum in June 2016. But sterling has stabilized over the past year, and CPI inflation is beginning to recede back toward target. Everything else equal, the MPC would want to remain on hold in coming months to watch the incoming price data.
But everything else is not necessarily equal. Data released this week showed that the labor market is doing quite well at present. Specifically, payrolls rose by 168,000 between October and January, which was much stronger than most analysts had expected. The strong payrolls number helped to push the unemployment rate down to 4.3 percent, the lowest rate in 42 years. The strength in the labor market has caused earning growth to trend higher in recent months (middle chart). Higher earnings growth could raise unit labor costs, which could slow the return of CPI inflation to the BoE's 2 percent target.
Furthermore, it appears that the economy continues to expand at a reasonable rate in the first quarter. Data released two weeks ago showed that industrial production (IP) jumped 1.3 percent in January relative to the previous month. Although overall IP was pushed higher in January by a one-off surge in the mining and quarrying sector, output in the factory sector rose for the ninth consecutive month. In addition, real retail sales shot up 0.8 percent on a sequential basis in February, although the yearover- year rate of spending growth remains rather lackluster (bottom chart).
The MPC surprised market participants at its last policy meeting in early February when it said that "the UK economy has only a very limited degree of slack," and that "monetary policy would need to be tightened somewhat earlier and by a somewhat greater extent over the forecast period" than previously anticipated. In its March policy statement the MPC reiterated its view that spare capacity will be used up by the end of next year. Although the MPC voted 7-2 to keep rates on hold this week, the two dissenting members of the committee presumably voted to hike rates.
A few weeks ago we brought forward our expectation of another MPC rate hike, which we had originally penciled in for the August policy meeting, to May due to the more hawkish MPC rhetoric and the incoming data flow. We currently expect that the MPC will then remain on hold until early 2019, but we acknowledge that there is a reasonable probability that it could hike rates yet again later this year. As the MPC itself noted, a major uncertainty facing the U.K. economy remains the Brexit negotiations. If this uncertainty should start to weigh on growth later this year, then the MPC likely will remain on hold after its expected rate hike in May.
Global Outlook
Canadian Monthly GDP • Thursday
Real GDP growth in Canada came in at a 1.7 percent annualized rate in the fourth quarter. Not only was that a bit below expectations, but the initially reported growth for Q3 was revised a bit lower as well. After growing faster than the rest of the G7 in the first half of the year, Canada's economy slowed more than initially reported in Q3 and grew less than expected in Q4.
We will get the first look at how GDP is shaping up in the first quarter when the January reading for monthly GDP is released on Thursday of next week.
Previous: 3.3% Consensus: 2.9% (Year-over-Year)
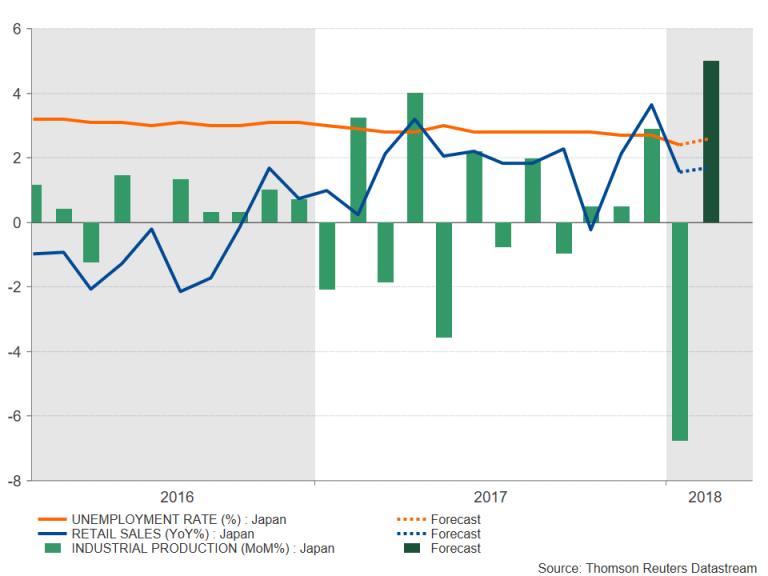
Japanese Industrial Production • Friday
The annualized rate of GDP growth in Japan slowed to just 1.6 percent in the fourth quarter. Business fixed investment picked up after a soft fourth quarter and corporate profits in Japan remain elevated. Business investment has now increased in six of the past seven quarters and suggests a steady uptrend.
Output measures, however, like the monthly industrial production figures have been more unpredictable. In 2017 for example, IP was up seven months but down five. Throughout that year though, IP never declined in back-to-back months.
The current year began with a 6.8 percent monthly decline January, we find out on Friday what happened with Japanese industrial production in February.
Previous: -6.8% Consensus: 5.0% (Month-over-Month)
Chinese Manufacturing PMI • Friday
Real GDP growth in China came in at 6.8 percent on a year-ago basis in the fourth quarter which was slightly better than expected. That said, we anticipate a modest slowing in growth in the coming quarters due largely to a retrenchment in investment spending. Although the pick-up in investment spending in the earlier part of the past decade contributed to productivity and output gains, China's corporate sector is now highly leveraged.
The PMIs give some indication of business activity in China. The official PMI, which offers insight into state-owned enterprises has been trending lower in recent months. The Caixin PMI, which offers an assessment of the small and medium sized companies in the private sector, has been somewhat more resilient.
Friday of next week brings the first look at sentiment in March when the official PMI hits the wire.
Previous: 50.3
Point of View
Interest Rate Watch
Fed Tightens but Financial Conditions Remain Easy
One contradiction for investors today is the contrast between a central bank tightening credit while overall financial conditions remain easy (top graph).
This week the FOMC raised the funds rate with the intention of raising the funds rate two more times this year. In contrast, the financial market conditions index of the Federal Reserve Bank of Chicago, which includes 100+ indices such as the Fed's senior loan officer survey, yield spreads between CMBS and ABS instruments, the Ted spread and gold, remains negative. This signals credit conditions are easier than on average.
Using this financial conditions index, the outlook for the economy remains positive with no signal of recession.
Quality Spread: Signal from AA Spreads
Spreads of AA corporate bonds relative to the five-year Treasury yield (middle graph) have risen recently but the current spread remains below the recent peaks of mid-2015 to mid-2016. Given the current low ratio of corporate interest expense to cash flow, the ratio does not provide a signal of impeding problems for the overall economy, although there are certainly issues for individual credits.
Quality Spread: Signal from BB Spreads
For high yield bonds the spread relative to five-year Treasury yields (bottom graph) provides even less evidence of a crisis in credit.
Our current outlook is for continued economic growth for the rest of 2018 and into 2019. Our latest recession probability remains below 10 percent.
We do not see that the continued path of the funds rate for the rest of 2018 as representing a threat to the economy.
Our concerns are more focused for 2019 as continued fed funds rate increases meet the reduction of the Fed's balance sheet and increased Treasury deficit financing. Of course, we add higher inflation, weaker dollar into this volatile mix.
Credit Market Insights
Confidence in Personal Finance
The Bloomberg Weekly Consumer Comfort Index rose this week to 56.8 from 56.2 a week earlier. This measurement has trended sideways for the past six weeks, which can likely be attributed to political uncertainties surrounding trade policies and spooked equity markets. Despite potential pitfalls on the macro-scale, the American consumer remains upbeat. The personal finance gauge rose to 62.9, and is up 2.5 points in the past month, the second-highest level since May 2007. The Bloomberg Consumer Survey of U.S. Economic Expectations also rose, suggesting Americans are still optimistic on future conditions.
So are these optimistic sentiments warranted, or have animal spirits taken too much leash? For starters, personal finances have certainly improved since the Great Recession and default rates on personal loans remain near cycle lows. However, there are a few metrics which may require a second look. For example, the household debt service ratio as a percent of disposable income has trended up the past several quarters after declining for a number of years. Likewise, the debt service ratio for consumer credit continues to move upward, suggesting consumers are financing more and more of their purchases with credit. These metrics on their own do not spell trouble for consumer finances. However, they may suggest difficulties ahead, especially as accommodative monetary policy is withdrawn. We would not be surprised if delinquency rates tick up in 2018 and 2019.
Topic of the Week
Who is Vulnerable to Tariff Retaliation?
President Trump announced on March 8 that his administration would levy 25 percent tariffs on steel imports and 10 percent tariffs on aluminum imports, and he followed up these actions on March 22 by announcing tariffs worth at least $50 billion on imports exclusively from China. China has responded with some minor actions of its own, but it could do much more. The administration has temporarily excluded the European Union (EU) from the steel and aluminum tariffs, but those countries could eventually retaliate if tariffs are instated on them. Which U.S. industries would be most vulnerable to retaliatory steps?
In the top chart we show the percentage of industry value added that is accounted for by exports to America's most important trading partners outside of NAFTA. (The administration has exempted Canada and Mexico from the steel and aluminum tariffs, so we remove them from the list.) About 30 percent of value added in the "other transport equipment" industry (largely the aircraft industry) is accounted for by exports to America's top export markets outside of NAFTA. The chart also makes it clear that exports to the EU are an important component of the value added that is generated in that industry. Meaningful proportions of value added in the chemicals, machinery & equipment rental, computer, and machinery & equipment industries are also accounted for by exports to these important trading partners.
Would there be a meaningful macroeconomic effect from potential tariff retaliation? The "other transport equipment" industry accounts for only 0.6 percent of total value added in the U.S. economy. But the 10 industries that are shown in the top chart account for roughly 10 percent of the value added in the economy. An all-out trade war, should one develop, could have a noticeable effect on the U.S. economy.
The Weekly Bottom Line: Markets Hurt by Tough Trade Talk
U.S. Highlights
- Markets have swung from euphoria over tax cuts, to the protectionism pits, as the White House announced imminent tariffs on up to $50 billion in Chinese imports. China has also announced modest retaliatory measures.
- It remains to be seen what kind of actions will ultimately be taken. As the scope of steel and aluminum tariffs is continually narrowed, the White House's bark on tariffs may prove worse than its bite.
- As expected, the FOMC hiked rates 25 basis points, but more importantly, it upgraded its outlook for growth and inflation. The median "dot" now suggests three rate hikes in 2019, up from two in the last forecast. This suggests the Fed will continue to be cautious in the face of fiscal stimulus.
Canadian Highlights
- Equity markets were shaken and stirred by gyrating oil prices and the U.S. government's announcement of $50 billion in import tariffs on Chinese products.
- The direct hit to activity from the tariffs activity should be modest. However, considerable uncertainty still exists on this front, given the potential for further actions by the U.S. or China.
- Consumer price inflation heated up in February, moving above the Bank of Canada's target. Still, a soft start to the year for growth, reinforced by weak retail spending figures in January, argues for further caution on the Bank's part.
U.S. - Markets Hurt by Tough Trade Talk
Despite good news on the U.S. economy, the announcement of potential tariffs on Chinese imports dented sentiment and took equities sharply lower on the week. Over the past three months, markets have swung from euphoria over tax cuts, to the protectionism pits, as the White House followed up the announcement of forthcoming steel and aluminum tariffs with a 25% tariff on up to $50 billion in Chinese imports.
As expected, China has announced how it would retaliate, with 15% tariff on U.S. imports of steel pipes, fruit, wine and other products, and 25% on pork and recycled aluminum, all in targeting about $3 billion in U.S. goods. The relatively modest size of the planned retaliation suggests China is willing to pursue dialogue with the U.S. to address trade disputes about the continuous violation of intellectual property rights of U.S. firms that operate in China. It's not clear when or even if the announced tariffs will come into effect. We have already seen the U.S. walk back the scope of recently announced steel and aluminum tariffs, by exempting more countries, suggesting that this week's announcement is an opening gambit.
The U.S. does have a leg to stand on, when it comes to China's trade practices. However, even a just war has collateral damage. Many U.S. companies will be hurt if these tariffs come to pass, even if the actions are short-lived. This localized damage, however, would not deal a body blow to the over $19 trillion U.S. economy, which looks set to grow quite strongly over the next two years.
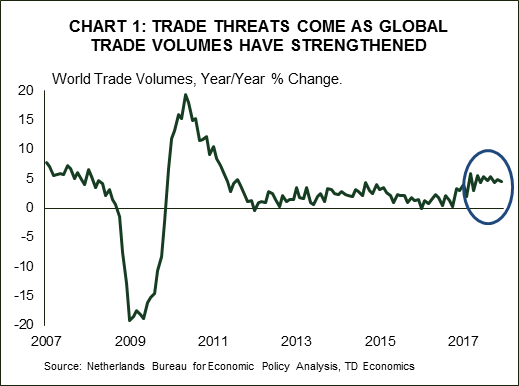
However, as demonstrated by markets this week, it is the indirect effects of a more adversarial global trade environment and the uncertainty it breeds that could hamper investment and trigger volatility on financial markets. And it is unfortunate that these threats come just as growth in global trade flows has accelerated (see Chart 1).
Now, about that good news. The FOMC hiked rates 25 basis points as expected, but more importantly, it an upgraded its economic outlook. Real GDP growth was lifted 0.2 percentage points in 2018, and 0.3 percentage points in 2019, and the unemployment rate now troughs at 3.6% in 2019, down from 3.9% previously. Core PCE inflation is also now expected to rise a hair above 2% in 2019. A modest inflation overshoot following nearly a decade of below target readings should not come as a terrible surprise. But, it speaks volumes to the bias of the FOMC not to push too hard or too soon against the rising fiscal tide.
That bias was demonstrated in just one additional hike by the end of 2019 as a result of its upgraded outlook. This forecast is consistent with our own view. That said, seven of 15 FOMC members now have four hikes penciled in for 2018, up from four in December, suggesting that it won't take much to tip the number of hikes expected in 2018 from three to four. For now though, the Fed doesn't look keen to get too far in front of the expected pickup in economic growth, but is happy to make sure its outlook is realized before increasing the speed of rate hikes. Given the risk that too much fiscal stimulus in a hot economy could result in the Fed raising rates too quickly, and contributing to a recession, this cautious approach is reassuring.

Canada - Trade Uncertainties Rattle Markets
It was an eventful week for Canadian financial markets, which were shaken and stirred by gyrating oil prices and more import tariffs announced by our neighbours to the south. The TSX began the week in the red, although negative sentiment on equities reversed course midweek, as stronger oil prices boosted energy shares. However, these gains were quickly erased by week's end, with investors spooked by the U.S. government announcing a 25% tariff on up to $50 billion in Chinese imports and China responding with its own tariffs on various U.S. products. For its part, the Canadian dollar was able to gain some ground, supported by higher oil prices and hotter-than-expected inflation data. The latter report also helped lift bond yields across the curve.
With respect to the newly announced tariffs by the U.S. and China, our preliminary take is that the direct economic impact on both countries is likely to be small, given past efforts on the part of China to diversify away from exports, and that products targeted by the U.S. comprise a small share of overall imports. This would accordingly imply muted impacts for Canada. However, indirect impacts could be larger, given the dependence of U.S. supply chains on Chinese goods. Moreover, considerable uncertainty still exists on this front, with the exact list of products targeted by the U.S. still unknown at this time and the potential for follow up actions by both the U.S. and China a realistic risk. This uncertainty could continue to drive financial market volatility, weighing on Canadian growth.
There was also some constructive news on the trade front this week, with optimism returning to NAFTA talks after the U.S. reportedly dropped its demand for at least 50% U.S. content on autos built in Canada and Mexico. However, President Trump threw cold water on negotiations, threatening to impose steel and aluminum tariffs on Canada and Mexico by May 1st, should talks not progress to his liking.
On the data front, retail spending edged up a subdued 0.3% in January, weighed down by softer sales at motor vehicles and parts dealers. Volumes were up a similarly modest 0.1%, a disappointing result on the heels of December's weak showing (Chart 1). The soft spending print joins the mix of indicators for January signaling a modest start to the year for the economy, with first quarter GDP tracking a below-potential 1.4% (annualized) gain.
While indicators of activity are gearing down, price pressures are heating up, with a consumer price inflation accelerating to a 2.2% year-over-year pace in February on broad-based gains, thus moving slightly above the Bank of Canada's target. More importantly, core inflation also drifted higher, with the average of the Bank of Canada's three measures breaching 2% for the first time since 2016 (Chart 2). The firming in core inflation should raise some eyebrows at the Bank of Canada, but a soft start to the year for growth amid elevated trade uncertainties argues for continued near-term caution on the part of the Bank, with the next hike likely to be delivered during the summer.


U.S.: Upcoming Key Economic Releases
U.S. Personal Income & Spending - February
Release Date: March 29, 2018
Previous: Income 0.4% m/m; Spending 0.2% m/m
TD Forecast: Income 0.4% m/m; Spending 0.3% m/m
Consensus: Income 0.4% m/m; Spending 0.2% m/m
We look for headline PCE inflation to be stable at 1.7% y/y in February, reflecting a 0.1% m/m increase. In line with the CPI report, energy prices should be neutral with food prices a modest negative on a m/m basis. We expect a 0.2% m/m print in the core PCE, leaving the core inflation rate stable at 1.5% y/y. While there is risk for a 0.1% rise, we see scope for another solid increase in the healthcare services component, underpinning a third consecutive 0.2% print. Looking ahead, the report provides solid footing for core PCE inflation to pick up smartly to 1.8% in March due to base effects.
Nominal PCE (personal spending) should rise 0.3% in February, implying a 0.2% increase in real spending. That translates to a still sub-2% advance in real consumer spending for Q1. We expect February gains to be driven by services and nondurables, with a neutral contribution from durables spending. We also expect a stronger 0.4% increase in February personal incomes, supportive of a pickup in spending in the months ahead.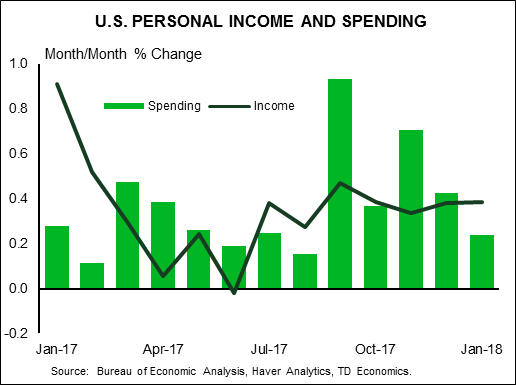
Canada: Upcoming Key Economic Releases
Canadian Real GDP - January
Release Date: March 29, 2018
Previous: 0.1% m/m
TD Forecast: 0.1% m/m
Consensus: N/A
GDP growth should maintain a muted 0.1% m/m pace in January as transitory headwinds weigh on both goods and services. Disruptions to auto production will once again constrain goods sector output while new mortgage rules and the resulting slowdown in home sales will weigh on services. Food services could be another source of weakness due to the Ontario minimum wage hike. Elsewhere, we expect a broad increase in activity to support monthly GDP. A 0.1% print would leave Q1 GDP tracking in the mid-1% range, well below the Bank of Canada's projected 2.5%. This would extend a period of near-trend growth to three quarters after a robust 17H1 and weaken the case for slamming on the brakes with three rate hikes in 2018.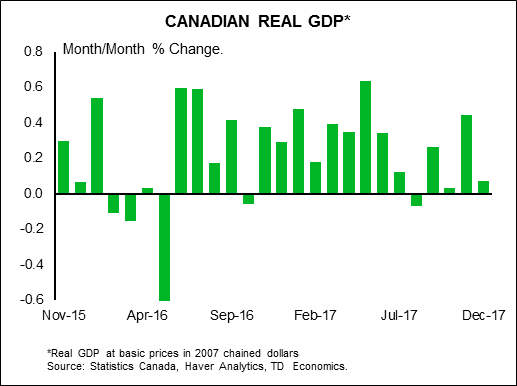
US Dollar Falls as Trade War Anxiety Triggers Flight to Safety
The US currency is weaker against all major pairs as US tariffs targeting China were announced. The USD was trading higher on Wednesday after the U.S. Federal Reserve hiked interest rates by 25 basis points as anticipated. Fed Chair Jerome Powell was neutral on his first press conference but the economic projections painted a strong US economy. The announcement on Thursday of Chinese imports subject to tariffs by the Trump administration drove stock markets lower and put downward pressure on the dollar. The economic calendar will have few major market moving events awaiting the easter holiday with the US final GDP estimate for Q4, the main attraction, to be released on Wednesday, March 28 at 8:30 am EDT. Canadian monthly GDP will be published on Thursday, March 29 at 8:30 am EDT.
- China prepared a list of tariffs on US products
- Final estimate of US GDP expected at 2.7 percent
- Canadian dollar rose as NAFTA optimism got a boost
US Fundamentals Lose Out to Trade War Concerns
The EUR/USD rose 0.64 percent during the week. The single currency is trading at 1.2367 after investors sold the dollar based on concerns about a possible trade war with China. European data was in short supply during the week with the German ZEW economic sentiment being the highlight. German confidence dropped in March as trade uncertainty had already soured the mood in Europe with ongoing Brexit negotiations and US tariffs discussed during the G20 meeting. European manufacturing also came in lower than forecasts on Thursdays when French and German flash PMIs were released. Fundamentals were strong in the US with durable goods surging to 3.1 percent on a 1.6 percent forecast and the Fed rate hike on Wednesday had the dollar appreciate versus majors.
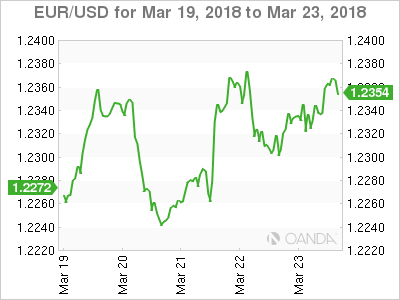 Washington announced trade tariffs aimed at China on Thursday and with that investors repositioned their currency portfolio and headed to the safety of the Japanese Yen. The EUR gained as the USD sunk deeper as there are a lot of questions on why is the Trump administration so focused on engaging on a trade war. The Trump administration has been subject to high profile personnel changes and lack of stability in the White House has remained a red flag for currency traders.
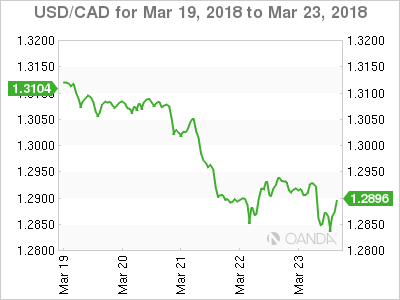 The USD/CAD fell 1.82 percent in the last five days. The currency pair is trading at 1.2856. The Canadian dollar recovered from 9 month lows as positive news developed on the trade front. Canada was one of the first countries to be exempted from the Trump steel and aluminum tariffs and with the fall of the USD regained some of the ground lost last week. On Friday Canadian indicators showed a rise in annual inflation of 2.2 percent, a three year high. Retail sales still betray some softness in the economy as the headline number came in short at 0.3 percent of the 1.1 gain. Core retail sales met expectations of a 0.9 percent lift specially after last month’s drop of 1.7 percent.
The White House issued a statement on Friday that puts the steel and aluminum exemptions as conditions on reaching an agreement on the NAFTA renegotiations. President Trump has put in a deadline of May 1, and there is no significant progress on the negotiations the tariffs will become effective for Canada and Mexico. Originally all three members wanted a speedy resolution in 2017. The position of the US in trade negotiations was not flexible to the point that there has been little progress. Now this new deadline could finally bring about the momentum needed to unlock negotiations or spell the end of the 14 year old treaty.
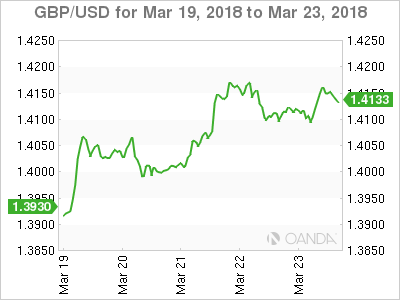 The GBP/USD rose 1.45 percent during the week. Cable is trading at 1.4126 near a two month high after the Bank of England (BoE) held rates at 0.5 percent but signalled that a May rate hike might be in the cards. Brexit negotiations also helped with a transition deal being agreed between the UK and the EU. The 21 month transition period will be added to next year’s exit which leaves more room to negotiate a softer Brexit.
Two out of the nine policymakers in charge of British interest rates voted for higher rates. They were outvoted ultimately, but Ian McCafferty and Michael Saunders said that now is the time for lifting rates. Although sterling benefited from dollar weakness following trade war anxiety if a full blown trade dispute does emerge it will also affect the economic stability of the UK which could lead the BoE to reconsider a rate hike this year.
Market events to watch this week:
Tuesday, March 27
- 10:00am USD CB Consumer Confidence
- 8:00pm NZD ANZ Business Confidence
Wednesday, March 28
- 8:30am USD Final GDP q/q
- 10:30am USD Crude Oil Inventories
Thursday, March 29
- 4:30am GBP Current Account
- 8:30am CAD GDP m/m
*All times EDT
Week Ahead – Trading to Wound Down ahead of Easter; Dollar to Seek Support from Fed Speakers
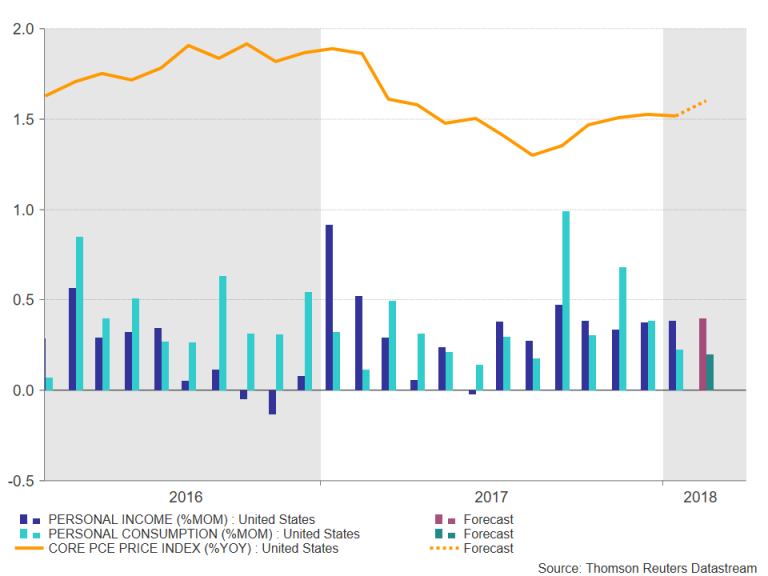
After a busy week filled with central bank activity and political developments, there should be some restoration of calm in financial markets over the coming week as trading activity wounds down ahead of the Western Easter celebrations. Data releases out of the United States look set to dominate the calendar, with the core PCE price index for February likely to be the most closely watched item. Fed policymakers may steal the headlines however, as they return to the podium following the completion of the March FOMC meeting.
Japan industrial output eyed after January slump
Japan will have the second busiest calendar after the US as retail sales, jobs and industrial output figures are published. Retail sales for February are due on Wednesday and will be followed by job figures on Thursday. Japan’s unemployment rate fell to 2.4% in January – the lowest in nearly 25 years. However, much to policymakers’ disappointment, the tight labour conditions have yet to stimulate higher wage growth. Another indicator for labour market tightness is the jobs/applicants ratio, which stands at its highest since 1973. The ratio measures the number of vacancies available per job seeker. A strong showing next week would boost hopes that higher wages should soon follow suit.
Also out on Thursday is the preliminary reading for industrial production data for February. After an unexpected 6.8% month-on-month drop in January, investors will be looking for a rebound in February. With yen strength showing no sign of abating, better-than-expected indicators would provide additional support. On the other hand, disappointing numbers alone are unlikely to generate much downside pressure.
 Little excitement out of euro area
The euro received a much-needed boost from a tumbling US dollar this week but is in danger of drifting lower again over the coming week with few major releases on the horizon. After a disappointing set of business confidence surveys for March this week, Tuesday’s Eurozone economic sentiment index isn’t expected to buck the trend. The gauge is forecast to drop from 114.1 to 113.4 in March. Flash CPI readings out of Germany may also attract some attention as it is seen as a good indicator for the euro-wide figure due in the following week. Germany’s harmonized consumer price index is forecast to accelerate from 1.2% to 1.6% year-on-year in March.
UK Q4 GDP to remain unrevised
Traders will be treated to a third reading of the UK’s GDP growth figure for the fourth quarter on Thursday but will have to wait a while for the Q1 2018 data due at the end of April. No change to the 0.4% quarter-on-quarter figure is expected, which was revised lower in the second print. However, the quarterly investment numbers, which will be included in the GDP report, will be watched to assess how well business spending is holding up in Britain amid the Brexit uncertainty. The pound was boosted this week on the announcement of a Brexit transition deal and a hawkish Bank of England, as well as some upbeat data. A surprisingly weak print on business investment could act as a reality check for sterling bulls, which drove cable to above $1.42 this week.
Loonie looks to monthly GDP to extend gains
Renewed optimism on the progress of NAFTA talks pulled the Canadian dollar away from near 9-month lows to a one-week high of C$1.2825 to the greenback this week. The prospect of a positive outcome in the NAFTA renegotiation has at least for now shifted the focus back on economic data to drive the loonie. Monthly GDP numbers on Thursday will provide the first indication as to how Canada’s economy started 2018. GDP is forecast to have expanded by 0.1% m/m in January. Producer prices for February, due the same day, will also be watched.
PCE inflation and GDP revisions unlikely to inspire the dollar
It’s been a bad week for the US currency, with the greenback losing ground by around 1% versus the yen to below the 105 level on the back of rising trade war fears. Those concerns are not likely to fade over the coming days, so investors will be looking at next week’s data releases for a possible lift.
The first big release will be Tuesday’s consumer confidence index by the Conference Board. The index is anticipated to set to a fresh 17-year high and climb to 131.0 in March. On Wednesday, the final reading of fourth quarter US GDP is expected to see a modest upward revision from 2.5% to 2.6% on an annualized basis. A higher figure could help add some much-needed upside momentum to dollar crosses.
The focus will then move to the personal consumption expenditures (PCE) report on Thursday. The data is expected to show personal income growth holding steady at 0.4% m/m in February, and personal consumption rising by 0.2% m/m, the same pace as in January. The other headline number from the report will be the core PCE price index, which is the Fed’s preferred price gauge. Core PCE inflation is forecast to inch up to 1.6% y/y in February after being stuck at 1.5% for four straight months. Any upside surprise to the figure could be a potential boost for the dollar. Other data to watch are pending home sales for February (Wednesday) and the Chicago PMI for March (Thursday).
 If the data fails to move the markets, traders may instead seek direction from the Fed as FOMC members line up to speak over the next seven days. The speakers will include William Dudley, Loretta Mester, Raphael Bostic, Patrick Harker. Should their language lean on the hawkish side, it could spur fresh buying interest in the greenback as it would come hot on the heels of an upward shift in the Fed’s rate path in March’s dot plot chart.