Sample Category Title
ECB Review: ‘Meaningfully Less Restrictive’
- Today the ECB decided to cut the policy rate by 25bp, so the deposit rate now yields 2.50%. The most important part of the decision was its assessment of the restrictiveness of its monetary policy stance. The ECB now sees that monetary policy is ‘becoming meaningfully less restrictive’, which means it assesses that the current rate level is closer to the terminal rate than previously.
- Given the strong uncertainty, Lagarde clearly guided that the data-dependent approach is probably higher than ever, thus there was no guidance or commitment to an April cut. Today’s decision was a consensus, with none opposing, but Holzmann abstained.
- The staff projections lowered the growth forecast for 2025 to 0.9% y/y (down from 1.1%) and 2026 to 1.2% y/y (down from 1.4%). Inflation was revised higher in 2025 to 2.3% from 2.1% due to energy prices, but as futures have since declined, we do not interpret that as a hawkish signal, also reflected by the core inflation forecast being revised down to 2.2% from 2.3%
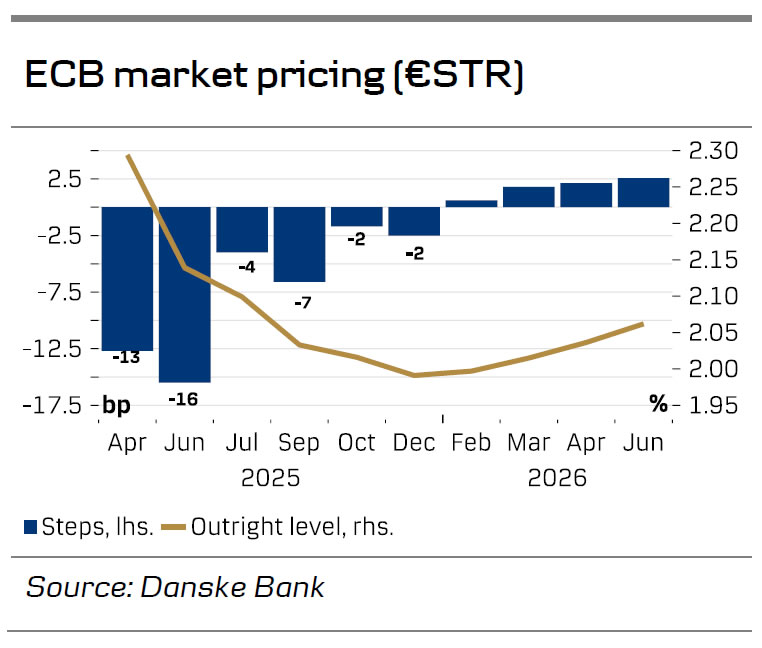
- Markets have repriced the ECB expectations in recent days, not least following the change to the German fiscal position and spending package. Currently there are almost two additional cuts from the ECB until year-end priced, which is about one cut less than earlier this week.
Disinflation remains on track and the economy faces challenges
Lagarde noted that the disinflation process remains well on track and that the upward revision to the staff 2025 inflation forecast from 2.1% y/y to 2.3% y/y reflected stronger energy prices in January. Energy prices have since declined and the ECB staff also revised down the core inflation forecast for 2025 to 2.2% y/y from 2.3% y/y, so we do not interpret the higher headline forecast as a hawkish signal. The ECB continues to communicate that most measures of underlying inflation and inflation expectations suggest inflation will settle around the 2% target. Thus, for 2025 and 2026 the forecast changes to inflation were minor (see table to the right).
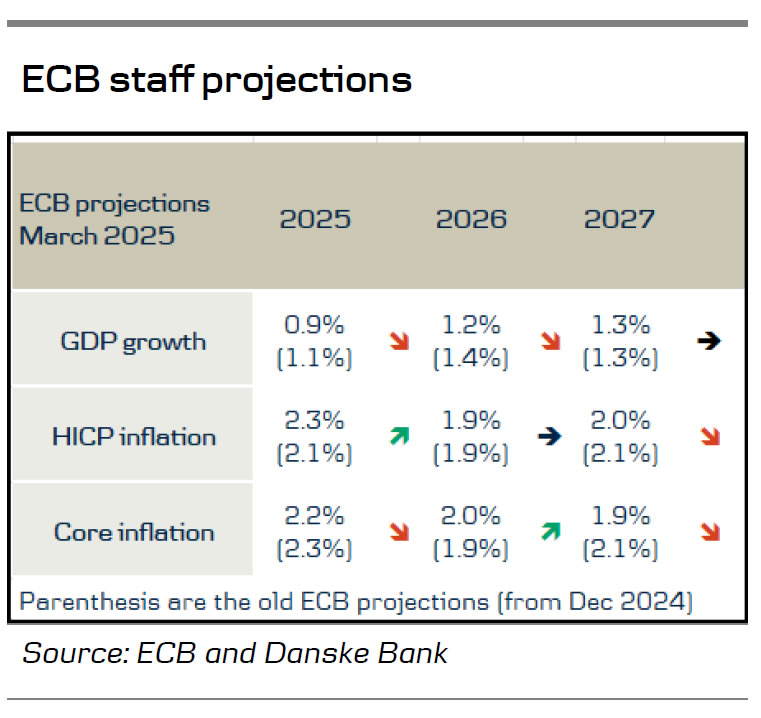
The ECB emphasised that the economy continues to face challenges, leading staff to lower their growth forecasts once more – to 0.9% for 2025 (down from 1.1%), 1.2% for 2026 (down from 1.4%), and 1.3% for 2027. The reductions for 2025 and 2026 are attributable to reduced exports and ongoing weakness in investment, partly due to high trade policy uncertainty and broader policy unpredictability. Increasing real incomes and the gradually fading impact of previous rate hikes remain the key factors underpinning the expected rise in demand over time.
Fiscal easing in Germany and rising EU defence spending not affecting current monetary policy stance
Lagarde noted that most recent data shows that manufacturing activity continued to decline in the first two months of 2025, despite improvements in surveys.
Meanwhile, services are resilient, and a robust labour market supports a gradual rise in consumption, although demand for labour has moderated, and surveys indicate a slowdown in employment growth in January and February. Overall, the risks to the growth outlook are tilted to the downside and Lagarde added tariffs as a downside risk and defence and infrastructure spending as a new upside risk. Lagarde says that impact of German fiscal plans and EU defence spending will depend on the details and that they have not incorporated any impact yet in their monetary policy. She does note, however, that it will be positive growth.
No guidance for April
With the high uncertainty around the near-term risks, Lagarde refrained from committing to any policy decision at the upcoming meetings; in fact, it was not clear whether the ECB intends to cut or halt at the upcoming April meeting based on today’s information. The repetition of the ECB’s data dependence, and probably being more than ever as Lagarde phrased, leads to an increased focus on incoming data and the inflation outlook. Markets took the guidance as marginally hawkish and now price the ECB April meeting at 12bp.
Based on today’s information, we are not as confident about the outlook for the April cut as we were previously. While it remains our baseline scenario, we also point to the significant inflation and activity data (e.g. PMI) as key points. Also, Lagarde’s speech next week at the Watchers conference will be key in our view.
Sunset Market Commentary
Markets
The ECB cut its policy rate as expected by 25 bps with the deposit rate hitting 2.5%. The decision wasn’t unanimous, but there was no opposition neither. Hawkish Austrian ECB governor Holzmann did abstain. In its monetary policy statement, the central bank for the first time emphasizes that monetary policy is becoming meaningfully less restrictive. Updated growth and inflation forecasts are little changed compared with December. The central bank expects inflation to average 2.3% this year, 1.9% in 2026 and 2% in 2027 compared to a 2.1%-1.9%-2.1% path three months ago. The prognosis for core CPI stands at 2.2%-2%-1.9%. The December growth path of 1.1%-1.4%-1.3% was slightly downgraded into 0.9%-1.2%-1.3%. High uncertainty is holding back investments and exports, but services remain resilient. Risks remain tilted to the downside. Throughout the official statement, it was remarkable that the ECB/President Lagarde only mentioned the German U-turn on fiscal spending and European efforts being negotiated on defense spending as an upside inflation risk, not mentioning its potential positive impact on growth. Lagarde stressed the data-dependent and meeting-by-meeting approach from the central bank going forward, not pre-committing to any specific rate path. She acknowledges though the impact of the previous (150 bps) rate cuts and admitted for a first time that if data suggest it, the ECB will pause (in April). EMU money market remain split on the outcome of the next meeting, with our preferred scenario being a skip in the cutting cycle. EUR/USD attempted to sustainably take out 1.0804 resistance around the time of the ECB meeting, but the move lacked strength following earlier gains this week. The USD-side of the equation remains weak though with speeches by Fed Waller (tonight) and Powell (tomorrow) together with US payrolls as wildcards to come. Lack on any specific guidance implied that moves on interest rate markets were still subject to yesterday German fiscal whatever-it-takes pledge by chancellor-to-be Merz. The German yield curve bear steepened again yields rising by 2.7 bps (2-yr) to 10 bps. The German 10-yr yield currently trades at 2.9%, closing in on the 2023 top at 3.03%. Changes on the US yield curve vary between -3 bps (2-yr) and +1 bps (30-yr). US eco data showed a bigger-than-hoped setback in weekly jobless claims (221k from 242k vs 233k expected) and the feared widening of the trade deficit (to a record -$131.4bn) as US companies imported goods before tariffs came into effect. European stock markets still opened positive, but in general slightly return part of yesterday’s impressive gains. US stock markets open up to 2% lower for Nasdaq.
News & Views
Swedish inflation accelerated more than expected. The monthly pace picked up from 0.4% m/m in January to 0.9% in February. The yearly (CPIF) figure print rose from 2.2% to 2.9%. Inflation excluding energy rose by 0.9% m/m to hit 3% on a yearly basis. All of the readings were higher than expectations, including those from the central bank. They help settle the debate whether or not the Riksbank has reached the end of a 175 bps easing cycle. Governor Thedeen has been pretty vocal about the current rate being at an appropriate level of 2.25%. This is also what the latest Riksbank projections show. The Swedish krone extended a recent rally in the wake of the publication before paring the gains later on. In a broader perspective, EUR/SEK (10.96) is trading at the lowest (SEK strongest) level since December 2022. Due to Sweden’s large military capacity, the Swedish crown emerged as the market’s darling since Europe and especially Germany’s turned towards massive defense spending.
The Turkish central bank (CBRT) as expected cut the policy rate from 45% to 42.5% today. Annual headline inflation eased from 42.1% to 39% in February. The underlying gauge of inflation resumed its decline in February after picking up in January. Based on domestic demand measures, the central bank is confident this disinflationary trend will continue. The CBRT is paying close attention to still elevated inflation expectations though, saying they continue to pose risks to the disinflation process. As a result, “the tight monetary stance will be maintained until price stability is achieved via a sustained decline in inflation.” The CBRT refrained from official guidance and sticks to a meeting-by-meeting approach instead. The Turkish lira trades little changed in a daily perspective, both against EUR (39.41) and USD (36.42).
Canadian Trade Surplus Widened Significantly in January
Canada's merchandise trade balance widened from a revised $1.7 billion in December to $4.0 billion in January. This marked the largest surplus since May 2022.
Merchandise exports jumped 5.5% month-on-month (m/m), following a 6% monthly gain in December. Exports of motor vehicles and parts (+12.5% m/m) jumped, while shipments of energy products (4.8% m/m), consumer goods (+7.8% m/m) and industrial machinery, equipment and parts (12.6% m/m) added to the headline gain.
Merchandise imports also moved higher in January (+2.3% m/m), bolstered by a surge in imports of aircraft and other transportation equipment and parts (23.6% m/m). Imports of electronic and electric equipment and parts (+5.8% m/m) and energy products (+8.5% m/m) also made significant contributions.
In volume terms, merchandise exports rose by 4.5% m/m while imports increased by 1.5% m/m.
Canada's merchandise trade surplus with the United States widened to $14.4 billion in January from $12.3 billion the month prior. Amid the threat of tariffs, exports to the U.S. surged 7.5% m/m while imports increased 4.5% m/m.
Key Implications
The strength in exports shown in January reflected companies attempting to stockpile inventories ahead of the imposition of tariffs. This dynamic could lift exports in February as well but may fade thereafter.
Trade data is often subject to heavy revisions, and we only have hard data for the first month of the quarter. That said, January's stronger growth in export volumes compared to imports points to a significant contribution (of 1 ppt or more) to Q1 real GDP growth from net trade.
Canada's export outlook has soured amid the Canada-U.S. tariff war and the recent 30-day pause on auto sector tariffs does little to remove uncertainty for this industry. Indeed, the negative impact on U.S. bound shipments will be one of the primary channels through which Canada's economy is harmed. A weak Canadian dollar could provide some offset, although would add to tariff-related inflation pressures for Canadians.
Euro Holds Gains After ECB Cut, Yen Rallies on Higher JGB Yields
Euro remained firm following ECB’s decision to cut interest rates, a widely anticipated move. During the subsequent press conference, President Christine Lagarde emphasized a shift to “more evolutionary approach” to policy, now that monetary conditions have become “meaningfully less restrictive.” She also acknowledged the high levels of uncertainty, noting that “risks are all over.”
Lagarde welcomed Germany and the EU’s proposed defense and infrastructure investments, highlighting that they could offer broad support for European growth. However, she also cautioned that increased government spending might push inflation higher via rising aggregate demand. At the same time, ECB recognizes downside risks to the economy, particularly if trade tensions escalate, thereby dampening exports and threatening global growth.
Meanwhile, Yen resumed its recent rally against Dollar and recovered against European majors. Support for Yen came from an upswing in Japan’s 10-year JGB yield, which briefly touched 1.515%, its highest level since June 2009. Expectations of another BoJ rate hike this year have fueled speculation, while Germany’s surging benchmark yield also exerts upward pressure on Japan’s yield.
In contrast, U.S. yields are struggling under the weight of growing worries about a “Trumpcession.” Investors fear that the administration’s trade policies could tip the economy toward recession, softening expectations for robust growth and keeping Treasury yields in check. This dynamic contrasts sharply with Europe and Japan, where yields jumped notably this week.
Against this backdrop, Yen stands as the strongest performer for the day so far, followed by Swiss franc and then Euro. Canadian Dollar has taken the opposite position, emerging as the worst performer, trailed by Sterling and Dollar. Australian and New Zealand Dollars are in the middle of the pack.
In Europe, at the time of writing, FTSE is down 01.05%. DAX is up 0.63%. CAC is down -0.30%. UK 10-year yield is up 0.008 at 4.656. Germany 10-year yield up 0.101 at 2.892. Earlier in Asia, Nikkei rose 0.82%. Hong Kong HSI rise 2.47%. China Shanghai SSE rose 0.78%. Singapore Strait Times rose 0.66%. Japan 10-year JGB yield rose 0.053 to 1.499.
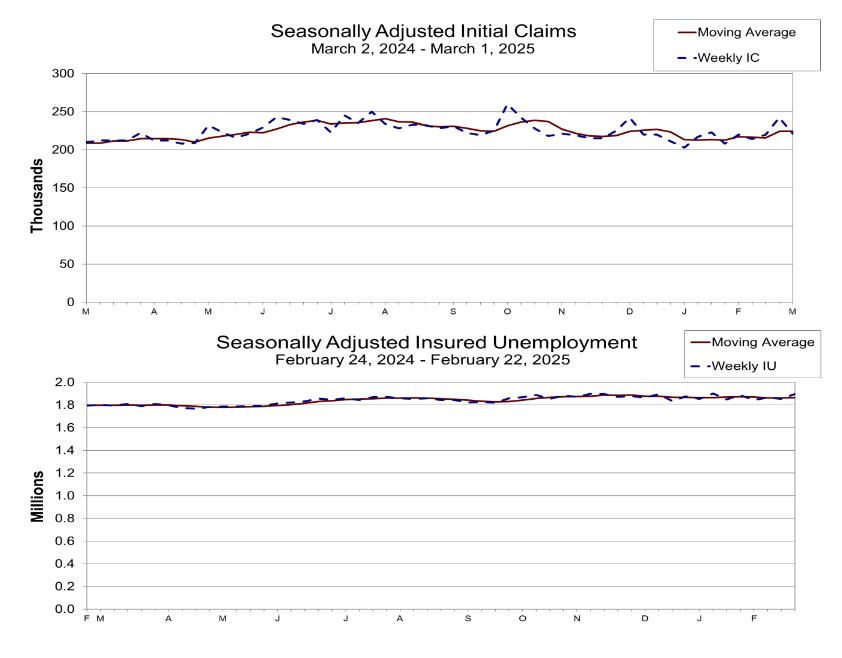
US initial jobless claims fall to 221k, vs exp 236k
US initial jobless claims fell -21k to 221k in the week ending March 1, below expectation of 236k. Four-week moving average of initial claims rose 250 to 224k.
Continuing claims rose 42k to 1897k in the week ending February 22. Four-week moving average of continuing claims rose 3k to 1866k.
ECB cuts 25bps as expected, not pre-committing to rate path
ECB cut its deposit rate by 25bps to 2.50% as expected. It maintains a data-dependent stance and stressing it is “not pre-committing to a particular rate path” amid rising uncertainty.
ECB noted that disinflation process remains on track, with inflation upgrade reflects stronger energy prices. Growth forecasts for 2025 and 2026 were downgraded due to weaker exports and investment, driven partly by trade and broader policy uncertainty.
In the new economic projections:
- Headline inflation to average 2.3% in 2025, 1.9% in 2026, and 2.0% in 2027.
- Core inflation to average 2.2% in 2025, 2.0% in 2026, and 1.9% in 2027.
- GDP to grow 0.9% in 2025, 1.2% In 2026, and 1.3% in 2027.
Eurozone retail sales fall -0.3% mom in Jan, EU down -0.2% mom
Eurozone retail sales volume dropped by -0.3% mom in January, missing expectations of a modest 0.1% mom increase. The decline was driven by weaker demand for non-food products, which fell -0.7% mom, while sales of automotive fuel also slipped by -0.3% mom. In contrast, spending on food, drinks, and tobacco rose by 0.6% mom, offering a slight offset to the overall decline.
Meanwhile, retail sales across the broader EU fell -0.2% mom on the month. Among individual EU, Slovakia saw the sharpest contraction, with retail trade volume plunging -9.0%, followed by Lithuania (-4.8%) and Cyprus (-2.2%). On the other hand, Slovenia (+2.3%), Hungary (+2.2%), and the Netherlands (+1.6%) recorded the strongest increases.
USD/JPY Mid-Day Outlook
Daily Pivots: (S1) 148.12; (P) 149.15; (R1) 149.91; More...
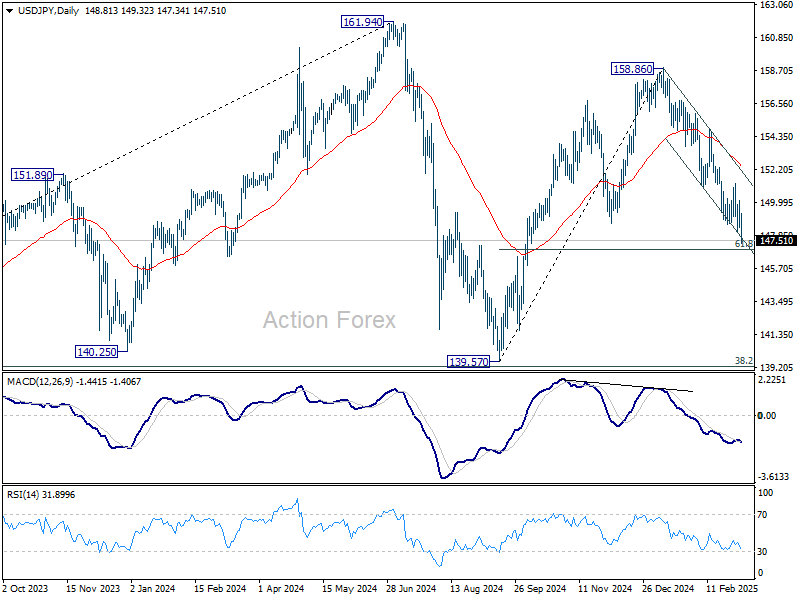
Intraday bias in USD/JPY is back on the downside with break of 148.08 temporary low. Fall from 158.86, as the third leg of the corrective pattern from 161.94 high, has resumed. Sustained break of 61.8% retracement of 139.57 to 158.86 at 146.32 will pave the way back to 139.57 low. On the upside, 149.32 minor resistance will turn intraday bias neutral and bring consolidations again, before staging another fall.
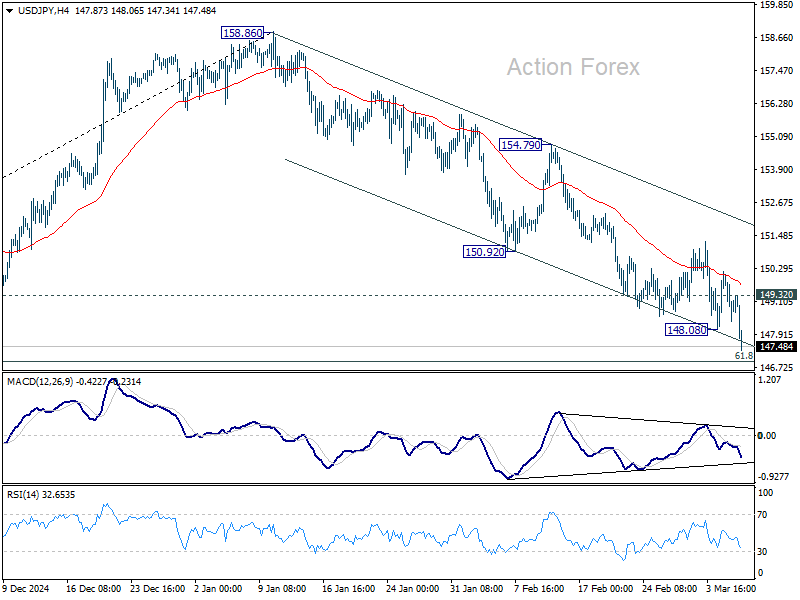
In the bigger picture, price actions from 161.94 are seen as a corrective pattern to rise from 102.58 (2021 low). In case of another fall, strong support should be seen from 38.2% retracement of 102.58 to 161.94 at 139.26 to bring rebound. However, sustained break of 139.26 would open up deeper medium term decline to 61.8% retracement at 125.25.
EUR/USD Mid-Day Outlook
Daily Pivots: (S1) 1.0662; (P) 1.0729; (R1) 1.0857; More...
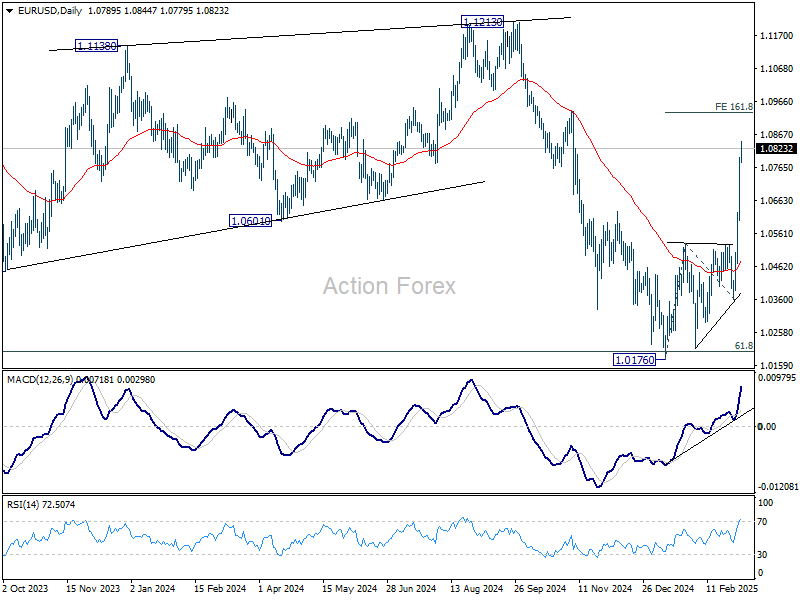
EUR/USD's rally from 1.0176 is still in progress. Intraday bias stays on the upside for 161.8% projection of 1.0176 to 1.0531 from 1.0358 at 1.0932 On the downside, below 1.0763 minor support will turn intraday bias neutral and bring consolidations first. Downside should be contained well above 1.0531 resistance turned support to bring another rise.
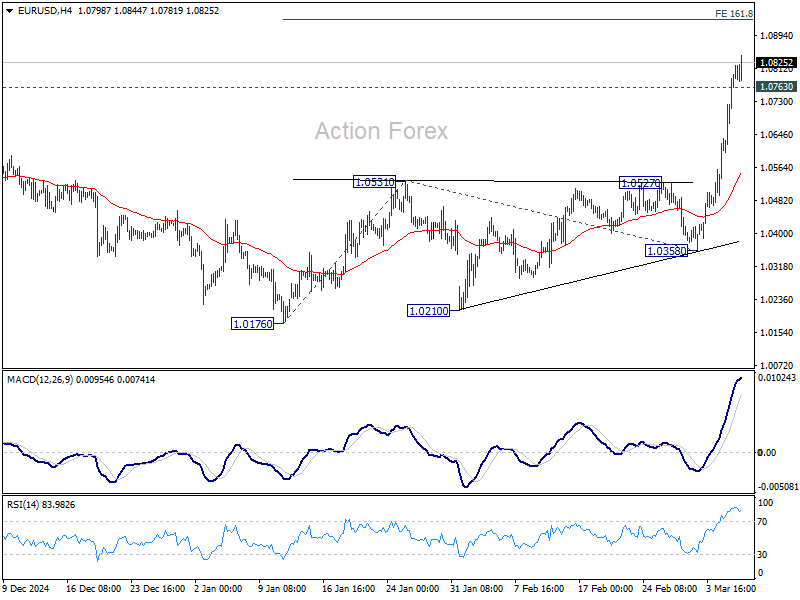
In the bigger picture, the strong break of 55 W EMA (now at 1.0668) suggests that fall from 1.1274 (2024 high) has completed as a three wave correction to 1.0176. That came after drawing support from 0.9534 (2022 low) to 1.1274 at 1.0199. Rise from 0.9534 is still intact, and might be ready to resume through 1.1274. This will now be the favored case as long as 1.0531 resistance turned support holds.
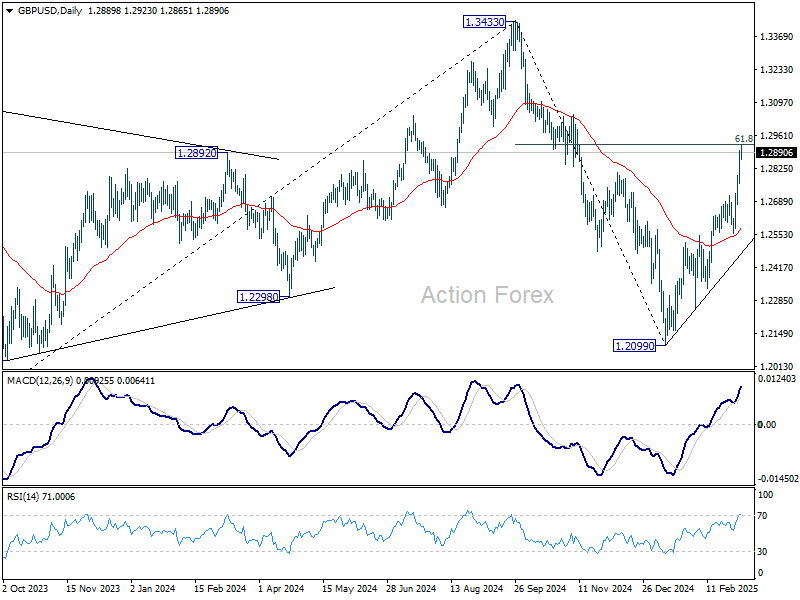
GBP/USD Mid-Day Outlook
Daily Pivots: (S1) 1.2808; (P) 1.2855; (R1) 1.2941; More...
GBP/USD's rally is from 1.2099 is still in progress and intraday bias stays on the upside. Sustained break of 61.8% retracement of 1.3433 to 1.2099 at 1.2923 will pave the way back to 1.3433 high. On the downside, below 1.2803 minor support will turn intraday bias neutral and bring consolidations. But downside should be contained well above 1.2558 support to bring another rally.
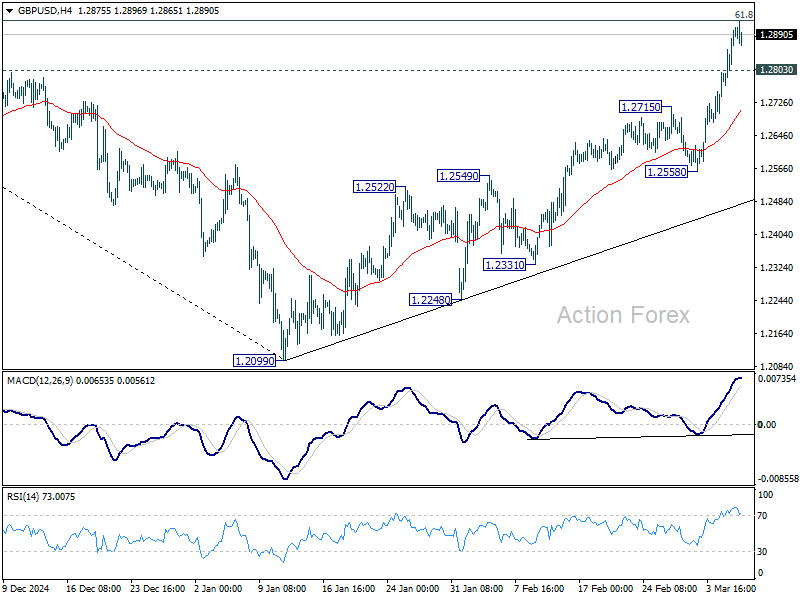
In the bigger picture, fall from 1.3433 (2024 high) should have completed at 1.2099 as a corrective move. Up trend from 1.3051 (2022 low) is still in progress but it's too early to say that it's resuming. Corrective pattern from 1.3433 could extend with one more down leg. But after all, eventual upside breakout is expected at a later stage.
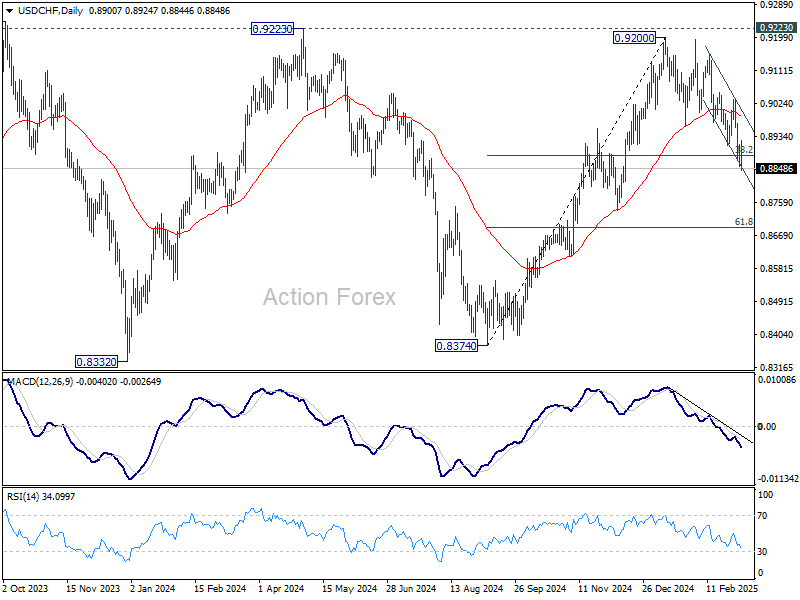
USD/CHF Mid-Day Outlook
Daily Pivots: (S1) 0.8871; (P) 0.8893; (R1) 0.8930; More…
USD/CHF's decline resumed by breaking through 0.8855 temporary low, and intraday bias is back the downside. Current development should confirm that rise from 0.8374 has completed at 0.9200, after rejection by 0.9223 key resistance. Deeper fall should be seen to 61.8% retracement of 0.8374 to 0.9200 at 0.8690 next. On the upside, above 0.8924 minor resistance will turn intraday bias neutral first.
In the bigger picture, rejection by 0.9223 key resistance keep medium term outlook bearish. That is, larger fall from 1.0342 (2017 high) is not completed yet. Firm break of 0.8332 (2023 low) will confirm down trend resumption.
USD/JPY Mid-Day Outlook
Daily Pivots: (S1) 148.12; (P) 149.15; (R1) 149.91; More...
Intraday bias in USD/JPY is back on the downside with break of 148.08 temporary low. Fall from 158.86, as the third leg of the corrective pattern from 161.94 high, has resumed. Sustained break of 61.8% retracement of 139.57 to 158.86 at 146.32 will pave the way back to 139.57 low. On the upside, 149.32 minor resistance will turn intraday bias neutral and bring consolidations again, before staging another fall.
In the bigger picture, price actions from 161.94 are seen as a corrective pattern to rise from 102.58 (2021 low). In case of another fall, strong support should be seen from 38.2% retracement of 102.58 to 161.94 at 139.26 to bring rebound. However, sustained break of 139.26 would open up deeper medium term decline to 61.8% retracement at 125.25.
US initial jobless claims fall to 221k, vs exp 236k
US initial jobless claims fell -21k to 221k in the week ending March 1, below expectation of 236k. Four-week moving average of initial claims rose 250 to 224k.
Continuing claims rose 42k to 1897k in the week ending February 22. Four-week moving average of continuing claims rose 3k to 1866k.