Sample Category Title
USD Stumbles, CAD Retail Sales Drop
The US dollar retreated Thursday after a week of gains as hawkish talk was brushed aside. The yen was the top performer while the US and Canadian dollars lagged. A new Premium trade will be issued ahead of the Asia Friday trade session. It will be the 3rd index trade.
Goldman Sachs grabbed headlines (but not markets) with a note on Thursday suggesting the FOMC could hike rates five times this year and FOMC speakers underscored the strong economy. But bonds weren't impressed and 10-year yields retreated back to 2.92%.
The market dabbled with the hawkish talk before having second thoughts. The yen led the way and USD/JPY dropped to 106.68 from 107.78. The move nearly erased two days of gains and underscored the downtrend in the pair and the struggles of the US dollar more broadly.
Struggling right alongside USD was CAD. Another round of NAFTA talks begins Feb 25 and the market is reluctant to buy the loonie until there is some sense of clarity on the trade deal. In addition, the economy continues to send mixed signals.
Canadian December retail sales dropped 0.8% compared to a flat reading expected. Ex autos was even worse at -1.8% compared to the +0.3% consensus. The loonie initially tumbled but got back on its feet.
Odds of a March BoC hike fell to 9% but the April meeting is at 49%. That's down from 54% before the data but it's still too high. The BOC wants a resolution on NAFTA and wants to see the effects of prior hikes before making another move. A key loonie factor will be inflation data on Friday. The CPI is forecast to rise just 1.5% y/y, down from 1.9% in December but the trend in core numbers will be key as well.
Before that – at 2350 GMT – Japan will also be looking at CPI numbers. Headline inflation is forecast to rise to 1.3% y/y from 1.0% but core is expected to rise just 0.3% y/y.
Do Concerns about US Twin Deficits Justify the Dollar’s Increasingly Bearish Outlook?
As the US government looks to raise $258 billion in Treasury auctions this week, the risk from a ballooning US deficit is weighing on investors' minds as concerns grow about the sustainability of the worsening fiscal shortfall in the United States. The prospect of a burgeoning budget deficit comes at a time when the country's trade balance has also been deteriorating in recent months. More worryingly, it is occurring against the backdrop of an economy that is at a late stage in the business cycle with limited spare capacity left to absorb.
These concerns, along with expectations that other central banks around the world will this year start catching up with the Federal Reserve in tightening monetary policy, have been weighing on the US dollar, even as the growth and inflation outlooks improve.
The Republican tax plan, which finally completed its passage through Congress at the end of 2017, may have been a boon for the stock market but appears to have had unintended consequences on the greenback. Investors have been fretting about the $1.5 trillion cost of the tax package over the next decade. Making matters worse, Congress this month approved a $300 billion spending bill over the next two years, further increasing the country's debt burden.
The $300 billion government funding bill triggered the dollar's latest downtrend, which hit a three-year low against a basket of currencies on February 16. It also pushed Treasury yields higher, with the 10-year yield this week hitting a near four-year high of 2.957%. The surge in borrowing costs created panic in equity markets, leading to massive losses in major stock indices on Wall Street and around the world. Although volatility in stocks has eased substantially over the past week, it is unclear whether the late 2017 / early 2018 rally will be able resume anytime soon.
Markets are likely to remain on edge until the March 20-21 FOMC meeting when new Fed Chair Jerome Powell will make his debut post-meeting press conference. Apart from getting the first proper glimpse of Powell's views on monetary policy, investors will also be looking to the Fed's updated economic projections for any adjustments to the expected rate hike path.
The Fed is almost certain to take a more hawkish tone at its next meeting as recent wage growth and CPI data has pointed to an uptick in inflationary pressures. The question is whether the Fed will go as far as raising the number of anticipated rate increases to more than the present three hikes. Powell, who has only been in the job for a few weeks, will have a tough job on his hands as whichever way the Fed decides to respond to the recent developments in economic indicators and the stock market volatility will risk upsetting the markets.
If the Fed tilts towards an overly hawkish view with the intention to counter the fiscal boost with more aggressive monetary tightening, this could drive Treasury yields even higher and frighten investors out of stocks again. But maintaining a cautious stance runs the risk of fuelling the equities rally as well as boosting household spending further. The latter scenario is perhaps what markets should be warier of as high domestic consumption would only add to the rising trade deficit. The US trade shortfall in goods and services hit the highest in nine years in December 2017.
Worsening deficits in the government budget and trade balance have the potential to lead to a dollar crisis. The soaring 'twin' deficits could send alarms about the ability of the US to finance its debt, risking a collapse in the value of the dollar. This could explain why investors have grown increasingly negative on the greenback despite the stronger growth outlook and signs that inflation is beginning to accelerate.
However, when considering the dollar's status as a global reserve currency and the US's self-sufficiency in food and energy, which would limit any dramatic rise in the trade deficit, a currency crisis does not appear very probable. Plus, export-dependent nations such as China and Japan would never support a plunge in the value of the world's most traded currency. A better explanation for the greenback's persisting weakness is the brightening prospect of the world economy.
Historically, the US currency tends to depreciate when other economies are doing well. The dollar has a tendency to rise against other currencies when their economies are underperforming due to the safe-haven appeal of US Treasuries and other dollar-denominated assets. This could be one reason why the dollar appreciated sharply during 2014-2016 as the US economy stood out for being among the few healthy ones in the G20 while growth in Japan and the Eurozone stuttered. Moving into 2017, growth in the US remained strong but other economies started to regain momentum, reducing the US's relative attractiveness.
Another likely contributor to the dollar bearishness is uncertainty related to the Trump administration. Donald Trump's presidency may have brought in large tax cuts and economic optimism, but his administration has also spawned concerns about trade protectionism and doubts about the official strong dollar policy, as well as the constant uncertainty about the ongoing Mueller investigation into possible Russian collusion with Trump's election campaign team.
The aforementioned tie in with the dollar index's downtrend, which started at the beginning of 2017. But even if we were to assume that the twin deficits argument is not a major factor for the recent acceleration in the year-long dollar sell off, the potential risk from a surging national debt burden should not be downplayed. The debt-to-GDP ratio is already above 100% (having crossed above it in 2012) and the budget deficit in 2017 rose to 3.4% in 2017. Apart from being one of the highest among advanced economies, a deficit of 3.4% after eight years of economic expansion and an unemployment rate of 4.1% is very unusual.
The US budget deficit normally has a positive correlation with the unemployment rate as the government's finances worsen when the jobless rate rises, and they improve when the number of unemployed falls. But this relationship appears to have been broken since 2015, with the deficit moving back up again after dropping from the excessive levels seen during the financial crisis, while the unemployment rate has continued to fall. This highlights the significance of how out of sync the rising deficit potentially is at this stage of the economic cycle. Just to put it into another perspective, a recent report by Moody's put the proportion of US government revenue used to service the debt at 8.1%, second only to Italy. This is projected to increase to 21.4% by 2027, signalling a ticking time bomb in the future, if not for the next few years.
AUDUSD Stands Below 23.6% Fibonacci Level; Ascending Move in Medium-Term Holds
AUDUSD has reversed back down again after finding resistance at the 0.7990 resistance level achieved last week. Also, the price slipped below the 23.6% Fibonacci retracement level at 0.7826 of the up-leg with the low of 0.6820 and the high of 0.8100 in the medium-term timeframe during yesterday's session.
The downside pressure seems to be stronger, while the technical indicators are endorsing the bearish scenario. From the technical point of view, in the short-term timeframe, the stochastic oscillator is approaching the oversold territory, while the MACD oscillator is moving slightly lower below the zero line. Additionally, the 20-day simple moving average is ready to post a bearish crossover with the 40-day SMA, indicating bearish pressure.
If the price remains below the 23.6% Fibonacci mark could, it could extend the losses towards the 0.7730 – 0.7755 support level. If the aforementioned area breached could open the way for the 38.2% Fibonacci level near 0.7635.
In the event of an upside movement, the next resistance to have in mind is the 0.7990 barrier. It is worth mentioning that AUDUSD has been developing within an ascending move since January 2016 and tested several times the diagonal line without slipping below it.
Canadian Retail Sales Pulled Back in December
Highlights:
- Retail sales fell 0.8% in both nominal and volume terms in December. The decline wasn't exactly broadly-based with 6 of 11 subsectors recording declines.
- Sales at electronics and appliance stores fell 9% after a double digit gain in November that reflected Black Friday sales as well as a new product launch.
- E-commerce sales were up just 4% from a year ago in December, though for 2017 as a whole online retailers saw a 30% jump in sales.
- Today's data provides the last partials for December GDP, which we expect rose by 0.1%. That remains consistent with our forecast for annualized growth of 1.9% in Q4/17.
Our Take:
Retail sales fell by 0.8% in December to retrace about half of the increase seen in the previous two months. That has become a familiar pattern with holiday sales also being pulled forward in 2015 and 2016—a trend the seasonal adjustment process has been slow to catch up with. For the quarter as a whole, retail sales volumes were up an annualized 3.8%, supporting our forecast for consumer spending to have increased by slightly more than 2% in Q4/17. While still a healthy increase, that would be down from average gains of 4% in the prior four quarters. We think Q4's more moderate pace of consumer spending will continue in 2018 as higher interest rates and slower employment growth leave households with a bit less spending money, even as rising wages provide some offset. Along with slower demand growth, retailers continue to face cost pressures, including higher minimum wages in some provinces, as well as increased competition from online sellers. 2017 was a strong year for the sector with sales volumes rising at their fastest pace since 2004, but we doubt the feat will be repeated this year.
EURUSD May Extend Correction Towards 1.20 on Hawkish Fed and Benign ECB
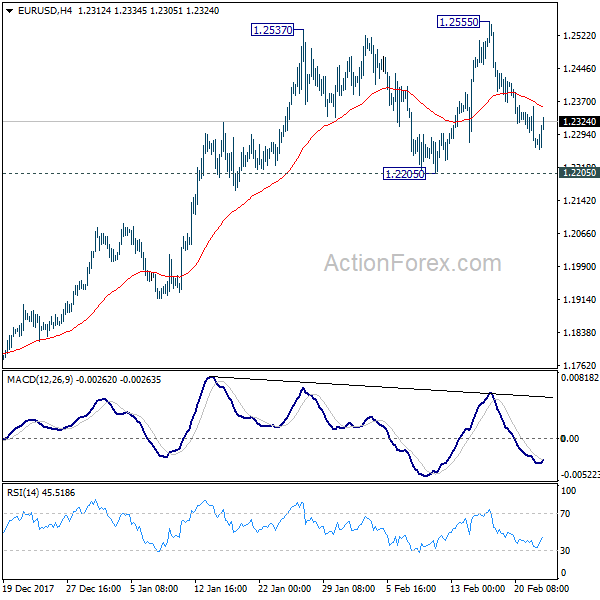
The Euro extended recovery on Thursday to 1.2352 but remains under initial barrier at 1.2361 (10SMA).
Profit-taking after four-day fall may boost the Euro further but no stronger recovery is seen.
Hawkish Fed minutes yesterday added to the greenback's recent bullish sentiment while mild tone from the minutes of ECB's latest policy meeting is expected to keep the Euro at the back foot.
That suggest that corrective phase from recent tops at 1.2537/55 may extend. Violation of key near-term supports at 1.2205 (09 Feb low which also marks the bottom of month-long range) and 1.2173 (Fibo 38.2% of Nov/Feb 1.1553/1.2555 ascend) would be strong bearish signal.
The pair is holding within the range and requires stronger signal which will be generated on break out of congestion and will also confirm double top, which would be good reversal signals.
Stronger bearish acceleration on break through 1.2205/1.2173 triggers would look for extension towards psychological 1.20 support.
Selling upticks remains favored near-term scenario, with upticks to be capped by 20SMA at 1.2372 (also Fibo 38.2% of 1.2555/1.2259 bear-leg.
Res: 1.2359; 1.2372; 1.2442; 1.2485
Sup: 1.2259; 1.2235; 1.2205; 1.2173

Elliott wave Analysis: USDJPY Can See Support Around 106.10/106.45
USDJPY turned to the downside yesterday, away from 107.89 high where a double top was found for black wave A. Current reversal can now be in five minor waves for blue sub-wave a as part of a three-wave pullback. Once sub-wave a unfolds, a new temporary correction as wave b may follow, followed by a new drop into final leg c of B. On that note the whole corrective decline from 107.9 level can find support near the 106.10/106.45 area.
USDJPY, 1H
Sunset Market Commentary
Markets:
Global core bonds trade with an upward intraday bias, but gains remain limited. The Bund opened significantly below yesterday's official close in a catch-up move with the US Treauries' sell-off after hawkish FOMC Minutes. The Bund caught more intraday momentum when stocks dived lower on a bigger-than-expected setback in the German Ifo-indicator. It's the third such negative surprise this week after German ZEW and German/EMU PMI. All three indicators remain near historically high levels though. US weekly jobless continue to hover near multi-decade lows, confirming strength on the US labour market. Minutes of the previous ECB meeting showed that "Some members expressed a preference for dropping the easing bias regarding the APP programme from the governing council's communication as a tangible reflection of reinforced confidence in a sustained adjustment in the path of inflation". Markets didn't react, but it highlights the possibility of changes to the ECB's communication at the March meeting. Changes on the German yield curve range between -1.2 bps and 1.5 bps across the curve. US yields decline by 0.8 bps (2-yr) to 3.5 bps (10-yr). Peripheral bonds underperformed today, with Portuguese and Italian spreads adding 5 bps.
US yields and the dollar rose yesterday evening as the Minutes of the January Fed meeting reinforced market expectations that the Fed will continue policy normalization this year. However, both moves stalled today. The Ifo Business Climate indicator declined more than expected in February, in line with yesterday's EMU PMI's, but the report still indicates strong growth at the start of 2018. German yields declined after the release, but so did US ones. In the end, interest rate differentials were little changed. The reaction of the euro was negligible. With little other high profile news on the agenda, this week's USD rebound did ran into resistance. US jobless claims printed at 222 000, near the cycle low, but it didn't help the dollar. EUR/USD trades in the 1.2330 area. USD/JPY dropped back below the 107 handle (currently 106.80). This evening, FX traders will also keep an eye at the US 7-yr Treasury auction. However, after yesterday's decent outcome of the sale of 5-yr bonds, the risk of a sharp rise in US yields has probably eased. For the dollar, some more consolidation might be on the cards short-term.
Sterling traded with a tentative negative bias against the euro today. UK Q4 growth was downwardly revised to 0.4% Q/Q from and initial estimate of 0.5. Q4 2017 data are a bit old news for markets. The reaction of sterling was limited. The report raises questions whether the BoE should consider raising rates in the near future as BoE's Carney suggested of late. EUR/GBP gained a few ticks in the 0.88 big figure this morning, but the pair trades currently again in the 0.8840/50 area. In a broader perspective, sterling is still going nowhere as markets await more clarity on the Brexit approach of the UK government. Cable hovers in the 1.3940 area as the recent USD rally slows.
News Headlines:
German IFO business confidence declined more than expected in February from 117.6 to 115.4, the lowest level in 5 months. Still, the index stays at a high level, suggesting that Europe's biggest economy is set for solid growth despite a stronger euro clouding the outlook of exporters.
UK growth slowed more than expected at the end of last year. UK GDP rose only 0.4% Q/Q in Q4. Business investment and the contribution of net foreign trade to growth disappointed. The downward revision of Q4 growth (from 0.5%) also reduced the UK growth performance for the whole of 2017 to 1.7%, the slowest pace since 2012.
Canadian retail sales unexpectedly declined 0.8% M/M in December after climbing for the past three months as a pullback at electronics and appliance stores offset higher purchases of new cars. The consensus estimate forecasted a rise of 0.2%. The Canadian dollar weakened after the publication of the release. USD/CAD rebound north of 1.27.
NZDUSD Creates Double Top Formation at 0.7435; Bearish Move is Expected
NZDUSD is trading lower over the last four days after it created a double top at the 5-month high of 0.7435 on February 16. The double top reversal is a bearish pattern indicating further losses on the price action. When looking at the bigger picture the pair lacks a clear trend since it has been consolidating within 0.7175 – 0.7435 after its rally from 0.6780 stalled at 0.7435.
In the 4-hour chart, momentum indicators are also pointing to a continuation of the bearish bias. The MACD oscillator is standing below the trigger line in the bullish zone, suggesting a further downward correction. Also, the stochastic oscillator is moving lower approaching the oversold zone after it posted a bearish cross within its moving averages.
If prices extend to the downside, immediate support could come from the 23.6% Fibonacci retracement level of 0.7270 of the upleg from 0.6820 to 0.7435. Below that, the price could hit the 0.7175 support, which is the 38.2% Fibonacci mark. An aggressive drop below the latter level could confirm the bearish pattern and open the door to the 50.0% Fibonacci level of 0.7100.
On the flip side, in the event of an upside reversal, the next level to watch is the aforementioned 5-month high obstacle. A break above this level could see a re-test of the 0.7560 high taken from the peak on July 27.
A Soft End to an Otherwise Strong 2017 for Canadian Retail Sales
Retail sales fell 0.8% in December in both value and volume terms. Despite this soft showing, sales rose 6.7% in 2017 as a whole, the strongest annual performance since 1997.
December sales fell in 6 of 11 major sectors, with the declines led by general merchandise stores (-5.3% m/m), health/personal care stores (-3.8%), and electronics and appliance stores (-9.1%). Conversely, sales at motor vehicle and parts dealers grew 2.1% on strength in new car sales, while spending at food and beverage stores rose 1.4%. As usual, e-commerce saw a strong performance, up 4.1% year-on-year on a seasonally unadjusted basis, outpacing the 3.2% y/y climb in overall retail sales.
On a provincial basis, sales declines were reported in 5 of the provinces. Ontario (-1.6%), Manitoba (-1.4%), Alberta (-0.5%) and B.C. (-0.6%) led the way lower.
Key Implications
Bah humbug! It seems that Canadians were once again stingy this past holiday season, as December retail sales volumes fell for a third straight year. The December numbers are only part of the story however, with prior months' sales revised upwards, perhaps reflecting a shift in shopping habits that may not be fully reflected in the seasonal adjustment – sales volumes for the quarter as a whole rose at a respectable 3.8% annualized pace. All told, too much should not be read into a single month's performance of this volatile series, and we continue to look for a roughly 2% (annualized) gain in fourth quarter GDP to close out the year.
Looking ahead, healthy aggregate income gains should support consumer spending going forward, but the strong gains in the first half of 2017 that led to the best sales performance of the past two decades are not expected to be repeated any time soon. The tailwind of income growth will be fighting against rising borrowing costs for already highly indebted households and near-term adjustments in key housing markets. The net result will likely be a more moderate growth of consumer spending in 2018.
Taking the Bank of Canada's perspective, today's report isn't likely to move the needle. More important will be what occurs over the coming months, as the impacts of mortgage underwriting changes and three policy rate hikes continue to work their way through the economy, while external risks remain. A wait and see approach to confirm that the Canadian economy remains on solid footing still favours July as the likely target for the next rate hike.
EUR/USD Mid-Day Outlook
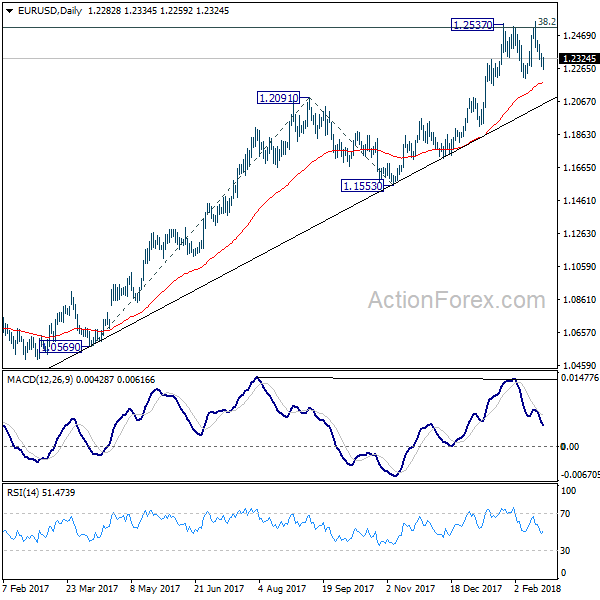
Daily Pivots: (S1) 1.2255; (P) 1.2307 (R1) 1.2335; More....
Intraday bias in EUR/USD remains neutral at this point as it's staying in range of 1.2205/2555. On the upside, break of 1.2555 will revive the bullish case of up trend resumption and target 100% projection of 1.0569 to 1.2091 from 1.1553 at 1.3075. However, break of 1.2205 will confirm rejection by 1.2516 key fibonacci level and trend reversal.
In the bigger picture, key fibonacci level at 38.2% retracement of 1.6039 (2008 high) to 1.0339 (2017 low) at 1.2516 remains intact despite attempts to break. Hence, rise from 1.0339 medium term bottom is still seen as a corrective move for the moment. Rejection from 1.2516 will maintain long term bearish outlook and keep the case for retesting 1.0039 alive. However, sustained break of 1.2516 will carry larger bullish implication and target 61.8% retracement of 1.6039 to 1.0339 at 1.3862.