
Sample Category Title
EUR/AUD Daily Outlook
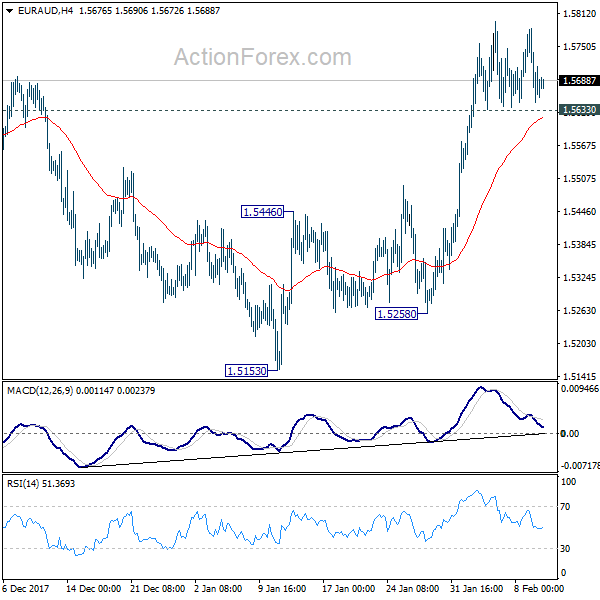
Daily Pivots: (S1) 1.5619; (P) 1.5701; (R1) 1.5756; More....
No change in EUR/AUD's outlook. Further rise is expected as long as 1.5633 minor support holds. Sustained trading above 1.5770 will confirm resumption of medium term rise from 1.3264. In that case, EUR/AUD should target 1.6587 key long term resistance. However, below 1.5633 minor support minor support will dampen this bullish case and turn bias to the downside.
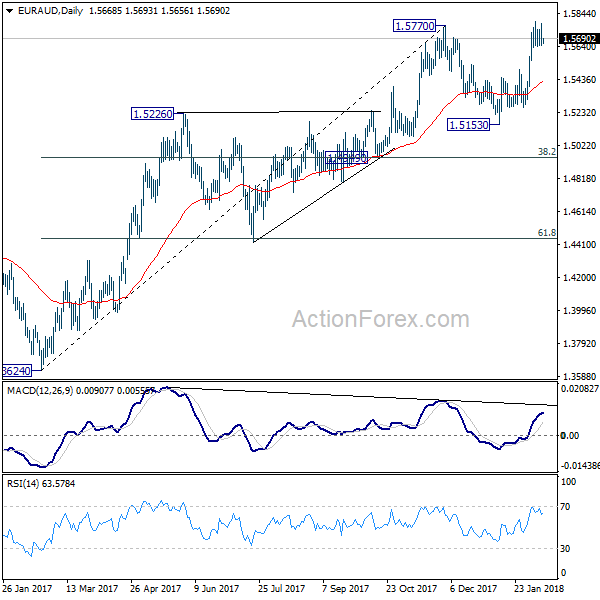
In the bigger picture, medium term rise from 1.3624 is not completed yet. Break of 1.5770 will extend the rise to retest 1.6587 (2015 high). However, considering bearish divergence condition in daily MACD, sustained break of 1.4949 cluster support (38.2% retracement of 1.3624 to 1.5770 at 1.4950) will indicate medium term reversal. And there is prospect of retesting 1.3624 low in that bearish case.
EUR/GBP Daily Outlook
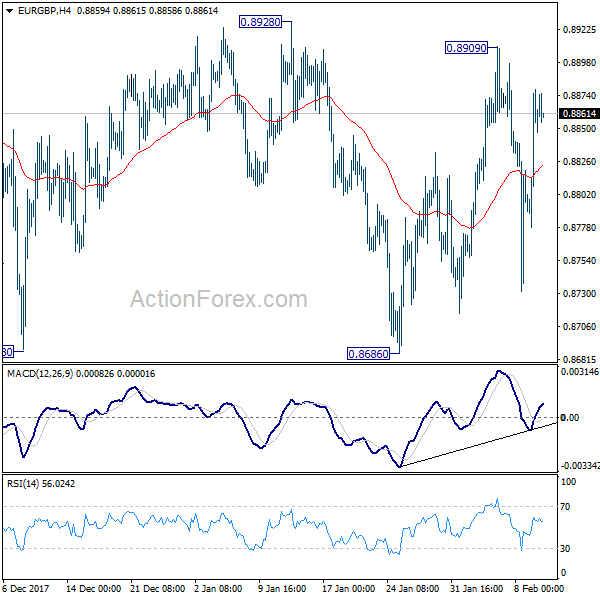
Daily Pivots: (S1) 0.8798; (P) 0.8838; (R1) 0.8899; More...
Intraday bias in EUR/GBP remains neutral as range trading continues. Near term outlook will remain mildly bearish as long as 0.8928 resistance holds. On the downside, firm break of 0.8686 will resume whole decline from 0.9305. As 61.8% retracement of 0.8312 to 0.9305 should then be taken out too. Deeper decline would be seen to retest 0.8303/8312 support zone. Nonetheless, on the upside, break of 0.8928 will indicate near term reversal and turn outlook bullish for 0.9304 resistance.
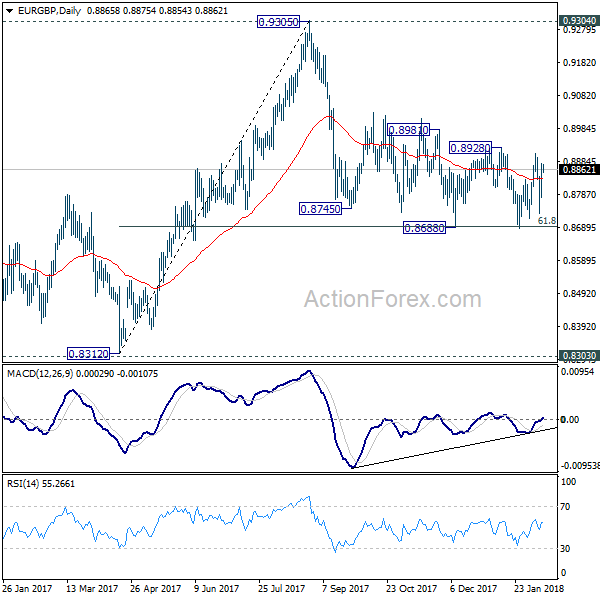
In the bigger picture, there are various ways to interpret price actions from 0.9304 high. But after all, firm break of 0.9304/5 is needed to confirm up trend resumption. Otherwise, range trading will continue with risk of deeper fall. And in that case, EUR/GBP could have a retest on 0.8303. But we'd expect strong support from 0.8116 cluster support (50% retracement of 0.6935 to 0.9304 at 0.8120) to contain downside.
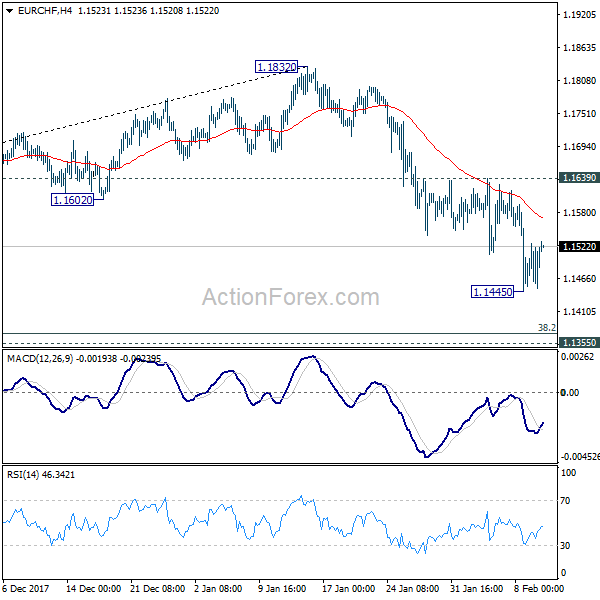
EUR/CHF Daily Outlook
Daily Pivots: (S1) 1.1460; (P) 1.1493; (R1) 1.1538; More...
Intraday bias in EUR/CHF is turned neutral with a temporary low in place at 1.1445. Deeper decline is expected as long as 1.1639 resistance holds. Below 1.1445 will extend the corrective fall from 1.1832 to 1.1355 cluster support (38.2% retracement of 1.0629 to 1.1832 at 1.1372.) At this point, we'd expect strong support from there to contain downside and bring rebound.
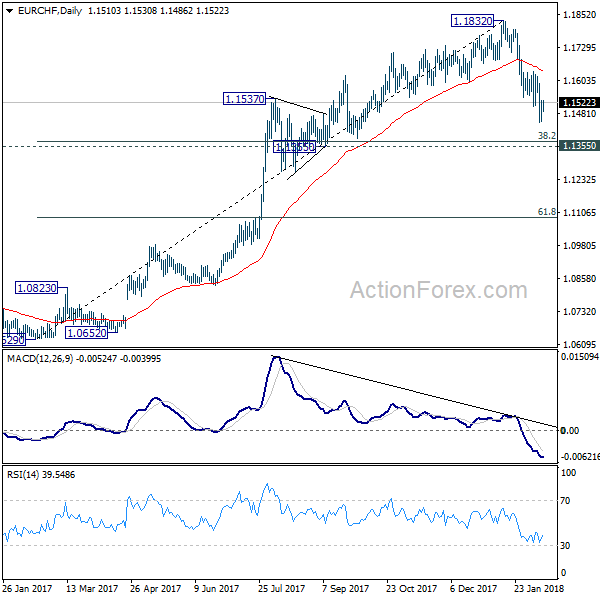
In the bigger picture, a medium term top should be in place at 1.1832 on bearish divergence condition in daily MACD. But there is no indication of long term reversal yet. As long as 1.1198 resistance turned support holds, we'd still expect another rise through prior SNB imposed floor at 1.2000.
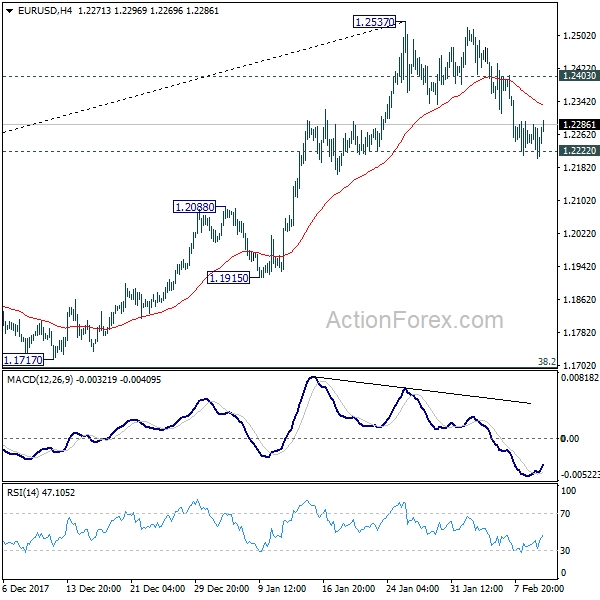
EUR/USD Daily Outlook
Daily Pivots: (S1) 1.2208; (P) 1.2248 (R1) 1.2290; More....
EUR/USD continues to draw support from 1.2222 and recovers today. Intraday bias stays neutral with focus on 1.2222. Sustained break there should confirm rejection from 1.2516 key fibonacci level, as well as near term reversal, on bearish divergence condition in 4 hour MACD. That could also signal completion of medium term up trend from 1.0339. In that case, near term outlook will be turned bearish for 38.2% retracement of 1.0339 to 1.2537 at 1.1697. On the upside, though, above 1.2403 minor resistance will revive bullishness and turn focus back to 1.2537.
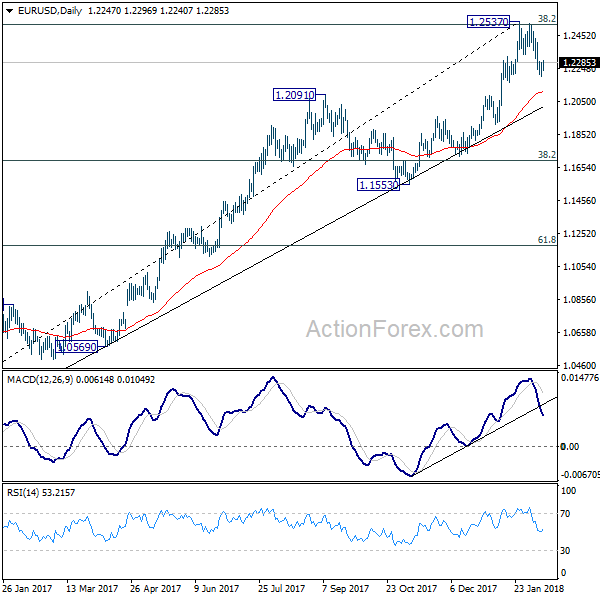
In the bigger picture, key fibonacci level at 38.2% retracement of 1.6039 (2008 high) to 1.0339 (2017 low) at 1.2516 remains intact. Hence, rise from 1.0339 medium term bottom is still seen as a corrective move for the moment. Rejection from 1.2516 will maintain long term bearish outlook and keep the case for retesting 1.0039 alive. However, sustained break of 1.2516 will carry larger bullish implication and target 61.8% retracement of 1.6039 to 1.0339 at 1.3862.
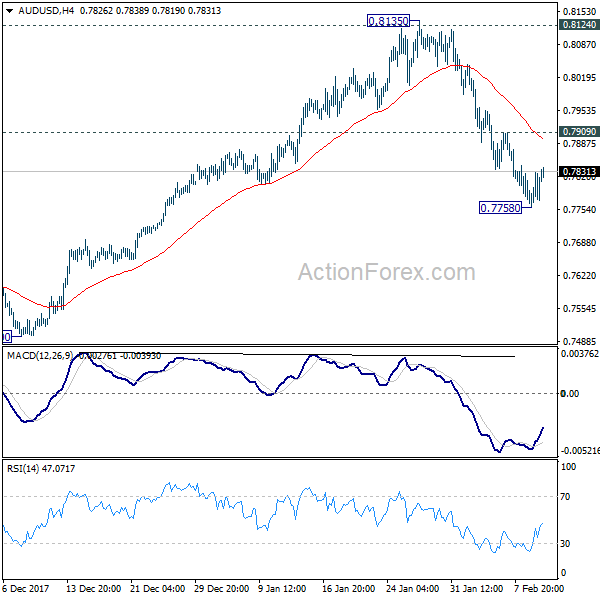
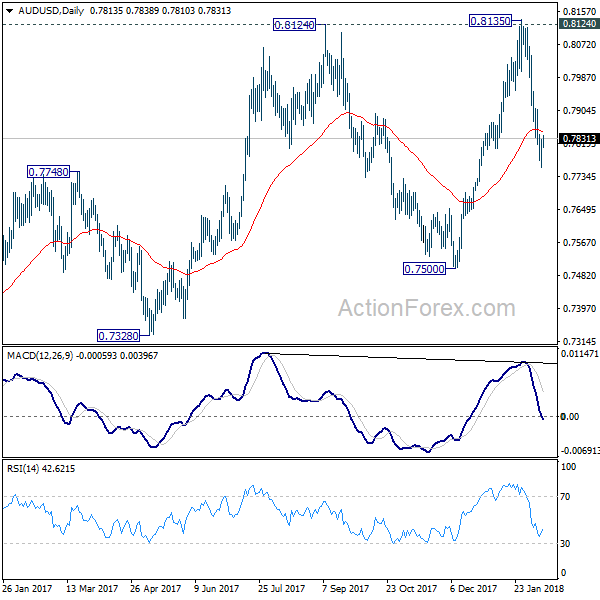
AUD/USD Daily Outlook
Daily Pivots: (S1) 0.7756; (P) 0.7800; (R1) 0.7824; More...
Intraday bias in AUD/USD is turned neutral for consolidation above 0.7758 temporary low. But further decline is expected as long as 0.7909 resistance holds. Below 0.7758 will target 0.7500 key support. At this point, there is no clearly sign of larger trend reversal yet. Hence, we'd look for strong support from 0.7500 to contain downside and bring rebound. On the upside, above 0.7909 minor resistance will turn bias back to the upside for retesting 0.8135 high.
In the bigger picture, medium term rebound from 0.6826 is seen as a corrective move. It might still extend higher but we'd expect strong resistance from 38.2% retracement of 1.1079 to 0.6826 at 0.8451 to limit upside to bring long term down trend resumption. On the downside, break of 0.7500 support will now be an important signal that such corrective rebound is completed.
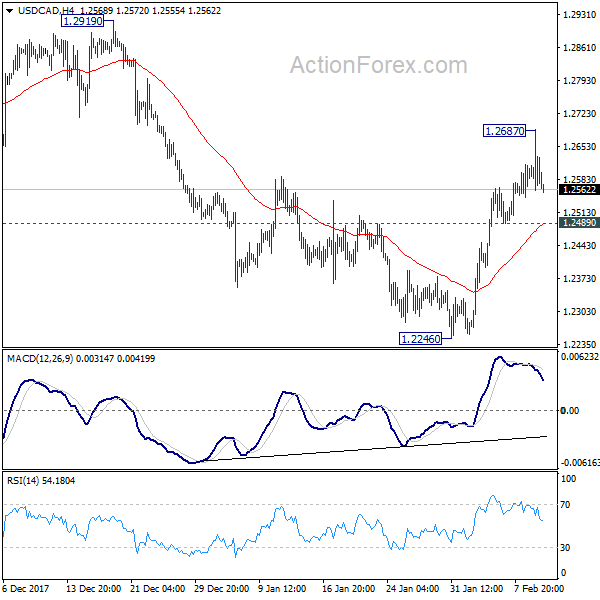
USD/CAD Daily Outlook
Daily Pivots: (S1) 1.2530; (P) 1.2607; (R1) 1.2655; More...
Intraday bias in USD/CAD remains neutral for consolidation below 1.2687 temporary top. Further rise is in favor as long as 1.2489 minor support holds. Above 1.2687 will extend the rise from 1.2246 to 1.2919 resistance next. However, below 1.2489 will turn bias back to the downside for 1.2246 again.
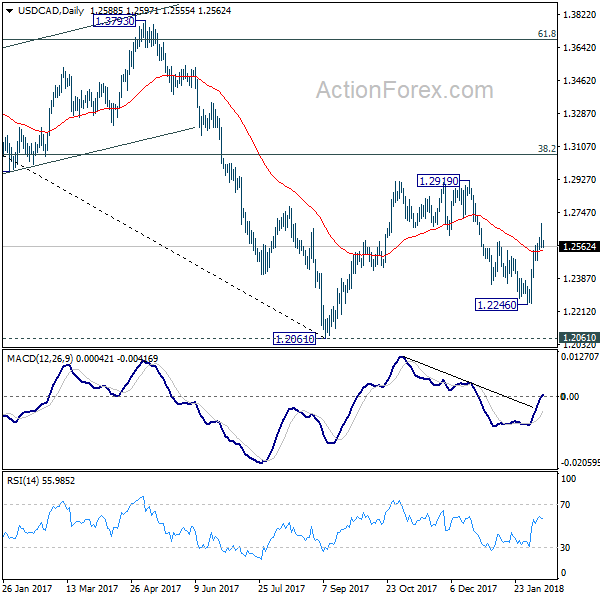
In the bigger picture, the rebound from 1.2246 is mixing up the medium term outlook. Nonetheless, USD/CAD is staying below falling 55 day EMA, hence, the bearish case is in favor. That is, fall from 1.4689 is not completed yet. Sustained break of 1.2061 key support will carry larger bearish implication and target 61.8% retracement of 0.9406 to 1.4689 at 1.1424. However, firm break of 1.2919 will revive the case of medium term reversal and turn outlook bullish.
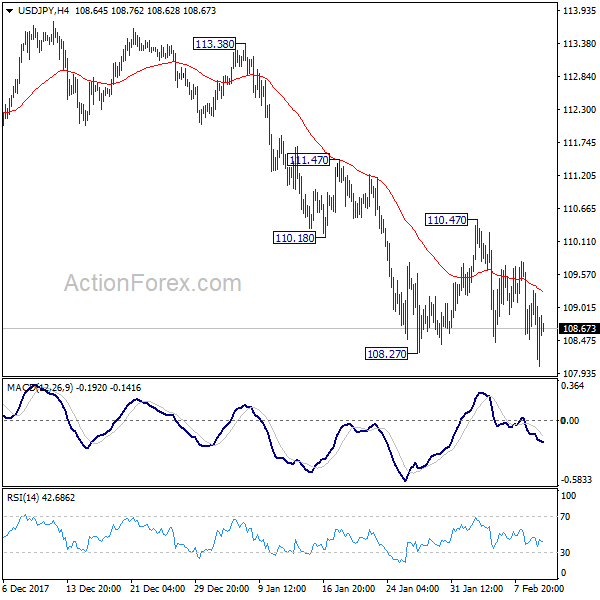
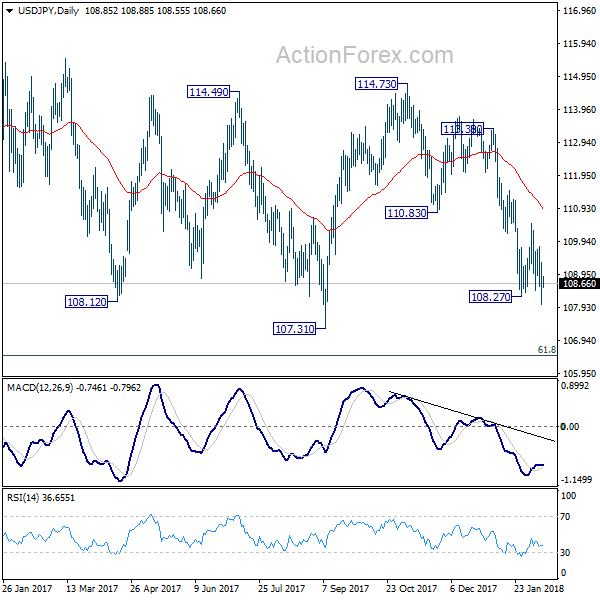
USD/JPY Daily Outlook
Daily Pivots: (S1) 108.10; (P) 108.70; (R1) 109.36; More...
Intraday bias in USD/JPY remains mildly on the downside. The fall from 114.73 has just resumed. It's part of the pattern from 118.65 high and should target 106.48 fibonacci level. On the upside, break of 110.47 resistance is needed to indicate near term reversal. Otherwise, outlook will stay bearish in case of recovery.
In the bigger picture, current development argues that the corrective pattern from 118.65 is extending. There is risk of dropping further to 61.8% retracement of 98.97 to 118.65 at 106.48. But this level should provide strong support to contain downside and bring resumption of rise from 98.97. However, sustained break of 106.48 will now likely send USD/JPY through 98.97 to resume the corrective fall from 125.85 (2015 high).
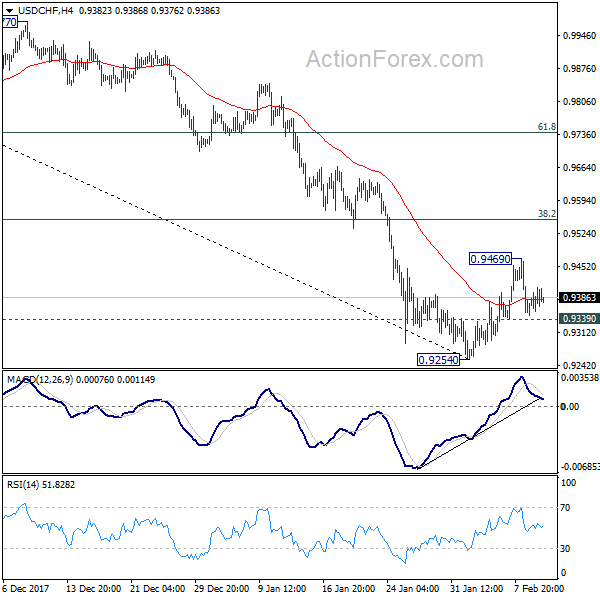
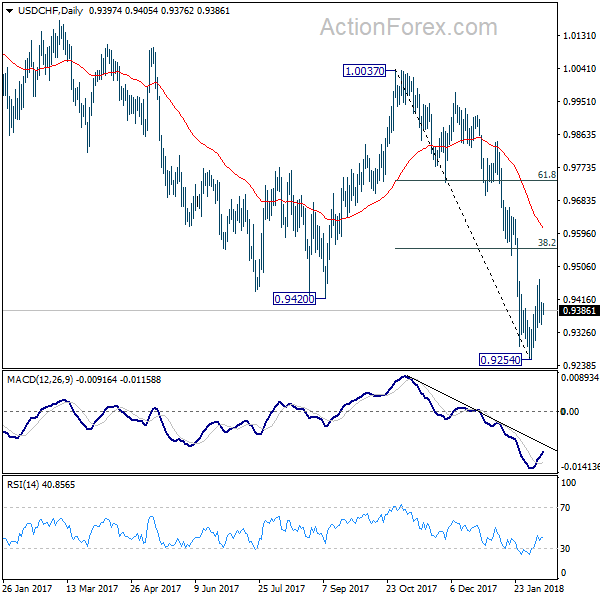
USD/CHF Daily Outlook
Daily Pivots: (S1) 0.9356; (P) 0.9382; (R1) 0.9416; More...
Intraday bias in USD/CHF remains neutral at this point. Also, note that there is no clear sign of trend reversal yet. Therefore, in case of another rise, we'd be cautious on strong resistance from 38.2% retracement of 1.0037 to 0.9254 at 0.9553 to limit upside and bring down trend resumption. On the downside, below 0.9339 minor support will turn bias to the downside for 0.9254. Nonetheless, firm break of 0.9553 will bring stronger rebound to 55 day EMA (now at 0.9616).
In the bigger picture, fall from 1.0342 is developing into a medium term down trend. Deeper decline should be seen to 100% projection of 1.0342 to 0.9420 from 1.0037 at 0.9115. Break will target 161.8% projection at 0.8545. In any case, sustained trading above 55 day EMA is needed to be the first sign of medium term reversal. Otherwise, outlook will stay bearish even in case of strong rebound.
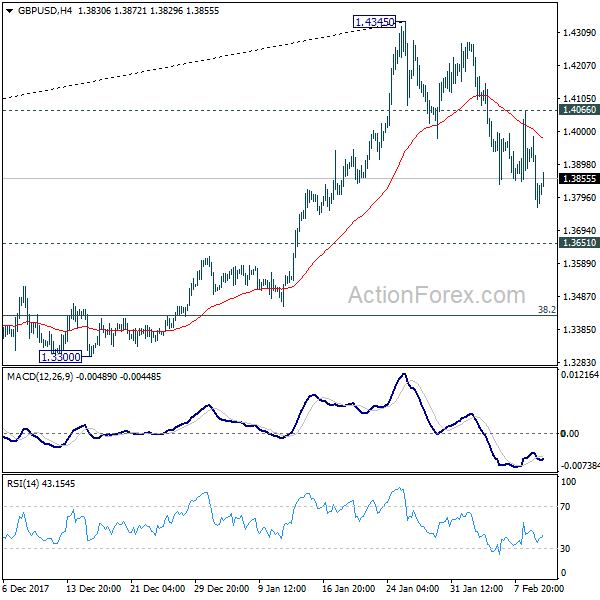
GBP/USD Daily Outlook
Daily Pivots: (S1) 1.3814; (P) 1.3940; (R1) 1.4035; More.....
Intraday bias in GBP/USD remains on the downside as the decline from 1.4345 is still in progress for 1.3651 resistance turned support. At this point, it's still unsure whether decline from 1.4345 is correcting rise from 1.3038, or that from 1.1946, or it's reversing the trend. Break of 1.3651 will turn focus to key fibonacci level at 1.3429. For the moment, further decline will remain expected as long as 1.4066 minor resistance holds.
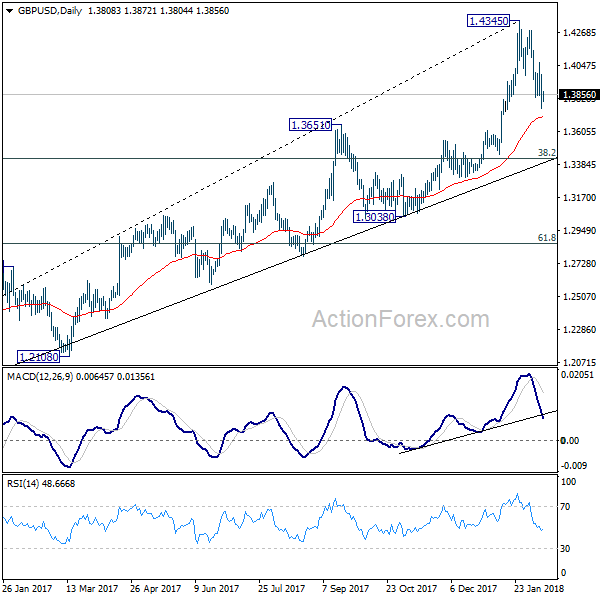
In the bigger picture, as long as 1.3038 support holds, medium term outlook in GBP/USD will remains bullish. Rise from 1.1946 is at least correcting the long term down from 2007 high at 2.1161. Further rally would be seen back to 38.2% retracement of 2.1161 (2007 high) to 1.1946 (2016 low) at 1.5466. However, GBP/USD fails to sustain above 55 month EMA (now at 1.4279 so far. Break of 1.3038 support, will suggests that rise from 1.1946 has completed and will turn outlook bearish for retesting this low.
Can EUR/USD Hold 1.2180-1.2200 Support?
Key Highlights
- The Euro started a fresh downside move this past week and traded below 1.2350 against the US Dollar.
- There was a break below a major bullish trend line with support at 1.2400 on the 4-hours chart of EUR/USD.
- The pair has to stay above the 1.2180-1.2200 support area to avoid further declines.
- The US Wholesale Inventories in Dec 2017 increased 0.4%, compared with the forecast of 0.6%.
EURUSD Technical Analysis
After a decent upside move, the Euro found sellers near the 1.2520 level against the US Dollar. The EUR/USD pair started a fresh downside wave and traded below a key support at 1.2350.
Looking at the 4-hours chart, there was a double top pattern formed around the 1.2520-30 levels. The pair moved down and broke a major bullish trend line with support at 1.2400.
It opened the doors for more declines and the pair traded below the 1.2350 support and settled below the 100 simple moving average (red, 4-hours). The pair even broke the 1.2280 support and traded close to the 1.2200 level.
On the downside, the 1.2180-1.2200 area is a significant support. It acted as a major pivot region on many occasions and it could prevent declines in the near term. Moreover, the 200 simple moving average (green, 4-hours) is also positioned near 1.2180 to act as a support.
If the pair fails to hold the 1.2180 level, there may be further losses towards the next support at 1.2100. On the upside, an initial resistance is around the 23.6% Fib retracement level of the last drop from the 1.2522 high to 1.2205 low.
There is also a bearish trend line with resistance at 1.2300 on the same chart. A push above 1.2300 could take the pair towards the 50% Fib retracement level of the last drop from the 1.2522 high to 1.2205 low at 1.2364.
Today, there is no major economic release lined up in the Euro Zone and the US. Therefore, the market may perhaps follow a consolidation pattern before making the next move.