Sample Category Title
USD/JPY Weekly Outlook
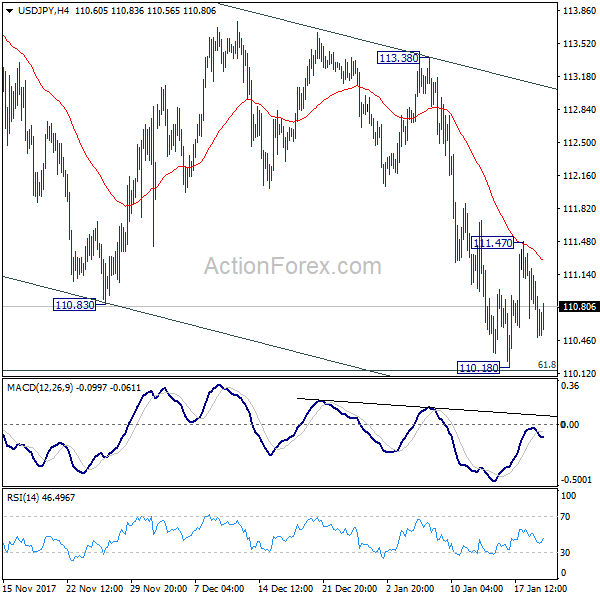
USD/JPY rebounded after hitting 110.18 last week, ahead of 61.8% retracement of 107.31 to 114.73 at 110.14. But such rebound faced strong resistance from 4 hour 55 EMA and retreated. Initial bias is neutral this week first. On the upside, break of 111.47 will affirm the case that correction from 114.73 could have completed with three waves down to 110.18. Intraday bias should then be turned back to the upside for 113.38 resistance for confirmation. However, below 110.18 will extend the correction lower. But we'd again look for bottoming signal in next fall.
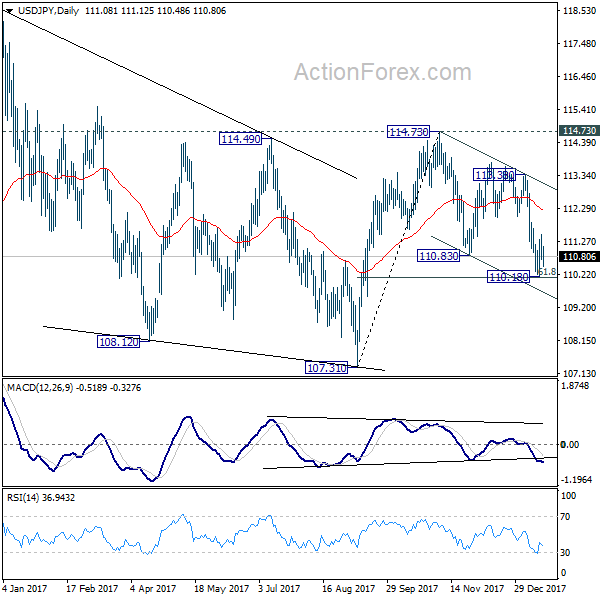
In the bigger picture, we're holding on to the view that correction from 118.65 is completed at 107.31. And medium term rise from 98.97 (2016 low) is going to resume soon. Sustained break of 114.73 should affirm our view and send USD/JPY through 118.65. However, break of 107.31 will dampen this view and extend the medium term fall back to 98.97 low.
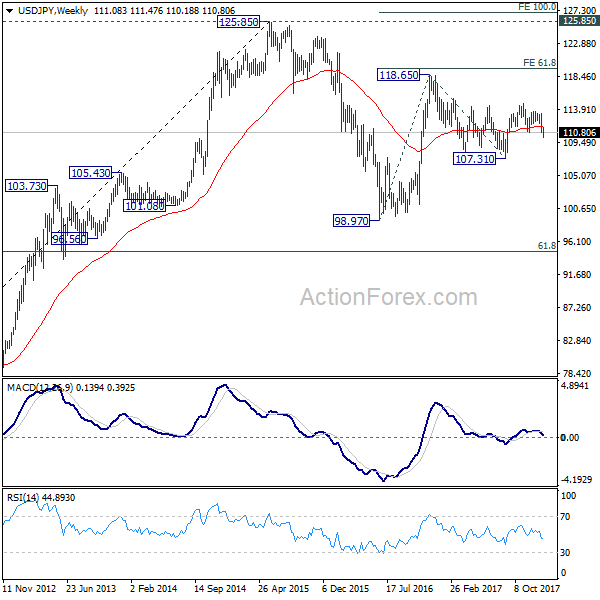
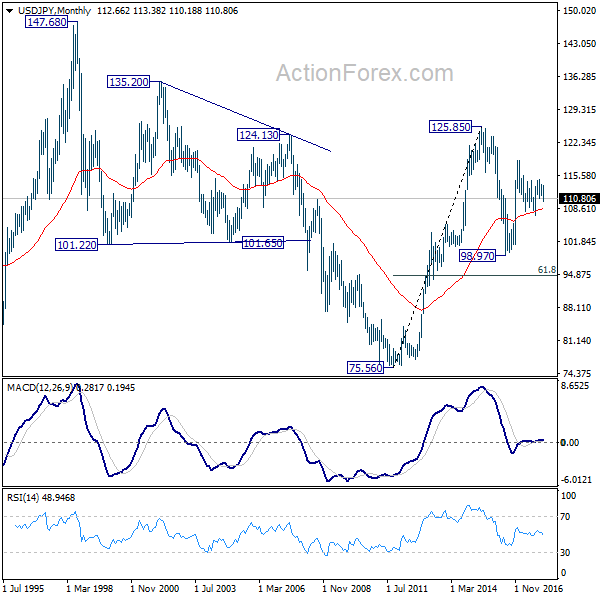
In the long term picture, the rise from 75.56 (2011 low) long term bottom to 125.85 top is viewed as an impulsive move, no change in this view. Price actions from 125.85 are seen as a corrective move which could still extend. In case of deeper fall, downside should be contained by 61.8% retracement of 75.56 to 125.85 at 94.77. Up trend from 75.56 is expected to resume at a later stage for above 135.20/147.68 resistance zone.
GBP/USD Weekly Outlook
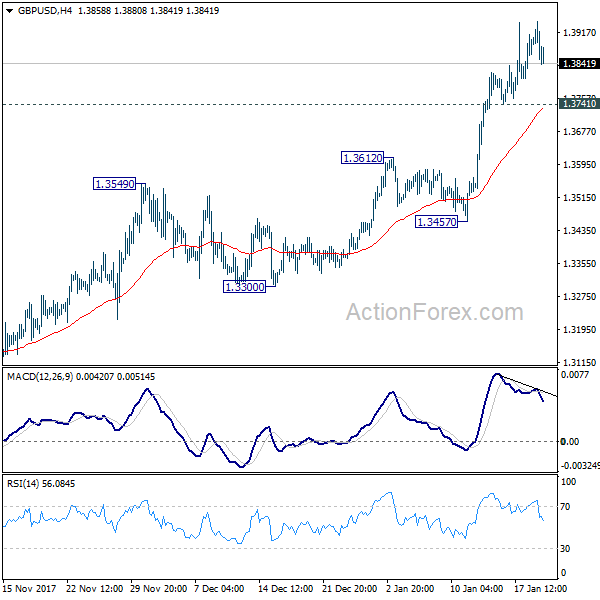
GBP/USD surged to as high as 1.3944 last week and broken 1.3835 key resistance. At this point, the pair seems to be struggling to find follow through buying this level. But still, as long 1.3741 minor support holds, further rally is expected. Sustained trading above 1.3835 could trigger upside acceleration to 100% projection of 1.2108 to 1.3651 from 1.3038 at 1.4581 next. However, on the downside, break of 1.3741 minor support will indicate rejection from 1.3835 and turn bias to the downside for 1.3457.
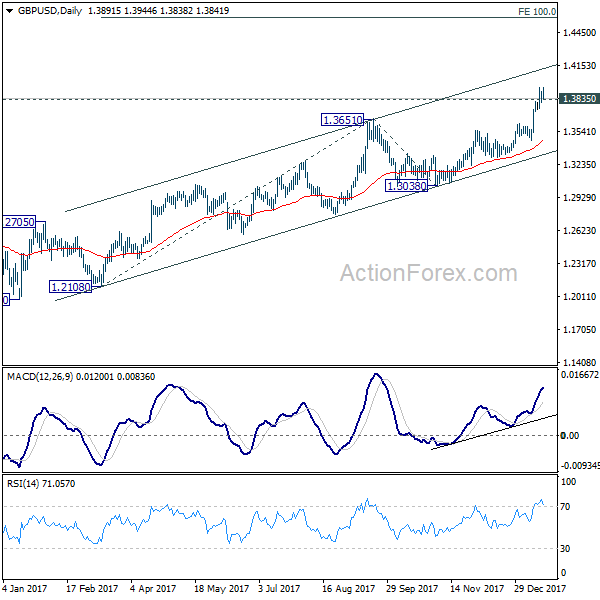
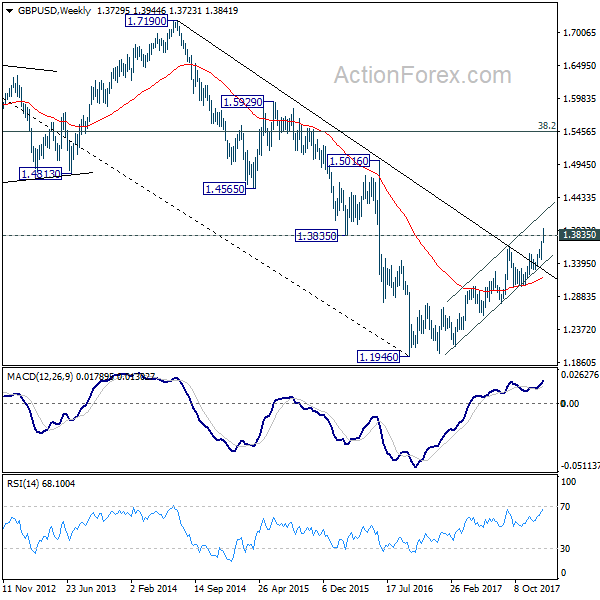
In the bigger picture, sustained break of 1.3835 key resistance level will indicate that rebound from 1.1946 is at least correcting the long term down from from 2007 high at 2.1161. In that case, further rise should be seen back to 38.2% retracement of 2.1161 (2007 high) to 1.1946 (2016 low) at 1.5466. Nonetheless, rejection from 1.3835 will maintain medium term bearishness and thus, the risk retesting 1.1946 ahead.
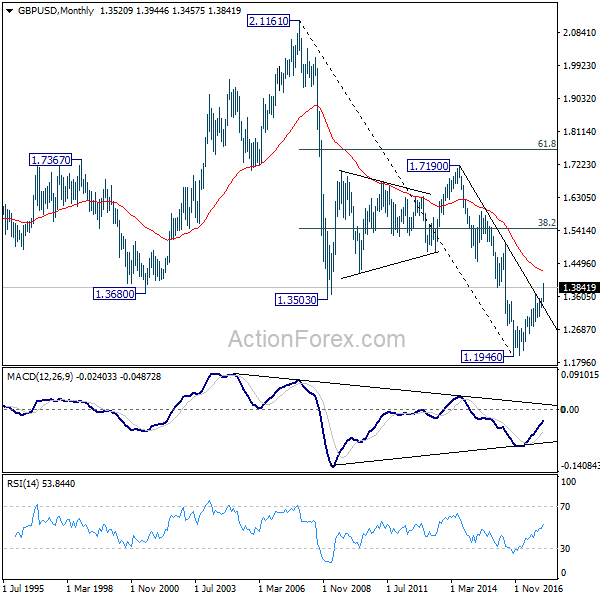
In the longer term picture, long term bullish outlook is starting to get more conviction now. Still, sustained break of 1.3835 resistance is needed to confirm. And in that case, rise from 1.1946 should at least be correction whole long term down trend form 2.1161 and should target 38.2% retracement of 2.1161 (2007 high) to 1.1946 (2016 low) at 1.5466.
USD/CHF Weekly Outlook
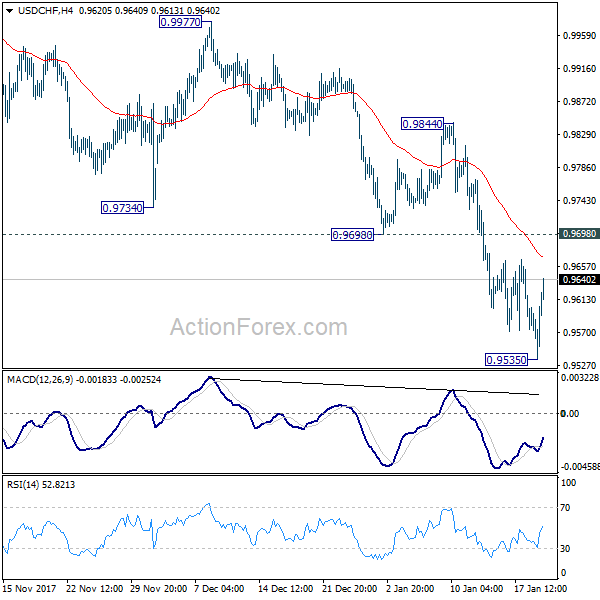
USD/CHF dived sharply to as low as 0.9535 last week but recovered. Initial bias is neutral this week first. Near term outlook will stay bearish as long as 0.9698 resistance holds. Below 0.9535 will extend the fall from 1.0037 and target a test on 0.9420 low. Nonetheless, firm break of 0.9698 will be the first sign of near term reversal. And, intraday bias will be turned back to the upside for 0.9844 resistance for confirmation.
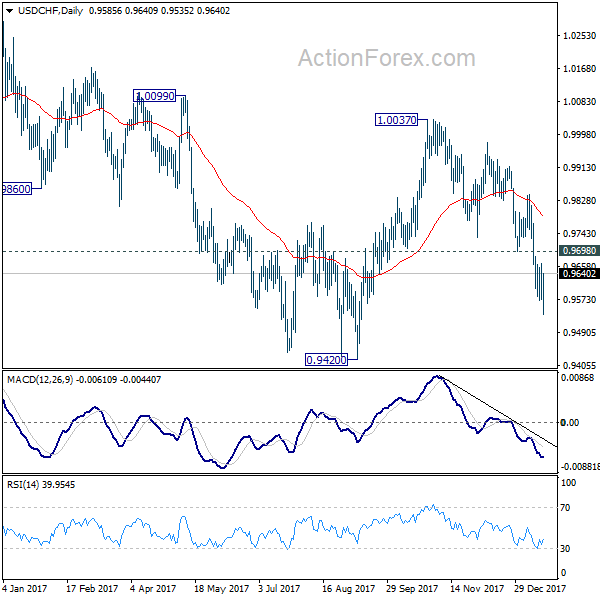
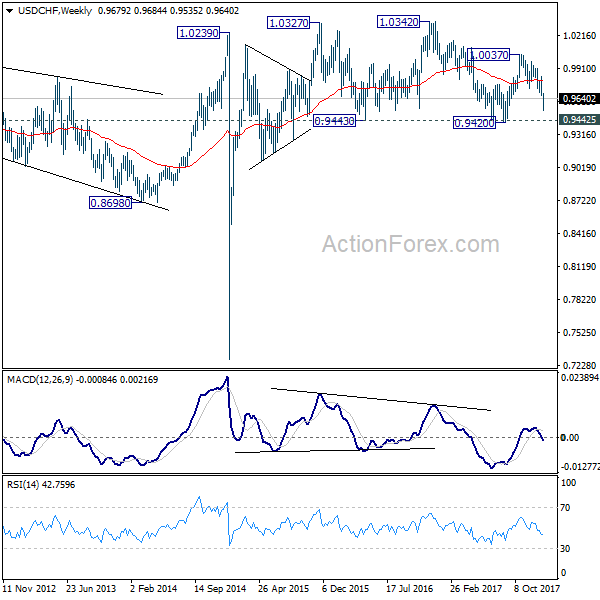
In the bigger picture, range trading continues between 0.9420/1.0342. At this point, 0.9420 appears to be a strong support level. Therefore, in case of decline attempt, we don't expect a firm break of this level. Nonetheless, strong break of 1.0342 is also needed to confirm upside momentum. Otherwise, medium term outlook will stay neutral.
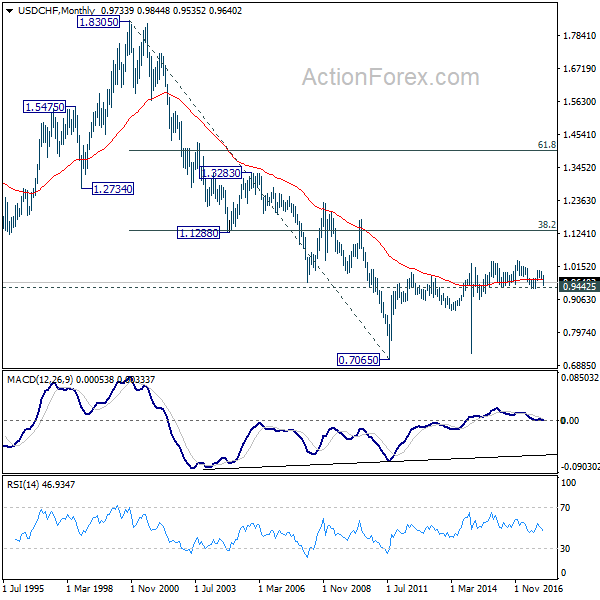
In the long term picture, while upside momentum is unconvincing, with 0.9443 key support intact, rise from 0.7065 (2011 low) is still expected to continue. Break of 1.0342 will target 38.2% retracement of 1.8305 (2000 high) to 0.7065 at 1.1359.
AUD/USD Weekly Outlook
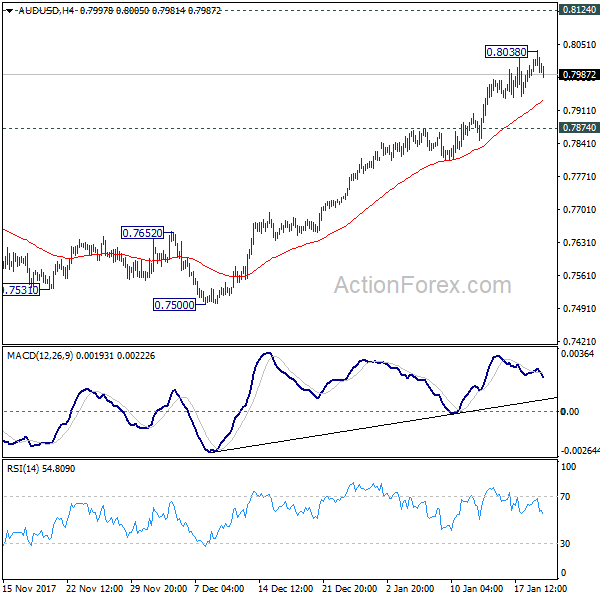
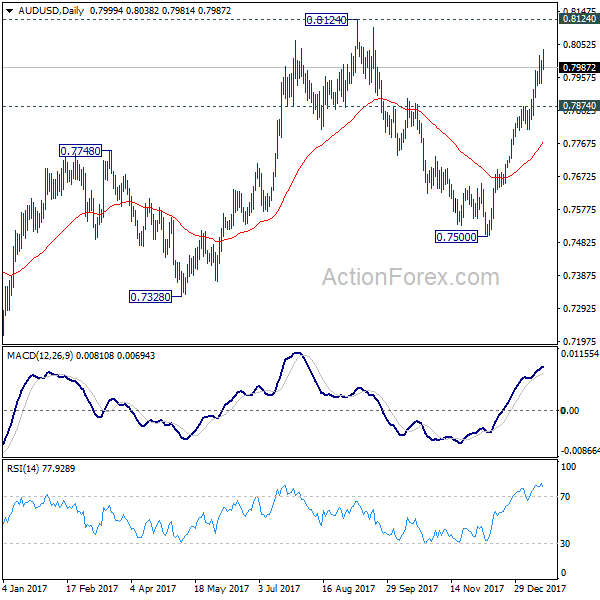
AUD/USD's rise from 0.7500 extended to as high as 0.8038 last week. Outlook is unchanged despite loss of upside momentum. As long as 0.7874 support holds, further rally should be seen to 0.8124 high. Break there will resume whole medium term rebound from 0.6826 and target key fibonacci level at 0.8451. On the downside, break of 0.7874 will indicate short term topping and turn bias to the downside for 55 day EMA (now at 0.7774).
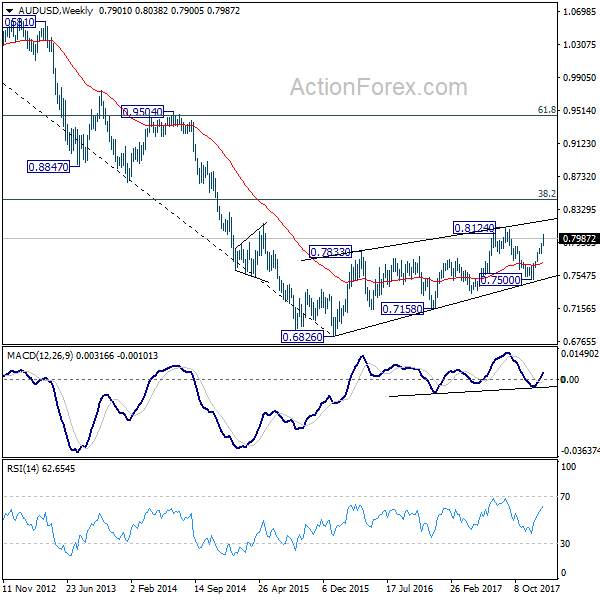
In the bigger picture, current development suggests that medium term rebound from 0.6826 is still in progress and could be resuming. Such rise could target 38.2% retracement of 1.1079 (2011 high) to 0.6826 (2016 low) at 0.8451. As such rise is seen as a corrective move, we'd expect strong resistance from 0.8451 to limit upside and bring reversal.
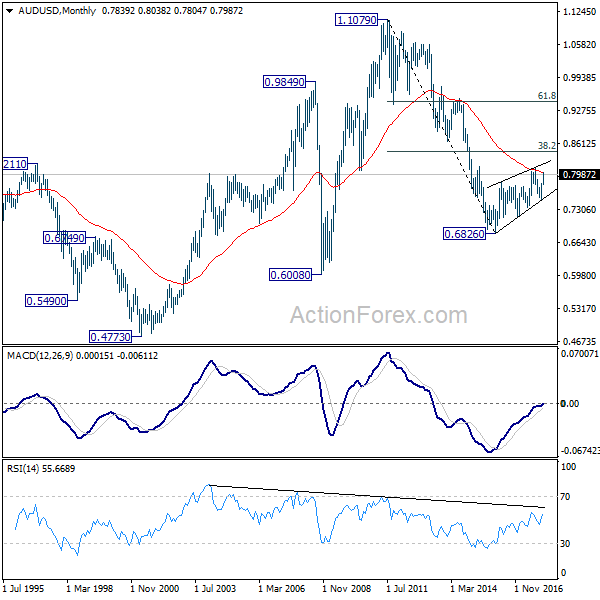
In the longer term picture, 0.6826 is seen as a long term bottom. Rise from there could either reverse the down trend from 1.1079, or just develop into a corrective pattern. At this point, we're favoring the latter. And, as long as 38.2% retracement of 1.1079 to 0.6826 at 0.8451 holds, we'd anticipate another decline through 0.6826 at a later stage. But strong support should be seen between 0.4773 (2001 low) and 0.6008 (2008 low).
USD/CAD Weekly Outlook
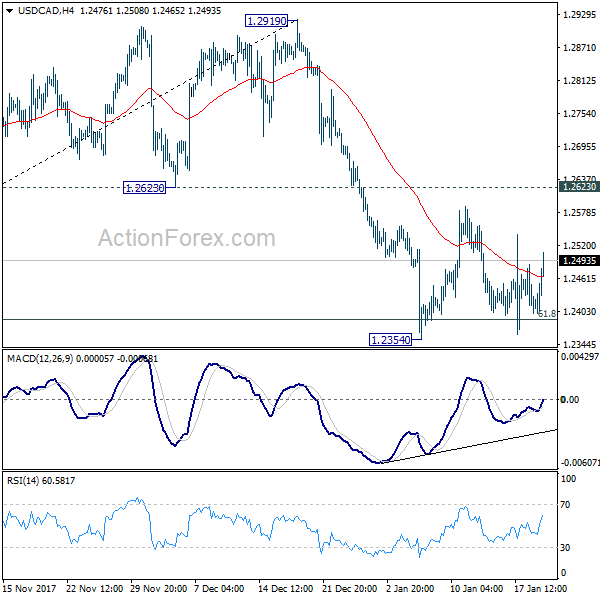
USD/CAD stayed in range trading above 1.2354 last week and outlook is unchanged. Initial bias is neutral this week first. Near term outlook stays mildly bearish as long as 1.2623 support turned resistance holds. Brea of 1.2354 will extend the decline to retest 1.2061 low. Nonetheless, on the upside, sustained break of 1.2623 will argue that the fall has completed and turn bias back to the upside for 1.2919 resistance.
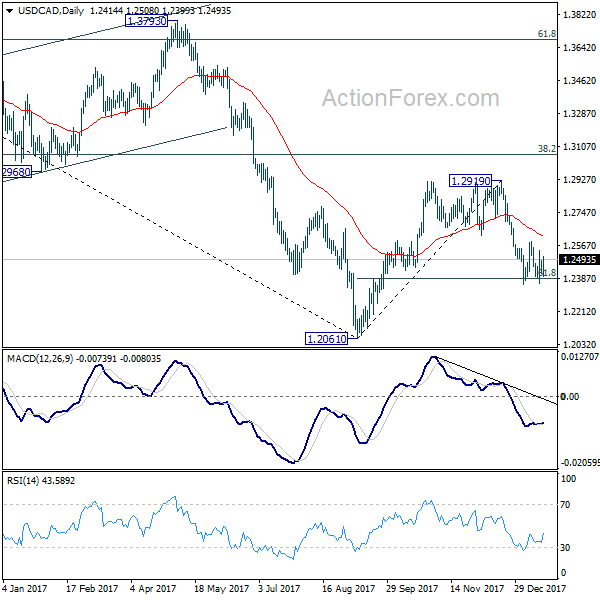
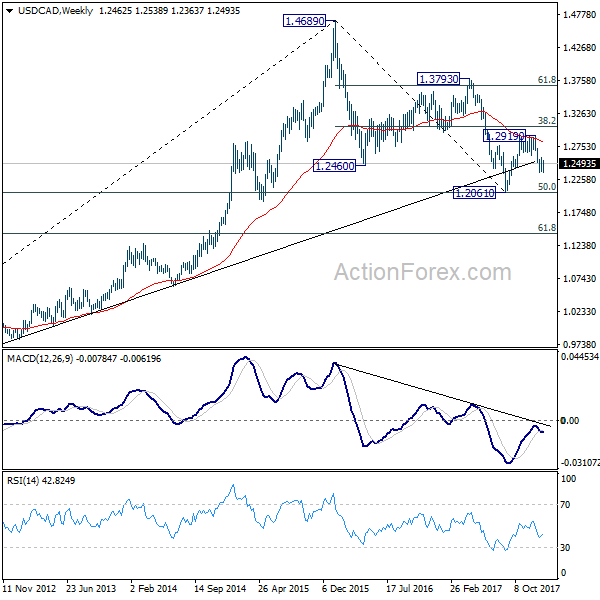
In the bigger picture, rebound from 1.2061 is likely completed completed at 1.2919, rejected by 55 week EMA (now at 1.2850) and kept below 38.2% retracement of 1.4689 to 1.2061 at 1.3065. The development also suggests that long term fall from 1.4689 is not completed yet. Decisive break of 1.2061 low will target 61.8% retracement of 0.9406 to 1.4689 at 1.1424. This will now be the favored case as long as 1.2919 resistance holds.
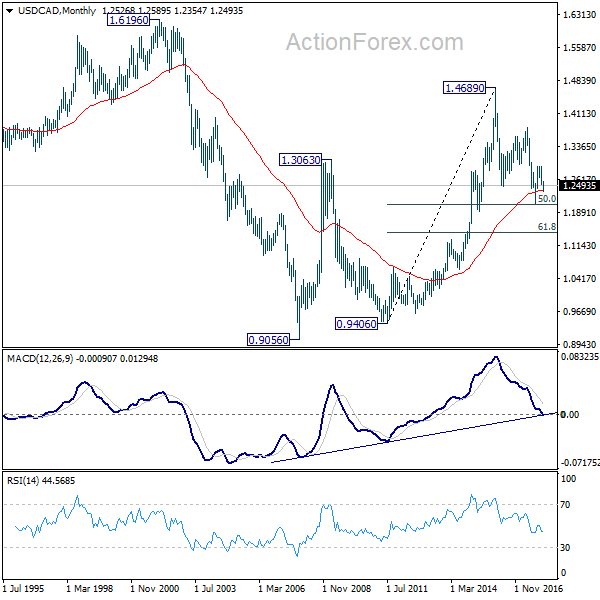
In the longer term picture, 50% retracement of 0.9406 (2011 low) to 1.4689 (2015 high) at 1.2048 remains a key support level to watch. As long as this level holds, we'll treat fall from 1.4689 as a correction and expect another rally through this level. However, sustained break of 1.2048 will turn favors to the case that rise from 0.9056 (2007 low) is a three wave corrective move that's completed at 1.4689. And retest of 0.9056/9406 support zone could be seen in medium to long term.
GBP/JPY Weekly Outlook
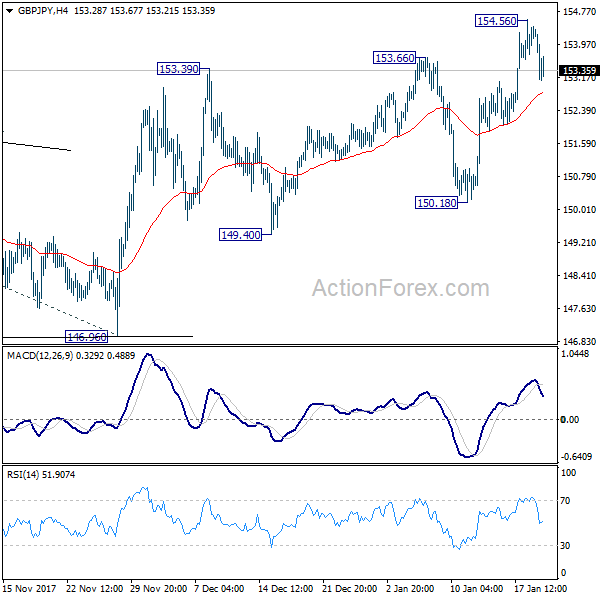
GBP/JPY's up trend resumed last week and reached as high as 154.56. As a temporary top was formed there, initial bias is neutral this week first. Outlook will stay bullish as long as 150.18 support holds. Above 154.56 will extend the medium term up trend to 61.8% projection of 139.29 to 152.82 from 146.96 at 155.32. Break will target 100% projection at 160.49
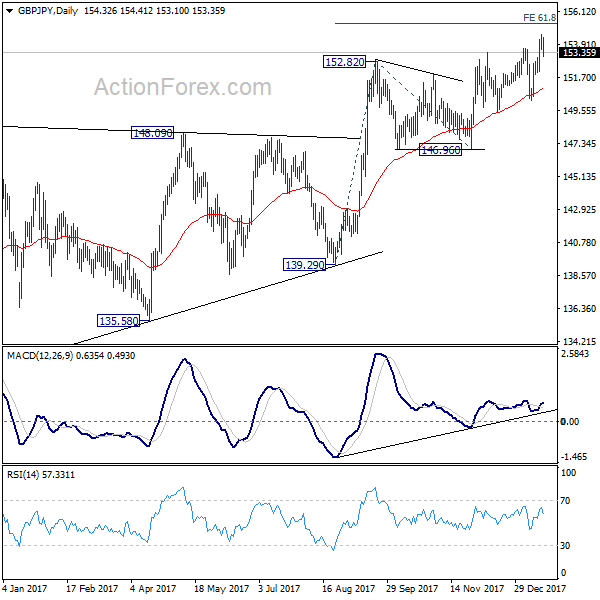
In the bigger picture, as long as 146.96 key support holds, medium term outlook remains bullish. Rise from 122.36 is in favor to extend to 61.8% retracement of 195.86 to 122.36 at 167.78. However, break of 146.96 support will indicate trend reversal. And there would be prospect of retesting 122.36 in that case.
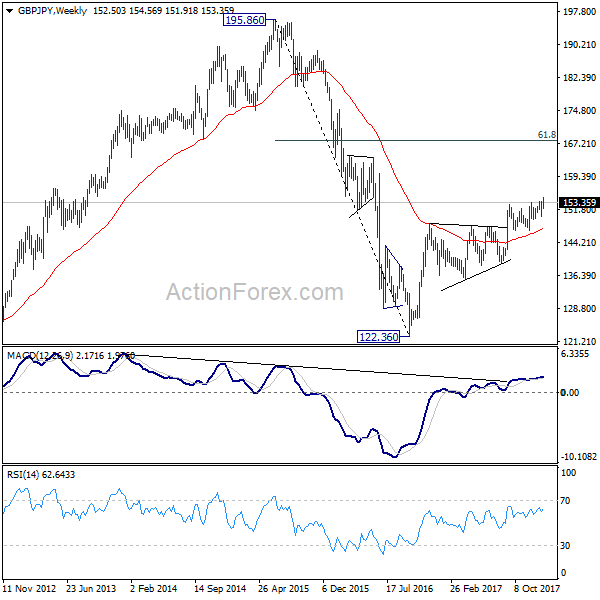
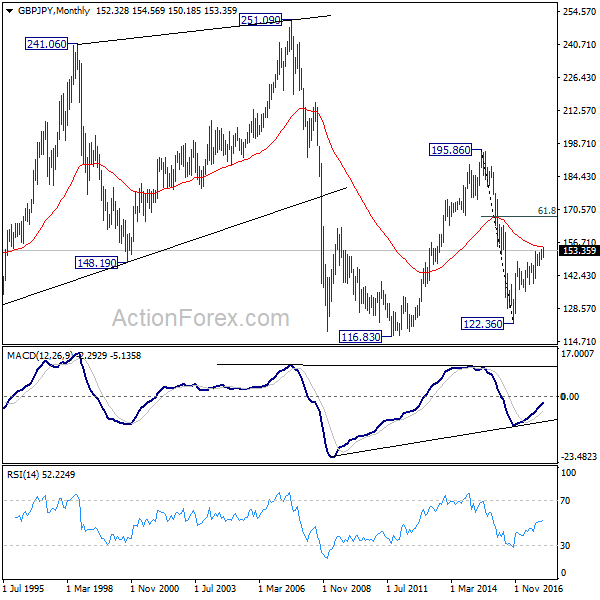
In the longer term picture, down trend from 195.86 (2015 high) has already completed at 122.36. Focus is now on 55 month EMA (now at 154.75). Firm break there will suggest that rise from 122.36 is developing into a long term move that target 195.86 again. And, price actions from 116.83 (2011 low) is indeed a sideway pattern that could last more than a decade.
EUR/JPY Weekly Outlook
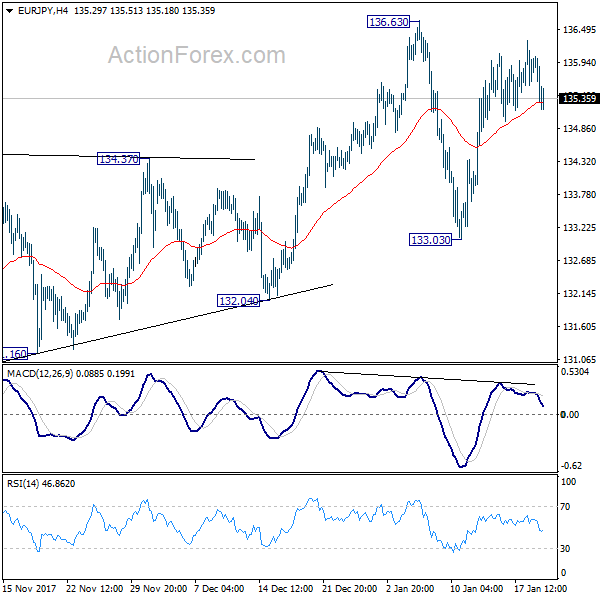
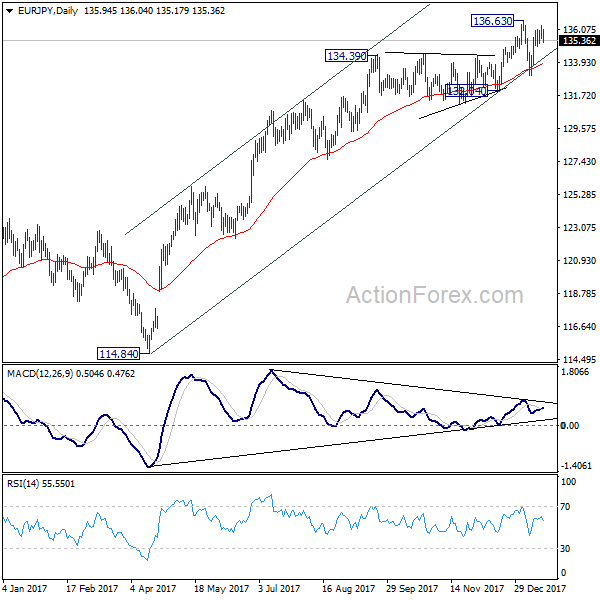
EUR/JPY's rebound last week was limited below 136.36 and retreated. As it's bounded in range of 133.03/136.63, initial bias remains neutral this week first. For the moment, outlook stays bullish as long as 133.03 support holds and another rise is in favor. Break of 136.63 will resume medium term up trend. However, on the downside, break of 133.03 will have 55 day EMA and medium term channel support firmly taken out. Also, considering bearish divergence condition in daily MACD too, that will suggest medium term reversal. Deeper fall should then be seen to 132.04 support for confirmation.
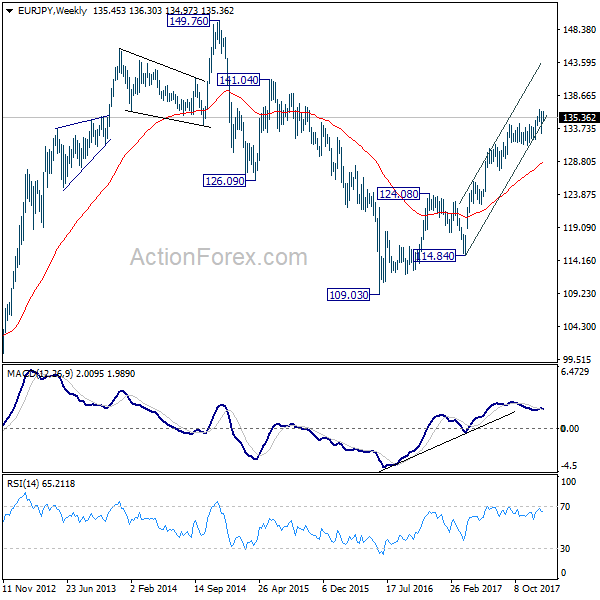
In the bigger picture, medium term rise from 109.03 (2016 low) is seen as at the same degree as the down trend from 149.76 (2014 high) to 109.03 (2016 low). It should be targeting 141.04/149.76 resistance zone. On the downside, break of 132.04 support is needed to indicate medium term reversal. Otherwise, outlook will stay bullish in case of deep pull back.
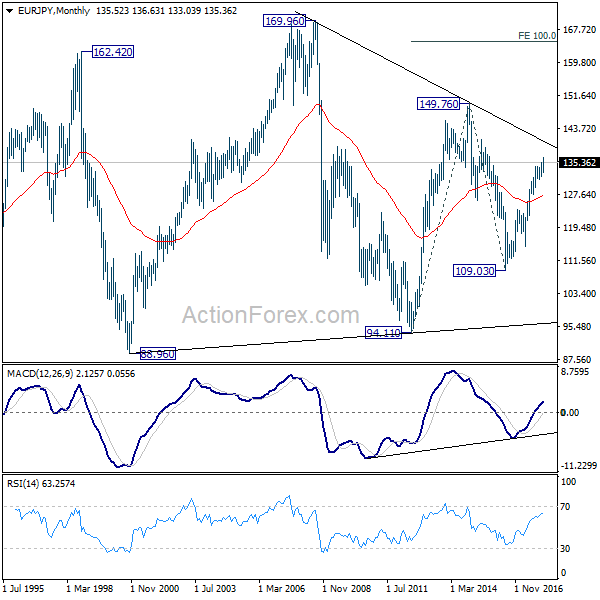
In the long term picture, at this point, there is no clear indication that rise from 109.03 is resuming that from 94.11 (2012 low). Hence, we'd be cautious on topping below 149.76 to extend range trading. Nonetheless, firm break of 149.76 will indicates strong underlying buying. In such case, EUR/JPY will target 100% projection of 94.11 to 149.76 from 109.03 at 164.68.
EUR/GBP Weekly Outlook
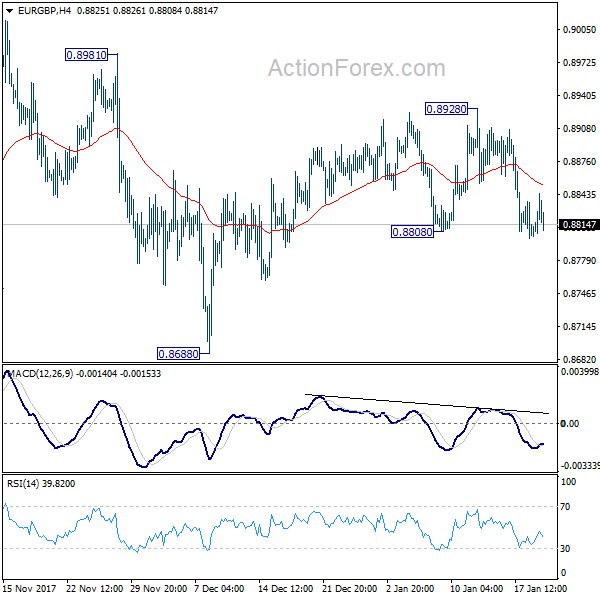
EUR/GBP's breach of 0.8808 support last week suggests that rebound from 0.8688 is already completed at 0.8928. Further fall is expected this week to retest 0.8688. Firm break there would resume whole fall from 0.9305 to retest 0.8303/12 key support zone. And, this will now be the favored as long as 0.8928 resistance holds, even in case of recovery.
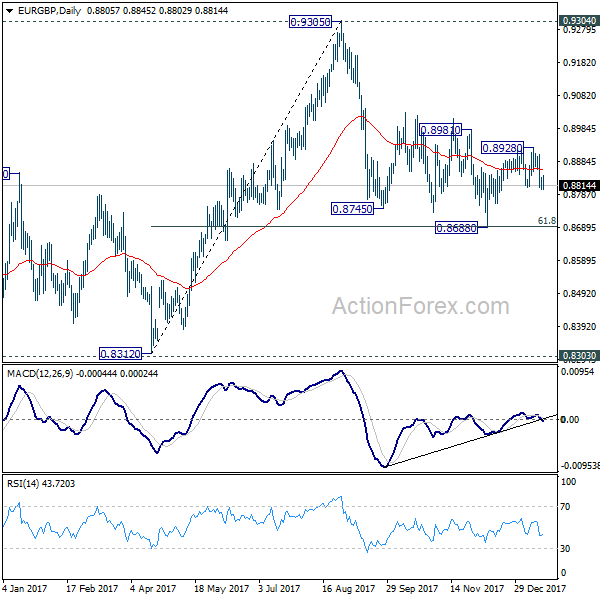
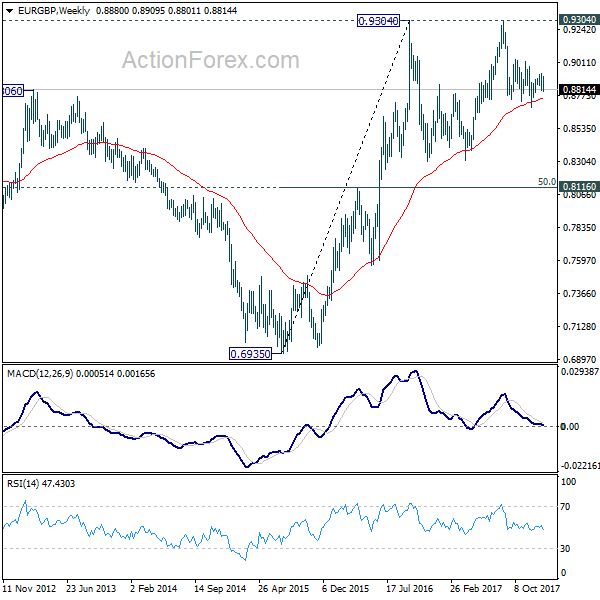
In the bigger picture, there are various ways to interpret price actions from 0.9304 high. But after all, firm break of 0.9304/5 is needed to confirm up trend resumption. Otherwise, range trading will continue with risk of deeper fall. And in that case, EUR/GBP could have a retest on 0.8303. But we'd expect strong support from 0.8116 cluster support (50% retracement of 0.6935 to 0.9304 at 0.8120) to contain downside.
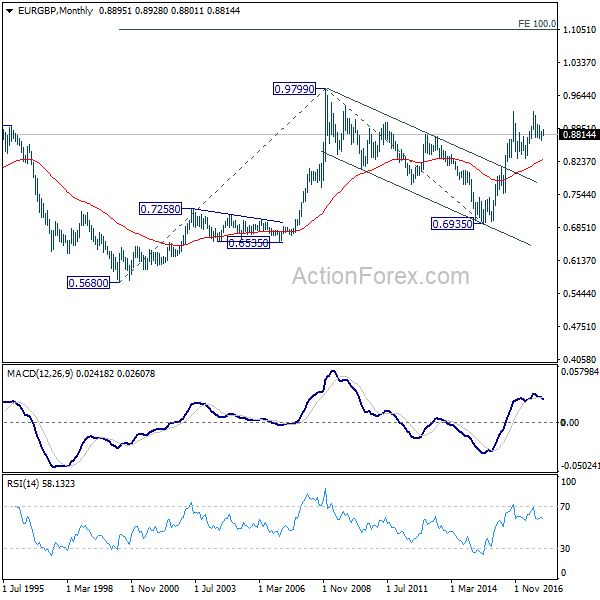
In the long term picture, we're holding on to the view that rise from 0.6935 (2015 low) is resuming the up trend from 0.5680 (2000 low). Hence, after the consolidation from 0.9304 completes, we'd expect another medium term up trend through 0.9799 to 100% projection of 0.5680 to 0.9799 from 0.6935 at 1.1054.
EUR/AUD Weekly Outlook
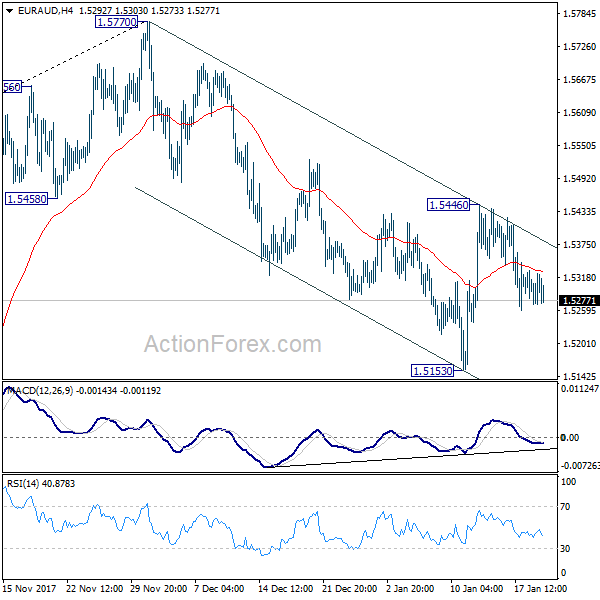
EUR/AUD's deep pull back from 1.5446 mixed up the near term outlook. Initial bias stays neutral this week first. On the upside, break of 1.5446 resistance will revive the case that correction from 1.5770 has completed at 1.5153. In that case, intraday bias will be turned back to the upside for retesting 1.5770 first. However, break of 1.5153 will resume the fall from 1.5770 to 1.4949 cluster support (38.2% retracement of 1.3624 to 1.5770 at 1.4950).
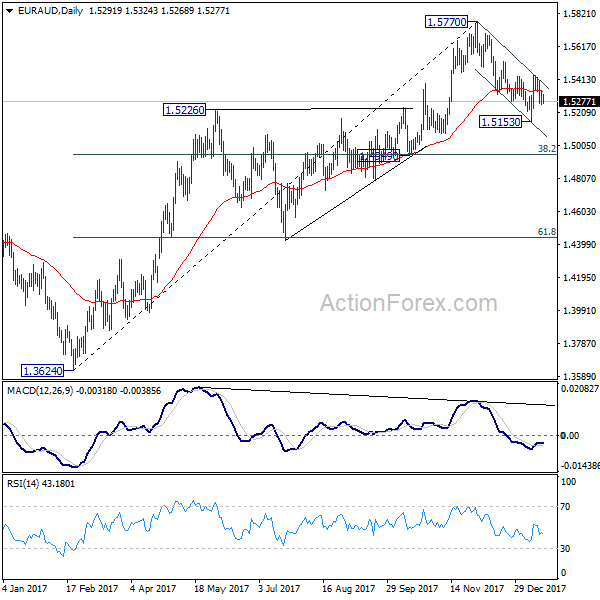
In the bigger picture, price actions from 1.5770 so far suggests that it's corrective in nature. That is, medium term rise from 1.3624 is not completed yet. Break of 1.5770 will extend the rise to retest 1.6587 (2015 high). However, considering bearish divergence condition in daily MACD, sustained break of 1.4949 cluster support (38.2% retracement of 1.3624 to 1.5770 at 1.4950) will indicate medium term reversal. And there is prospect of retesting 1.3624 low in that bearish case.
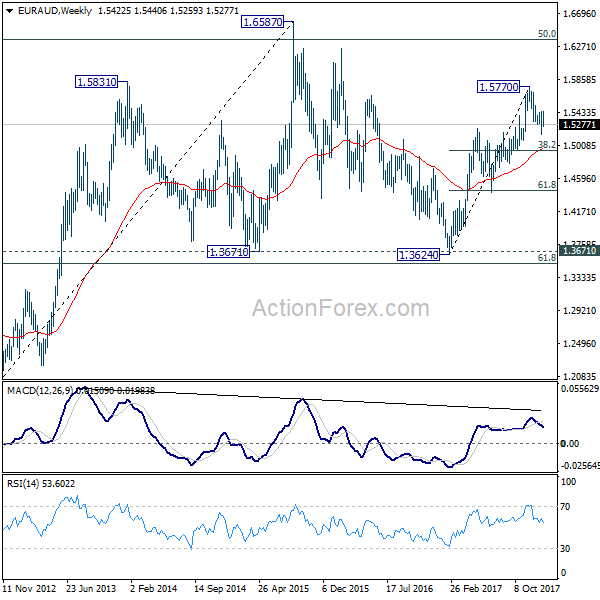
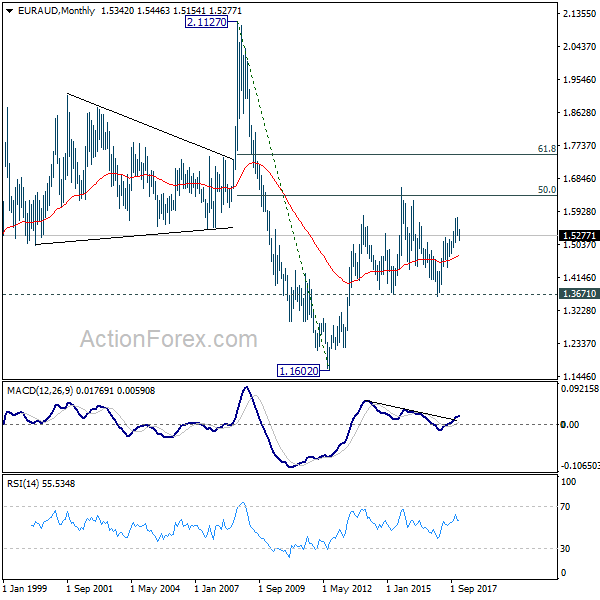
In the longer term picture, the rise from 1.1602 long term bottom (2012 low) isn't over yet. We'll keep monitoring the development but there is prospect of extending the rise to 61.8% retracement of 2.1127 to 1.1602 at 1.7488 and above. However, sustained trading below 1.3671 should indicate long term reversal and target 1.1602 long term bottom again.
EUR/CHF Weekly Outlook
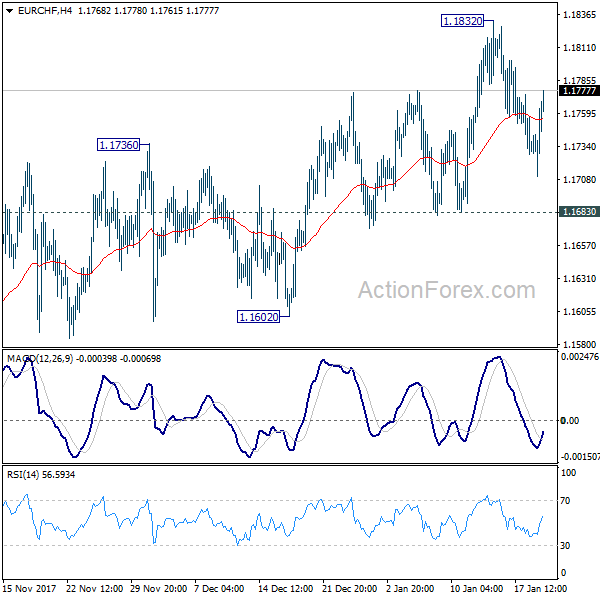
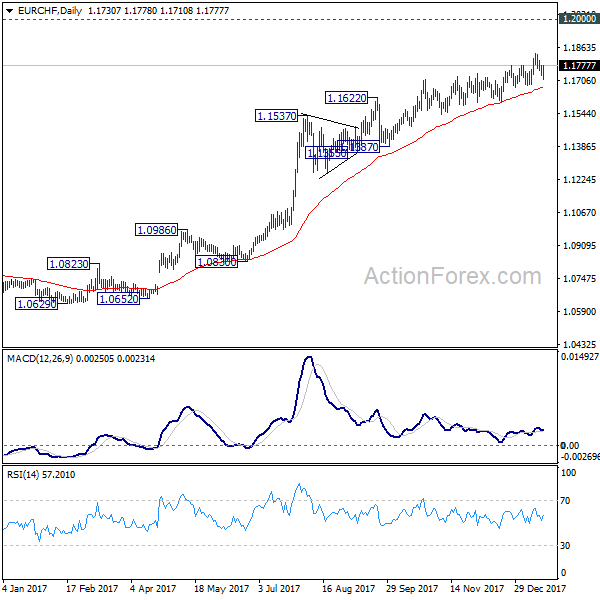
EUR/CHF edged higher to 1.1832 last week but pulled back deeply. But still, downside was held above 1.1683 near term support. Thus, outlook stays bullish for further rally. Again, considering relatively weak upside momentum, in case of another rise, we'd expect strong resistance below 1.2 handle to bring medium term reversal. Break of 1.1683 support will be a early sign of reversal and turn focus to 1.1602 support.
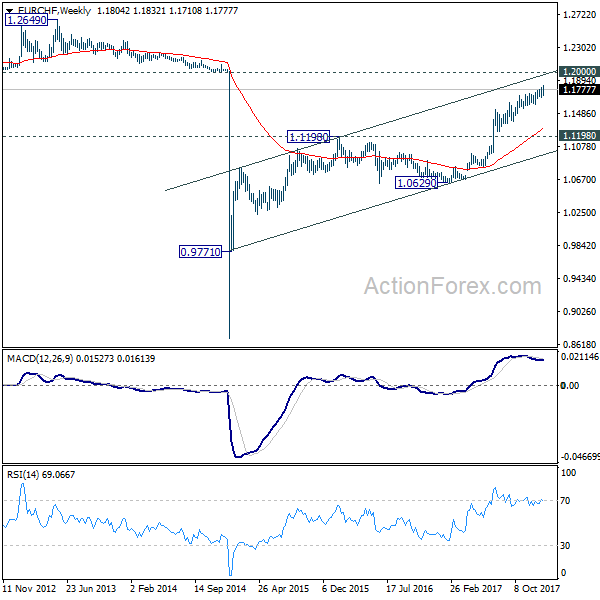
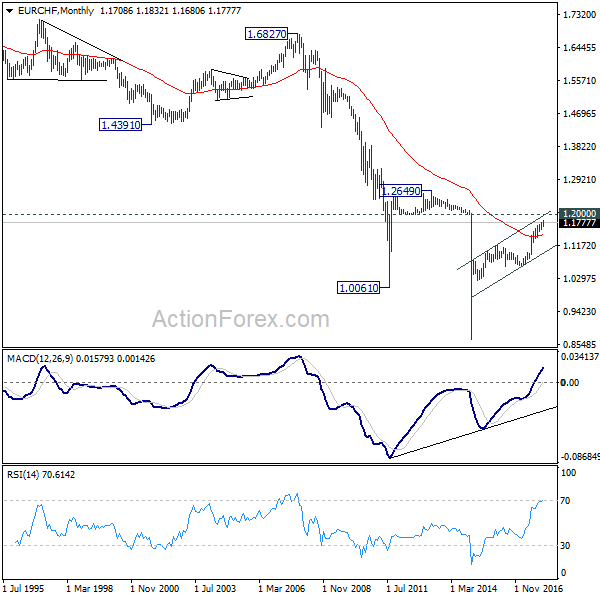
In the bigger picture, while a medium term top could be around the corner, there is no change in the larger outlook. That is, long term rise from SNB spike low back in 2015 is still in progress and would extend. As long as 1.1198 resistance turned support holds, we'll hold on to this bullish view and expect further rise to prior SNB imposed floor at 1.2000 and above. Though, we'll reassess the outlook if 1.1198 is firmly taken out.