Sample Category Title
USD/JPY Sideways Price Action
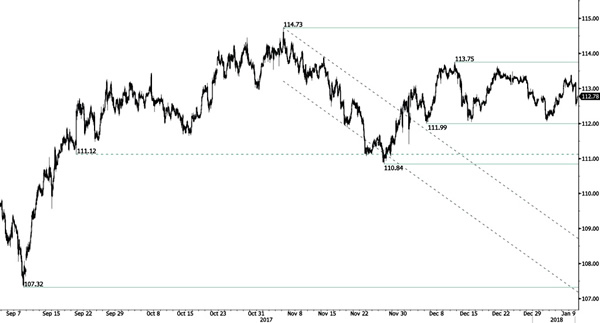
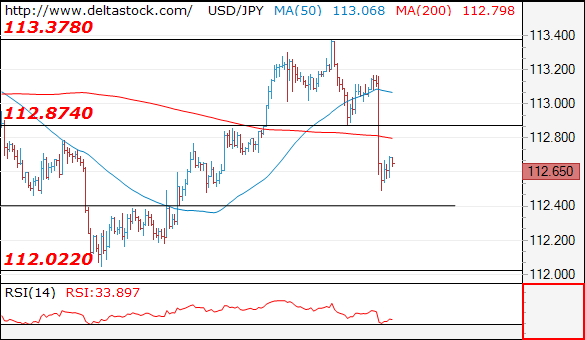
USD/JPY's buying demand is increasing and the pair is approaching hourly resistance given at 113.75 (12/12/2017 high) while hourly support is given at 111.99 (15/12/2017 low). The technical structure suggests continued increase.
We favor a long-term bearish bias. Support is now given at 99.02 (10/08/2013 low). A gradual rise towards the major resistance at 125.86 (05/06/2015 high) seems unlikely. Expected to decline further support at 93.79 (13/06/2013 low).
GBP/USD Ready For Another Leg Higher
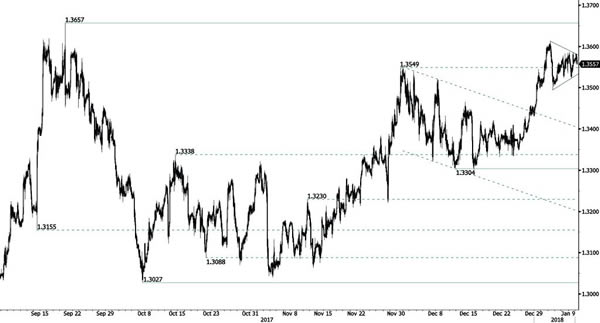
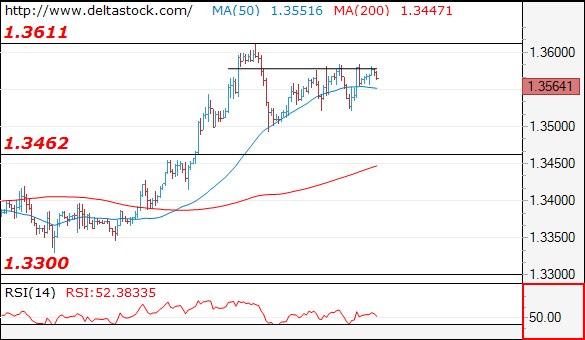
GBP/USD's buying pressures are still lively. The pair has exited downtrend short-term channel. The technical structure indicates further potential upside. Hourly support is given at a distance at 1.3495 (03/01/2017 low) while hourly resistance can be found at 1.3613 (03/01/2017 high).
The long-term technical pattern is reversing. The Brexit vote had paved the way for further decline. Long-term support can be found at 1.1841 (07/10/2017 low). Long-term resistance given around 1.35 is at stake and indicates a long-term reversal in the negative trend. Yet, it is very unlikely at the moment.
EUR/USD Weakening
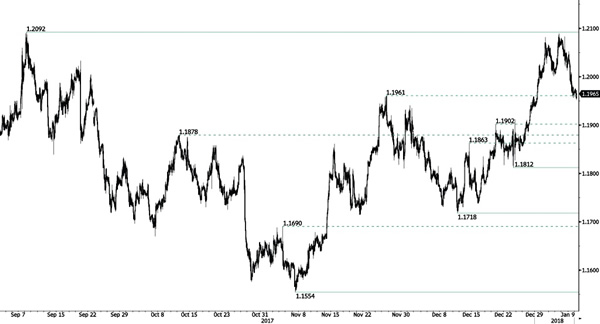
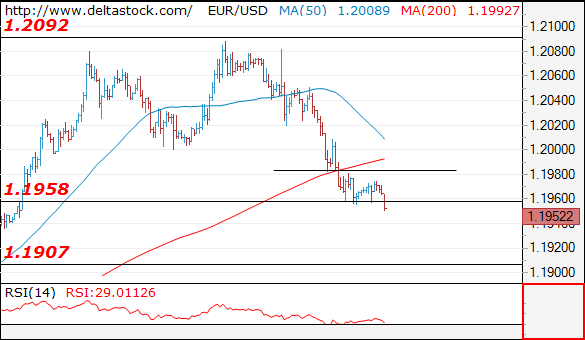
EUR/USD is now lower than 1.20. The pair is now retracing after reaching resistance given at 1.2092 (08/09/2017 high). The road is wide-open for further decline towards support at 1.1812 (25/12/2017 low). Stronger support is given a distance at 1.1718 (12/12/2017 low).
In the longer term, the momentum is now turning largely positive. We favour a continued bullish bias. Key resistance is holding at 1.2252 (25/12/2014 high) while strong support lies at 1.0341 (03/01/2017 low).
Technical Outlook: Copper – Correction Is Pausing But Downside Risk Remains
Bears are taking a breather after pullback from new high at $3.3200 found footstep at $3.2200 zone and price bounced higher on weaker dollar on Tuesday.
Bullish Doji reversal pattern is forming on daily chart but requires strong bullish close today to complete the pattern and signal recovery.
Oversold daily slow stochastic support the notion.
However, recovery attempts were limited under broken 10SMA at $3.2644 (upper pivot) and signaled bulls may be running out of steam.
Bullish scenario requires close above 10SMA to sideline downside risk, otherwise the downside would remain vulnerable.
Firm break below $3.2200 would then risk extension towards rising 20SMA ($3.1942) and Fibo 38.2% of $2.9425/$3.3200 upleg ($3.1758).
Res: 3.2575, 3.2643, 3.2970, 3.3085
Sup: 3.2200, 3.1942, 3.1758, 3.1682
Technical Outlook: SPOT GOLD – Risk Of Deeper Pullback
Gold remains in red on Tuesday and retests spike lows of past two days ($1314/13) left after repeated downside rejections.
The yellow metal is pressured by higher dollar and rising bets on further US interest rate hikes in 2018.
Fresh weakness today threatens of stronger reversal from new 3 1/2 month high at $1326 which would extend towards rising 10SMA ($1307), Fibo 23.6% retracement of $1236/$1326 ascend at $1304 and psychological $1300 support.
Daily RSI and slow stochastic emerge from overbought territory and showing room for further downside extension which could stretch towards pivotal support at $1291 (Fibo 38.2%).
Underlying bulls need correction to validate uninterrupted uptrend from $1236 (12 Dec low) for further retracement of $1357/$1236 descend, keeping dip-buying as favored scenario.
Res: 1320, 1322, 1326, 1328
Sup: 1313, 1307, 1300, 1291
Forex Technical Analysis: EUR/USD, USD/JPY, GBP/USD
EUR/USD
Current level - 1.1952
The slide from 1.2090 is still underway and it should target 1.1910 static support. A violation of the latter will expose 1.1710 area. Initial intraday resistance lies at 1.1980.
| Resistance | Support | ||
| intraday | intraweek | intraday | intraweek |
| 1.1980 | 1.2090 | 1.1960 | 1.1910 |
| 1.2090 | 1.2240 | 1.1910 | 1.1715 |
USD/JPY
Current level - 112.65
Yesterday's dip through 113.00 low signals a reversal of the uptrend from 112.00 and the bias is already negative below 112.87, for a slide to 112.00.
| Resistance | Support | ||
| intraday | intraweek | intraday | intraweek |
| 112.87 | 113.75 | 112.40 | 112.00 |
| 113.75 | 114.70 | 112.00 | 111.00 |
GBP/USD
Current level - 1.3564
The resistance at 1.3580 is still intact and the outlook is bearish below the mentioned hurdle, for a slide towards 1.3460.
| Resistance | Support | ||
| intraday | intraweek | intraday | intraweek |
| 1.3575 | 1.3660 | 1.3520 | 1.3460 |
| 1.3660 | 1.3660 | 1.3460 | 1.3300 |
EURUSD Analysis: Crosses 200-Hour SMA
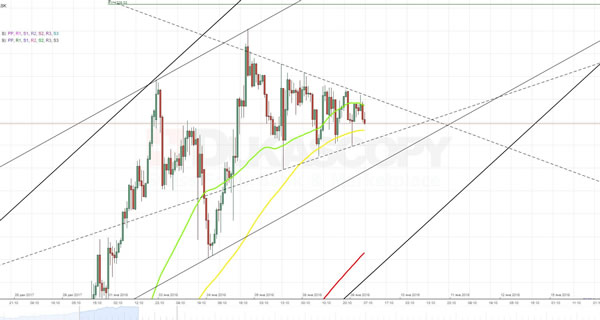
Contrary to expectations, the lower trend-line of a one-month long ascending channel did not managed to stop the currency rate from falling, even though it was additionally backed up by the weekly S1 and the 200-hour SMA.
Basically, yesterday's downfall illustrates the breakout from a larger rising wedge formation, which can be more clearly seen on daily chart. As the pair has already crossed key technical barriers, the plunge is expected to continue. In support of this assumption, the majority of pending orders both in 50- and 100-pip ranges are set to sell. In that case, the closest support levels most probably will be located near the weekly S2 at 1.1953 and the monthly PP at 1.1917.
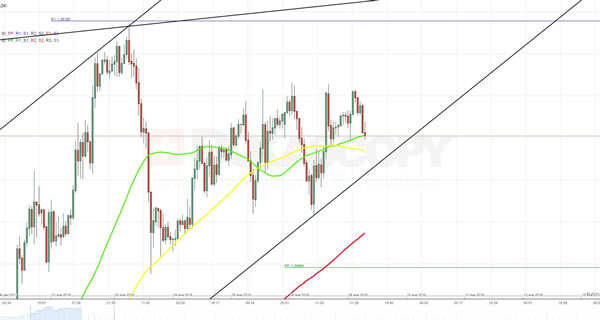
GBPUSD Analysis: Falls But Then Returns To 1.3585
The British Pound is continuing to slowly advance against the Dollar in a one-month long ascending channel.
New trading session the cable started above the combination of the weekly PP, the 55- and 100-hour SMAs, which are expected to provide support for further surge.
Accordingly, the weekly goal for the pair should be an area located between the psychological 1.3600 level and het monthly R1 at 1.3615.
However, it should be noticed that for the past three days the currency rate could not climb above the 1.3585 level, which might lead to a premature breakout from pattern especially in case of high volatility, such as on Friday.
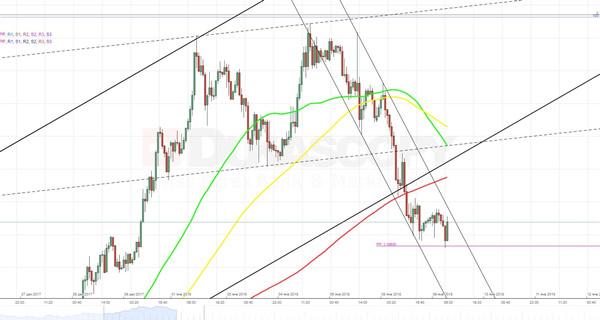
USDJPY Analysis: Down 47 Points
The five-day surge of the Dollar against the Yen was stopped by the upper trend-line of medium scale symmetrical triangle, as expected.
In result of a rebound, the pair started new trading session from the monthly PP at 112.62. After such rapid drops traders usually try to restore lost positions. However, in this case the recovery is not expected to last for long, as northern side is blocked by a combination of the weekly PP, the 55- and 100-hour SMAs. Accordingly, the pair is expected to continue moving to the opposite side of triangle, towards the 50% Fibonacci retracement level located at the 112.45 mark. In support of this assumption, most of the pending orders in 50-pip range are set to sell
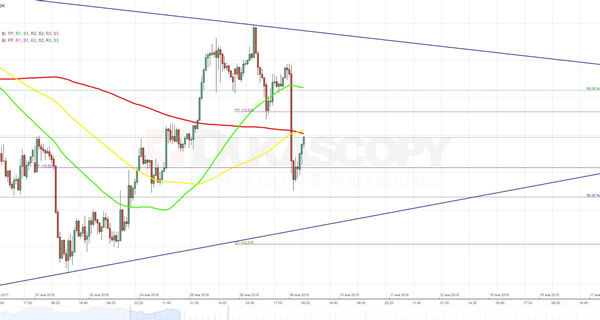
XAUUSD Analysis: Moves Horizontally
In accordance with expectations, previous trading session the exchange rate spent in a horizontal movement. From the north it was obstructed by resistance zone located between the 1,321.00 and 1,322.00 marks, while from the south it was pressured by the weekly PP and the 100-hour SMA.
As economic calendar remains empty, such flat movement might continue for another two days. In the end bulls might try to push the rate to the upper trend-line of a dominant descending channel. Nevertheless, in daily perspective the same pattern clearly points out on imminence of beginning of a downward movement. The bearish stance on the gold additionally supports this assumption.