Sample Category Title
EUR/USD Trading Around 1.2000
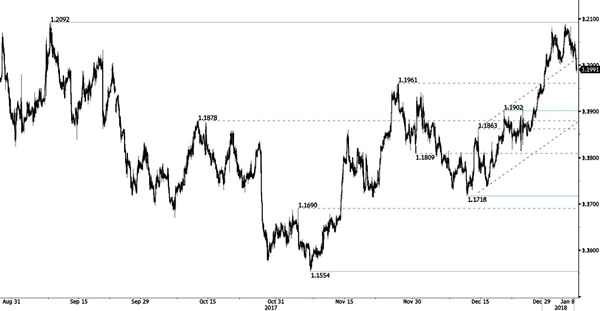
EUR/USD is now trading around 1.20. The pair lies in a bullish short-term momentum. Strong resistance is given at 1.2092 (08/09/2017 high) while hourly support can be found at 1.1980 (intraday low). Stronger support is given a distance at 1.1718 (12/12/2017 low). Expected to show continued increase.
In the longer term, the momentum is now turning largely positive. We favour a continued bullish bias. Key resistance is holding at 1.2252 (25/12/2014 high) while strong support lies at 1.0341 (03/01/2017 low).
Ethereum Another Record High | Higher Dollar Pushed Gold Lower
Another record high for Etherum
CFTC data show different picture for Bitcoin traders
Dollar pushed gold lower
If you really think that Bitcoin is nothing but a sham concept or a big bubble, then we should have seen massive short bets by now. But after observing the volume and the size of the short trades on Bitcoin’s future market, the evidence of such an aspect is clearly missing. This makes you assume either traders are actually scared to short bitcoin because of its popularity and it's volatility or they are waiting on the sidelines. So, you can say that for sceptics, since the launch of the Bitcoin futures, the process has been disappointing. Having said this, since the launch of the Bitcoin futures on the CBOE and the CME exchanges, one thing which we have not witnessed is the string of record highs for Bitcoin.
Looking at the recent CFTC data on Bitcoin, the general theme which becomes more prominent is that of speculators slowly building their short position. The most intriguing part of the CFTC data is the leverage fund category (hedge funds & money managers are part of this herd); it holds nearly one-quarter of the short position as compared to the total open interest. Remember, the CFTC data is not that recent, these numbers were reported on the 26 December but we do need more latest numbers in order to have any firm view.
Ethereum has grabbed the headlines in the crypto space today as the currency has made another record high of $1266. The momentum for the currency has been strong especially when you compare this to Bitcoin. Only in four days, Ethereum traders pushed the price to an all-time high of $1000.
As for the dollar index, it is trading higher despite the fact the numbers released on Friday weren't amazing. At the same time, this US NFP report is not going to stop the Fed from their current tightening cycle. The Fed is hopeful the modest improvement in the commodity prices and the US tax overhaul both help the country's weak inflation data.
Nonetheless, the precious metal is still holding its ground and it is trading well above the critical level of 1300. The US NFP number has put things more perspectively for gold traders that the Fed would struggle to increase the interest rate aggressively this year given the current market situation.
Disclaimer:ThinkMarkets is an execution-only service provider. Any opinions, news, comments, research, analyses, prices or other information contained on this website is provided as general market commentary and does not constitute investment advice. ThinkMarkets will not accept liability for any loss or damage including, without limitation, to any loss of profit, which may arise directly or indirectly from use of or reliance on such information.
3 Hikes And We’re Out?
Crude oil reaches its top
Oil prices are at a 30-month high, despite boosted US production and inventories and a drop in the US rig count. The harsh winter is playing a short-term role, but some analysts are suggesting that 2018 prices will surge past our forecast of US$ 60-65 per barrel of West Texas Intermediate.
We're not convinced – yet, but their reasons are: 1) growing confidence in demand growth in developed and emerging markets; 2) booming consumption in China (the world's largest oil consumer), which reported modest gains in 2017 new passenger-car sales but big jumps in used car buying; and 3) speculation that US shale production might not be able to maintain currently high rates. We still short on crude, but are watching these factors carefully.
3 hikes and we're out?
Will or won't the US Federal Reserve hike interest three times in 2018? Although this has been talked up for months now, we don't expect a rate increase from the next meeting of the Fed's Open Market Committee, scheduled for 31 January. Indeed, as long as inflation does not clearly pick up, the Fed will be reluctant to tighten money.
But, if it does, three hikes in 2018 will disrupt markets. A serious sell-off would become likely.
For now, investors trust the Fed. The front-end of the yield curve will continue to increase, and the US equities frenzy will keep going. The US dollar has strengthened since last Friday and should continue to do so in the short-term. The Fed's tightening hand has also been weakened by the latest employment figures. Both the non-farm payrolls and the ADP report for December have been revised downward, which will make the central bank even more cautious.
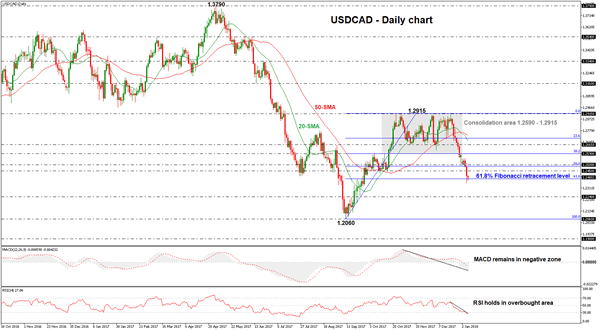
USDCAD Drops To 3-Month Low, Eases After Strong Sell-Off
USDCAD plummeted almost 1% in the previous two trading days and this weakness has taken the price to a fresh three-month low of 1.2354. The pair has seen a strong sell-off since the aggressive bearish run started on December 19.
In the daily timeframe, significant obstacles have been broken, such as the consolidation area of 1.2590 – 1.2915, the 38.2% and 50.0% Fibonacci retracement levels of the last big up-leg with the low at 1.2060 and the high at 1.2915, as well as the 1.2450 barrier, which was acting as a support level before the penetration.
During the decline, the price touched the 61.8% Fibonacci level at 1.2386, and paused the sharp fall, as the price is trying to recover from weakness. If the price moves higher, it could hit the 1.2450 resistance level and the 1.2500 strong handle.
Conversely, a drop beneath the 61.8% Fibonacci level could push the pair towards the 1.2240 support level or moreover, until the 1.2060 barrier. In the near-term, the 20-simple moving average is sloping to the downside confirming the recent bearish movement as well as the 50-SMA in the medium-term is moving south. Additionally, in the short to medium term time frame, the MACD and the RSI indicators are holding within the oversold areas, signaling further downward pressure.
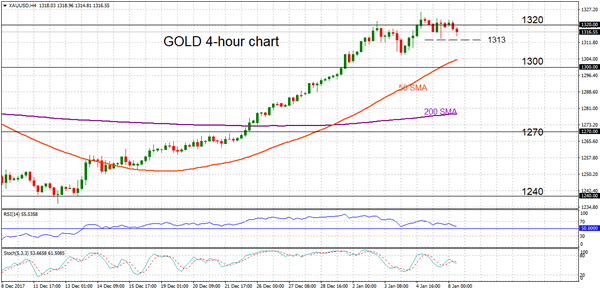
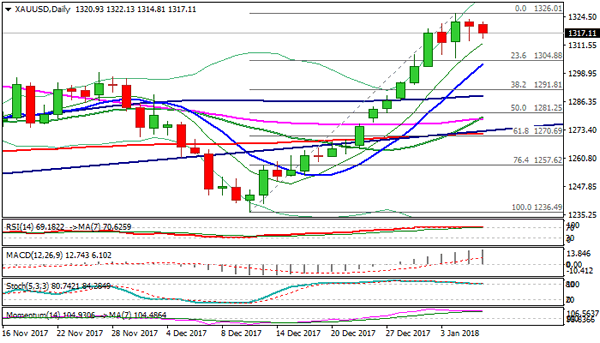
Gold Turns Bullish After Breach Of Key 1300 Level, Consolidates In Near Term
Gold is starting to see immediate pressure to the downside after struggling to hold gains above the key 1320 level. The commodity weakened following the peak just below 1326 and then turned lower to stabilize around 1316.
Looking at the 4-hour chart, the immediate focus is near the 1306 level, which has provided support recently. Major support is seen at the key psychological level at 1300. Falling below this would erase the short-term bullish outlook. The RSI and stochastic are moving lower, suggesting that upside momentum has weakened for now.
Prices need to breach 1320 to open the way for a move towards last week’s high of 1325.97. A rise above this would confirm the bullish bias and shift the focus to the next peak of 1357.47 from September 2017.
The positively aligned 50 and 200-period moving averages support a bullish outlook for gold but in the near term, the bias remains neutral for now and prices are likely to move into a range trading mode, likely between 1313 and 1326.
Technical Outlook: SPOT GOLD – Correction To Precede Fresh Bulls
Spot Gold prices eases on Monday, weighed by stronger dollar after weaker than expected US jobs data on Friday made no impact on expectations for further interest rate hikes this year.
Gold price could ease further on fresh negative sentiment, as corrective action is also signaled by daily indicators emerging from overbought zone.
Violation of last Friday’s spike low at $1313 will initial signal, with violation of pivots at $1305/03 (last Thursday’s low / Fibo 23.6% of $1236/$1326 rally / rising 10SMA) needed to generate stronger bearish signal.
Buying on correction remains favored scenario as steep uptrend from $1236 showed signs of fatigue and needs to correct before larger bulls continue.
Extended dips should find ground at $1292 (Fibo 38.2% of $1236/$1326) to keep bulls intact and reduce risk of deeper correction which would sideline bulls.
Res: 1322, 1326, 1328, 1334
Sup: 1313, 1305, 1300, 1291
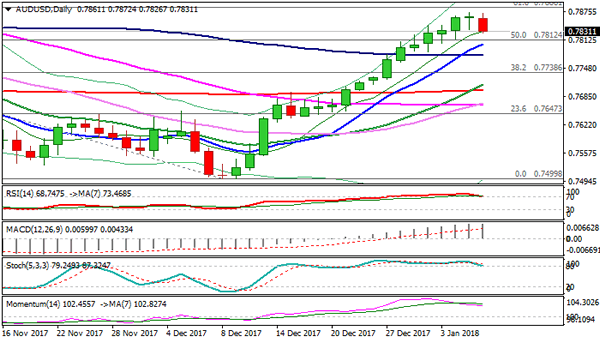
Technical Outlook: AUDUSD – Doji Reversal Signal Is Forming On Daily Chart
The Aussie trades in red on Monday after Friday’s trading ended in Doji, signaling that steep ascend from 0.7500 might be running out of steam.
Doji reversal pattern is forming on daily chart and risk of deeper pullback could be expected on violation of pivotal supports at 0.7816/03 (daily cloud top / rising 10SMA).
The notion is supported by daily RSI / slow stochastic attempts to emerge from overbought territory.
Confirmation of reversal could be expected on break below next pivot at 0.7785 (Fibo 38.2% of 0.7641/0.7874 upleg).
Overall bullish structure sees correction as buying opportunity for fresh advance and test of next pivotal barriers at 0.7886/0.7897 (Fibo 61.8% of 0.8124/0.7500 / 13 Oct high) break of which would generate bullish signal for extension of recovery leg from 0.7500 (08 Dec low).
Res: 0.7874, 0.7886, 0.7897, 0.7977
Sup: 0.7816, 0.7800, 0.7785, 0.7776
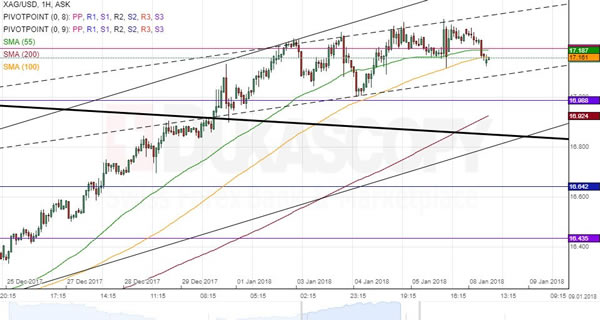
XAG/USD 1H Chart: Silver Consolidates
Silver was guided by a channel down against the Greenback for four months. This prevailing pattern was breached on the last trading day of 2017, thus resulting in the formation of a bullish ascending channel. The pair has since managed to edge slightly higher; however, its has shown reluctance to move past the 17.30 area. This demonstrates that the market is indecisive. Thus, the pair might remain near the 55– and 100-hour SMAs in this session. Weekly technical indicators suggest that Silver is likely to depreciate during the following days. This will bring the rate closer to the lower channel boundary and 200-hour SMA circa 16.90. It is likely that this area is respected, thus resulting in a reversal and further advance.
USD/SEK 1H Chart: Pair Guided By Bearish Patterns
USD/SEK was dominated by an ascending channel in force since late August. This long-term pattern was breached mid-December, thus following by a period of decline down to the 4.14 mark. This bearish momentum has allayed during the previous week; nevertheless, the pair still remains tended slightly southwards. The Greenback managed to breach the combined resistance of the 55– and 100-hour SMAs early today. Technical indicators favour further fall within this session and even beyond. Thus, it is likely that the given currency halts near the 200-hour SMA and re-tests the aforementioned shorter-term moving averages. By and large, the senior channel is expected to hold, thus guiding the pair within the following week or two.
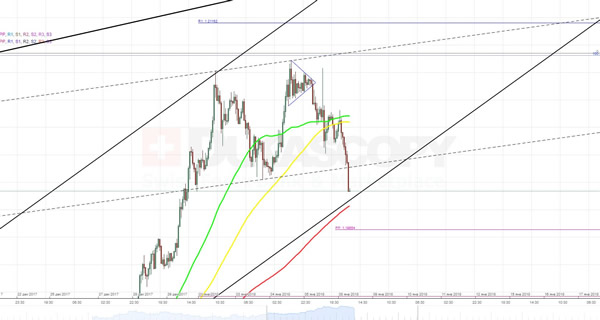
EUR/USD Analysis: Slides Towards 1.20
New trading week the common European currency started with depreciation against the American Dollar.
The downward movement was partially driven by a one week-long inverse head and shoulders pattern and partially by a recent bounce off from the two-year high located at the 1.2093 level. However, today the plunge most probably will be stopped near the bottom trend-line of a medium scale ascending channel, which is additionally backed up by the updated weekly S1 at 1.1992. If a rebound occurs, the pair will resume the surge trying to hit combined resistance level formed by the weekly PP at 1.2040 and the 55- and 100-hour SMA.