Sample Category Title
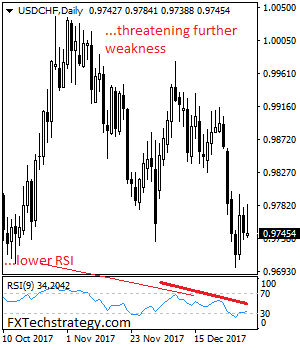
USDCHF – Faces Further Bear Threats
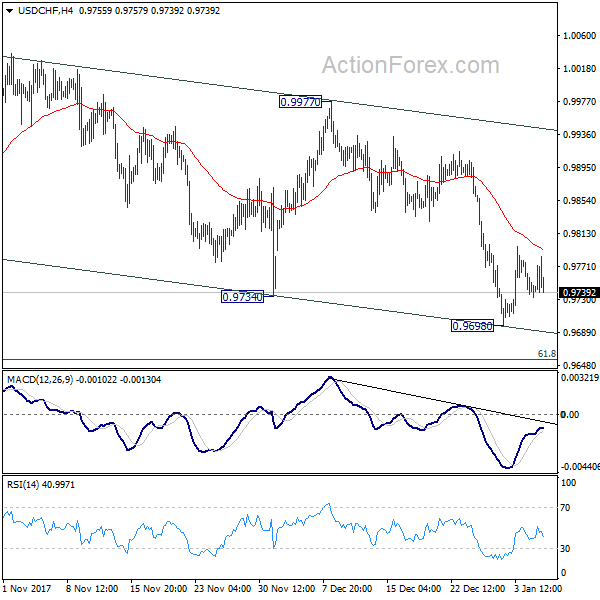
USDCHF - The pair faces pullback threats leaving risk of more weakness on the cards. On the downside, support lies at the 0.9700 level. A turn below here will open the door for more weakness towards the 0.9650 level and then the 0.9600 level. On the upside, resistance resides at the 0.9800 level where a break will clear the way for more strength to occur towards the 0.9850 level. Further out, resistance comes in at the 0.9900 level. Above here if seen will turn attention to 0.9950. All in all, USDCHF faces further corrective pullback pressure though with caution.
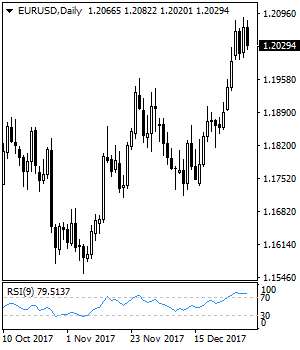
EURUSD – Upside Pressure Risk Remains Intact
EURUSD - The pair continues to retain its upside pressure hesitating on Friday. On the upside, resistance comes in at 1.2050 level with a cut through here opening the door for more upside towards the 1.2100 level. Further up, resistance lies at the 1.2150 level where a break will expose the 1.2200 level. Conversely, support lies at the 1.1950 level where a violation will aim at the 1.1900 level. A break of here will aim at the 1.1850 level. Below here will open the door for more weakness towards the 1.1800. All in all, EURUSD faces further downside weakness on price halt.
A Shadow From The Past
A shadow from the past
It's always difficult to make heads or tales of traders behaviourism around the new year, but for now, USD is brawling back against the sell-off that started in Mid December as two clear-cut developments from Friday could influence short-term sentiment.
First, USD rallied after a soft employment report, indicating the recent dollar sell-off could be taking a brief respite.This disconnect between the USD and economic data has some traders betting a near-term USD correction is imminent. Even the dismal non-manufacturing ISM didn't get a significant rise out of the bears
Second, a shadow from the past spooked the dollar bear after the Fed published 2012 transcripts of its FOMC meetings on Friday.And since Powell was on the Fed board at the time, G-10 traders took a genuine interest in the report. And while Powell did support QE3, he was not of high conviction. This view was a bit more hawkish than the dollar bears liked heading into the weekend causing dollar shorts to pare Friday afternoon. This storyline will put further emphasis on the plethora of Fed speak this week so observe the Fed Bankers this week.
Oil Markets
While OIl prices remain firm from supply disruptions, these signals have all but run there course. And while the OPEC vs Shale debate will rage the real focus remains on politics and specifically the Middle East turmoil. Indeed the markets are taking note of the Iranian Demonstrations, but I suspect oil traders remember the death Nedā Āghā-Soltān and if a similar story develops from overly forceful suppression President Trump will be quick to strap on Oil sanctions which will send oil prices rocketing higher.
Equity Markets
Global equity markets remain frothy to start the year supported by robust economic data and more buy into the stronger global growth narrative.Even in the face of weaker US jobs report it failed to dent universal optimism as the benchmark US S&P 500 entered new record territory.
Gold Markets
January is usually a good month for Gold prices and should remain so on the anticipation of physical demand ahead of the Chinese New Year. While there could be some downside pressure from a possible US dollar correction, Gold will likely remain firm until a March Fed hike possibility comes on the radar. But non the less its essential to keep an eye on Fed speak this week as the markets remain overly dovish which brings in the tail risk for hawkish surprises
G-10
Identifying the broader dollar trend will be a bit trickier this year, and we're already witnessing idiosyncratic storylines emerge, not only in $Asia but also in G-10 as traditional correlations start to diverge. Some G-10 and EM central bankers will begin the arduous process of policy normalisation, but given that each country could have a different response to changes in their domestic inflation narrative, unquestionably trading will be a bit more complicated than just playing a broadly based USD basket if this holds true.
The US Dollar
The market consensus is for USD weakness to continue as investors selectively build positions
The Euro
Last week the EUR hurtled the disappointing EU CPI which supports the view that markets remain under-positioned long-term relative to the markets overwhelming bullish sentiment. However, near-term EURUSD levels suggest there's a lot of focus 1.2000 indicating a break could trigger a correction towards 1.1900, as overweight short-term speculators and fast money positioning suggests the market could be susceptible to an early 2018 squeeze lower.
The Canadain Dollar
The incredibly strong job report on Friday increased the odds of a Bank of Canada hike. Combined with the supportive backdrop from the oil markets, the CAD should remain on sound footing.
The Japanese Yen
Few if any dealers expect the BoJ to move from the YCC anytime soon with inflation struggling below 1 %. So the USDJPY could move higher despite dollar weakness emerging in outher G-10 pairs. Over the short term, JPY could weaken given the favourable global risk conditions and rising global yields. However, One possible risk-averse situation to start the week is North Korea's leader Kim Jong Un purportedly turns 34 today and there are some concerns they may light off a missile to celebrate however there is also a scheduled discussion between NK and SK regarding the Olympics on Tuesday which should temper any aggression.
The Australian and New Zealand Dollar
Australia and New Zealand dollar see few events to move the dial for this week, and the currencies will likely trend with the broader move in the USD, commodities and risk appetite. Indeed the path of least resistance for both AUD and NZD appears higher, so long as USD weakness remains intact, the global growth narrative remains robust, and base metals and oil remain firm.Not too much of a stretch at this point.
The only issue is that a consensus is building that copper, gold and oil might struggle to push higher early in the week which could cause the cause the AUD and NZD to wobble a bit out of the gates this week
Asia FX
Asia currencies continue to outperform in early 2018. However, on Wednesday China Inflation data for December will influence broader sentiment in the Asia currency basket, but more so related commodity exporter countries.
In the meantime, the risk-on sentiment and cash equities buying is supporting the regional basket
The Malaysian Ringgit
USDMYR which spent 2017 grinding lower and finally cleared the 4.0 barrier with little fanfare almost as if it was a foregone conclusion. But a combination of USD weakness and firming oil prices appears to have been enough to break psychological support in USDMYR.The recent supply disruption and escalating middle east tensions are having a more significant impact on oil prices in the wake of OPEC recent supply cuts.
Rising oil prices bode well for the KLCI given that oil and gas constituents play a vital role in the bourses make up which is providing some decent inflow. But this is not merely an OIL related rally as the stronger global growth narrative is benefiting exporters also.
While the MYR should continue to strengthen on a benevolent Fed outlook and rallying energy prices, the market has most likely sufficiently priced in a BNM January rate hike so we may see the pace of appreciation slow down. As well, we should expect profit taking to set in ahead this months rate decision.
The Chinese Yaun
The Pboc appears unconcerned with rising rates and seems more concerned with attracting capital inflows. But with China rate hikes relatively well baked into the short end with CGB index inclusion rhetoric building which likely to draw massive waves of foreign investment flow, and coupled with prolonged weaker USD narrative, its convives the USDCNY tests 6.30 in 2018.
The Philippines Peso
Everybody loves the underdog and we should see an underweighted position wise PHP play a bit of catch up to the regional peers. The export picture has improved dramatically as the PHP lagged its regional peers in 2017 providing the Philippines with a regional competitive advantage. .President Duterte Tax Reforms are being embraced by investors while market reform has local sentiment pointed in a positive direction. Structurally in the past, the PHP has suffered from the lack of inflow other than overseas remittances, but there are subtle signs that foreign investment and equity inflows are picking up. While much of this could be attributed to a catch-up trade to regional peers there is not denying traders love a turnaround story and in early 2018 the PHP is being embraced.
EUR/USD Weekly Outlook
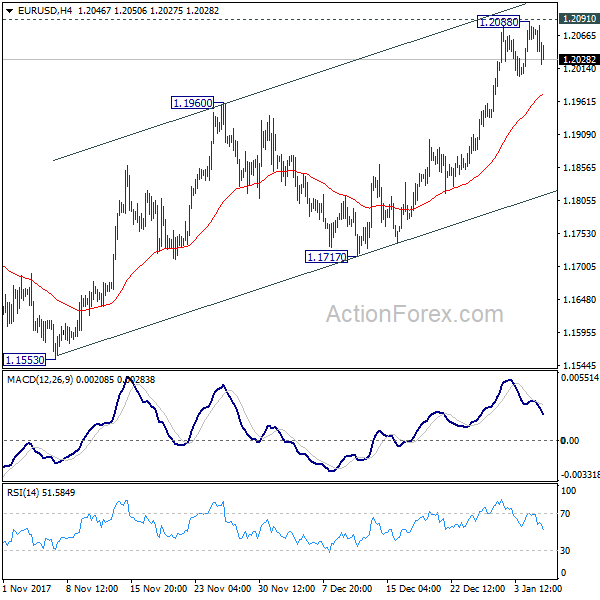
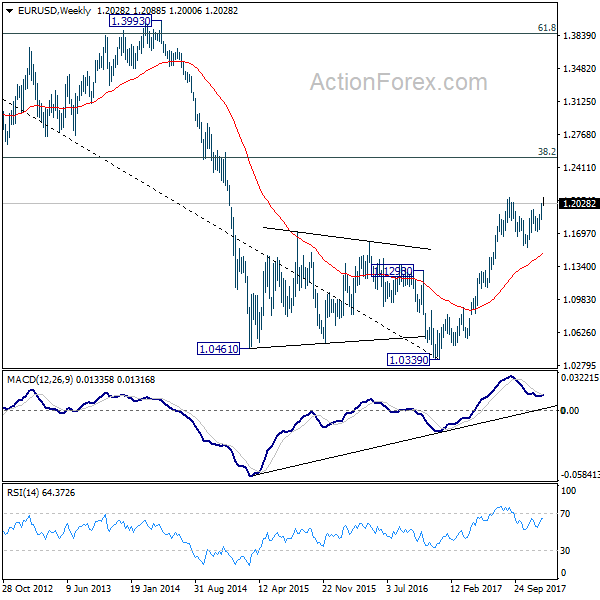
EUR/USD rose to 1.2088 last week but failed to take out 1.2091 resistance and retreated. Initial bias is neutral this week for some consolidations first. Further rise is expected as long as 4 hour 55 EMA (now at 1.1971) holds. Firm break of 1.2091 will confirm medium term rally resumption and target next key fibonacci level at 1.2494/2516. However, sustained break of 4 hour 55 EMA will extend the consolidation pattern from 1.2091 with another decline through 1.1717 support.
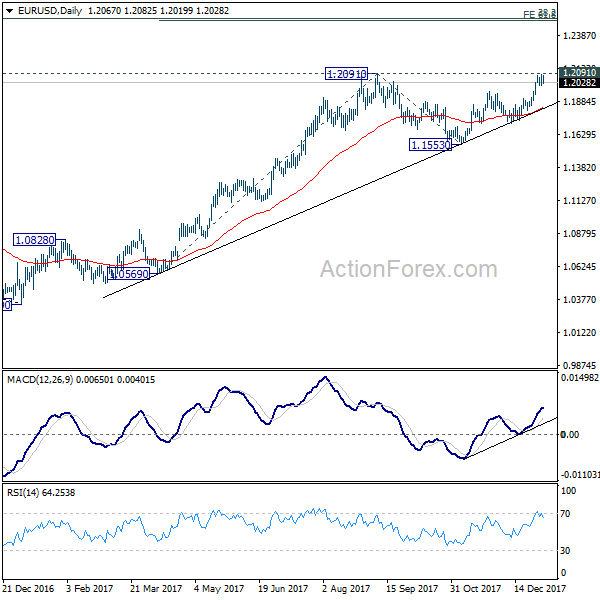
In the bigger picture, rise from 1.0339 medium term bottom is still seen as a corrective move for the moment. Therefore, in case of another rally, we'd be expect 38.2% retracement of 1.6039 (2008 high) to 1.0339 (2017 low) at 1.2516 to limit upside and bring reversal. That is also close to 61.8% projection of 1.0569 to 1.2091 from 1.1553 at 1.2494.
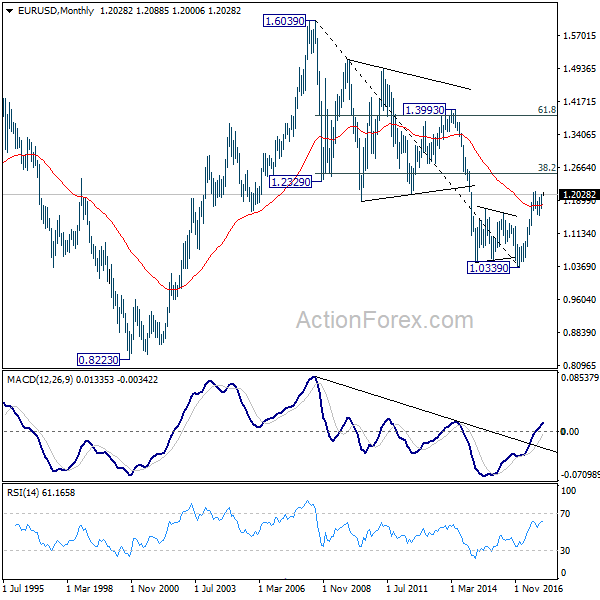
In the long term picture, 1.0339 is seen as an important bottom as the down trend from 1.6039 (2008 high) could have completed. It's still early to decide whether price action form 1.0339 is developing into a corrective or impulsive pattern. On the upside, strong resistance could be seen from 38.2% retracement of 1.6039 to 1.0339 at 1.2516. On the downside, we're not anticipating a break of 1.0339 in medium term.
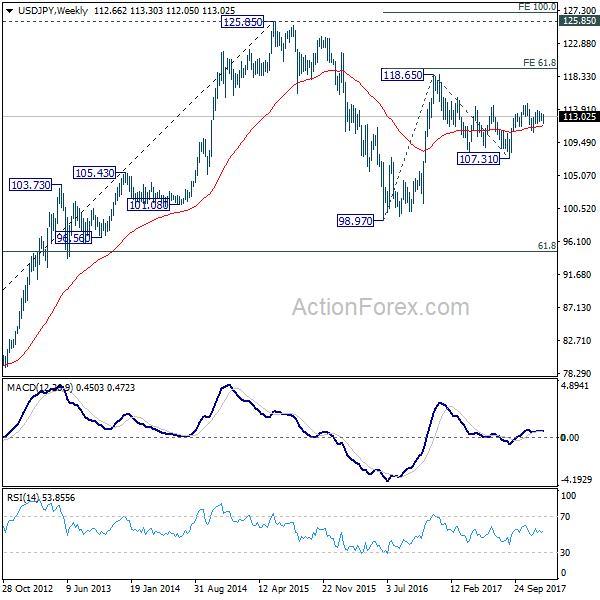
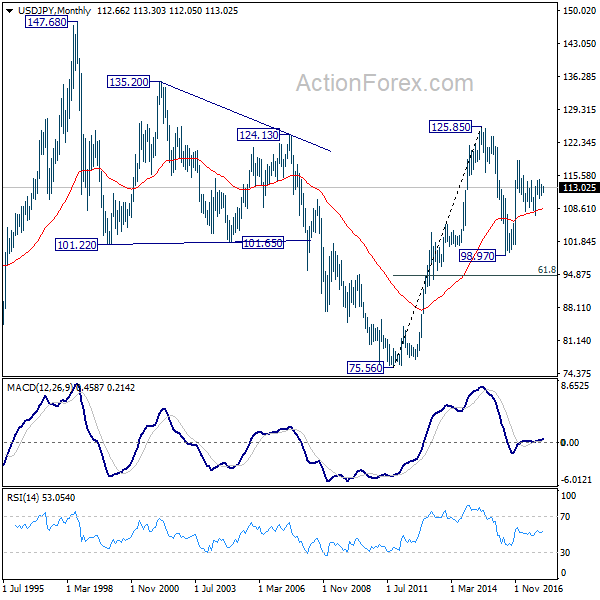
USD/JPY Weekly Outlook
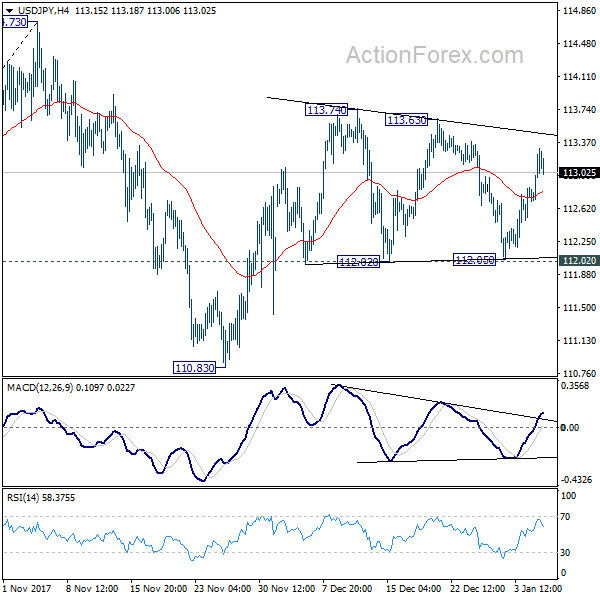
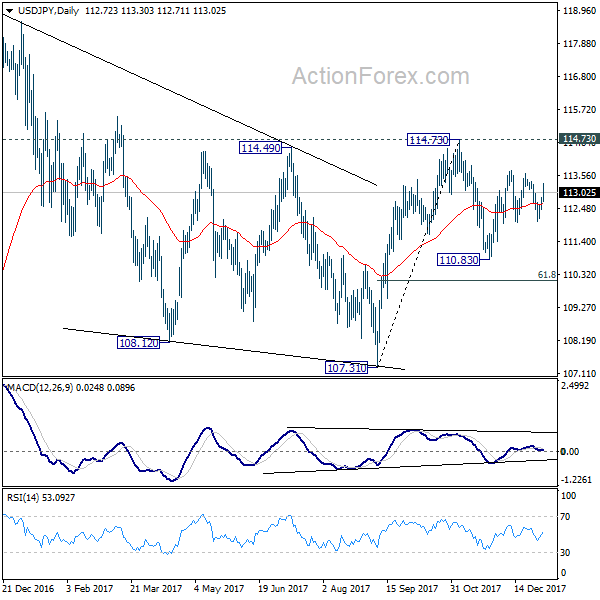
USD/JPY dipped to 112.05 last week but was supported above 112.02 and rebounded. As the pair stays in range of 112.02/113.74, initial bias remains neutral first. But again, outlook remains cautiously bullish as long as 112.02 holds and further rise is in favor. Break of 113.74 will resume the rebound from 110.83 and target 114.73 key resistance. Decisive break there will carry larger bullish implications. However, break of 112.02 will likely extend the corrective pattern from 114.73 with another leg through 110.83 support.
In the bigger picture, we're holding on to the view that correction from 118.65 is completed at 107.31. And medium term rise from 98.97 (2016 low) is going to resume soon. Sustained break of 114.73 should affirm our view and send USD/JPY through 118.65. However, break of 107.31 will dampen this view and extend the medium term fall back to 98.97 low.
In the long term picture, the rise from 75.56 (2011 low) long term bottom to 125.85 top is viewed as an impulsive move, no change in this view. Price actions from 125.85 are seen as a corrective move which could still extend. In case of deeper fall, downside should be contained by 61.8% retracement of 75.56 to 125.85 at 94.77. Up trend from 75.56 is expected to resume at a later stage for above 135.20/147.68 resistance zone.
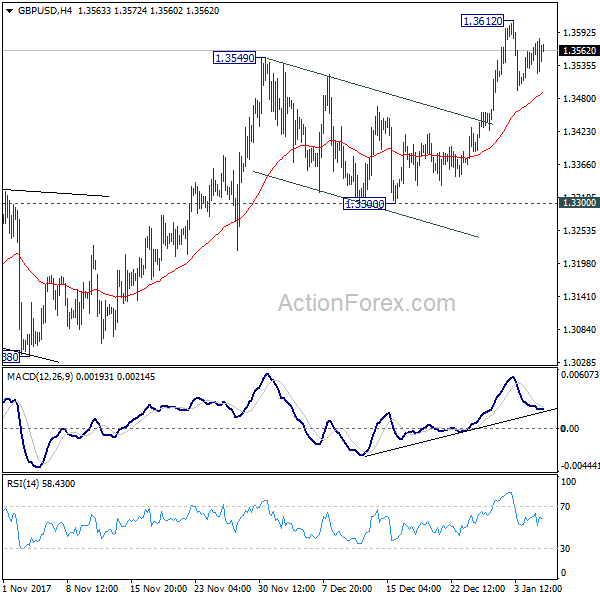
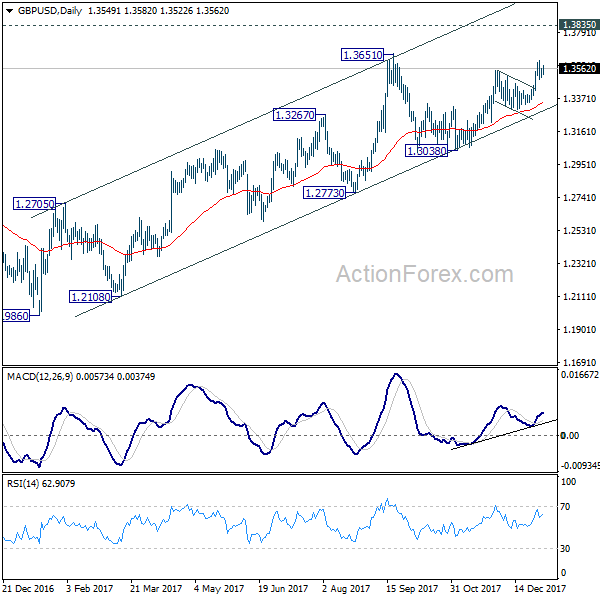
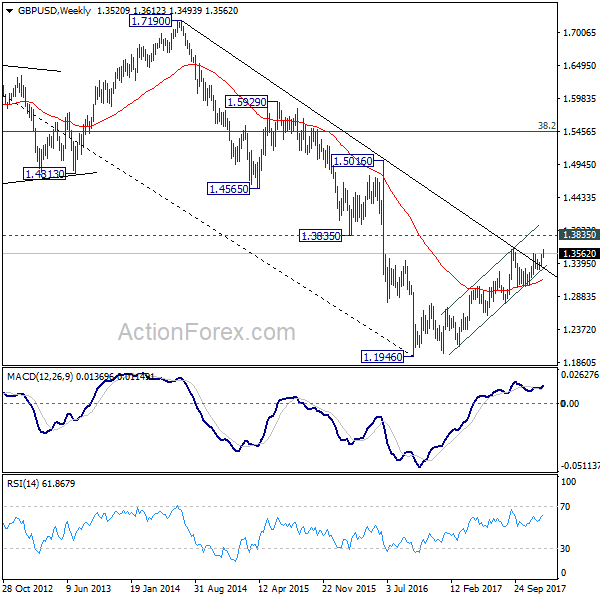
GBP/USD Weekly Outlook
GBP/USD's rise from 1.3038 resumed by taking out 1.3549 and reached as high as 1.3612. As a temporary top was formed, initial bias is neutral this week first. As long as 4 hour 55 EMA (now at 1.3490) holds, further rally is expected. Above 1.3612 will target 1.3651 key resistance first. Break will resume medium term rise from 1.1946 and target key resistance level at 1.3835. However, sustained break of 4 hour 55 EMA will turn focus back to 1.3300 support.
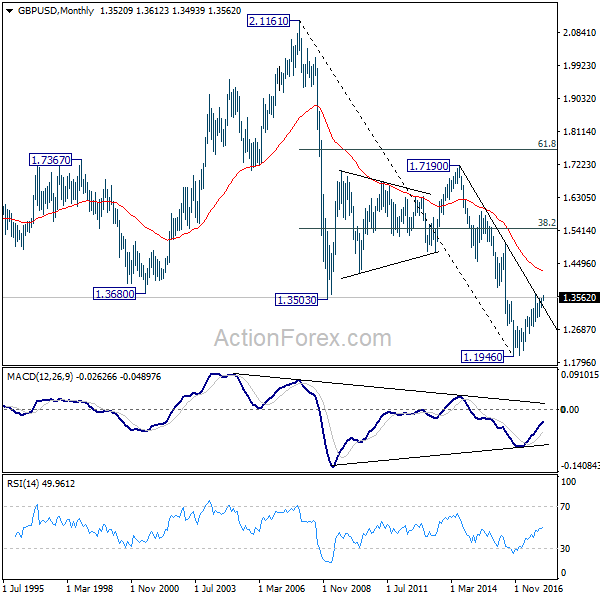
In the bigger picture, the break of long term trend line resistance from 1.7190 (2014 high) is seen as a sign of long term reversal. However, rise from 1.1946 (2016 low) is not impulsive looking. And the pair is limited below 1.3835 key resistance. Hence, we won't turn bullish yet and would continue to monitor the development. On the downside, break of 1.3038 support will now indicate that rebound from 1.1946 has completed and turn outlook bearish. Meanwhile, sustained break of 1.3835 should at least send GBP/USD to 38.2% retracement of 2.1161 (2007 high) to 1.1946 (2016 low) at 1.5466.
In the longer term picture,outlook is turned a bit mixed as GBP/USD is kept below 1.3835 key resistance even though rebound from 1.1946 is persisting. We'll stay neutral first and assess the outlook again and price actions unfold.
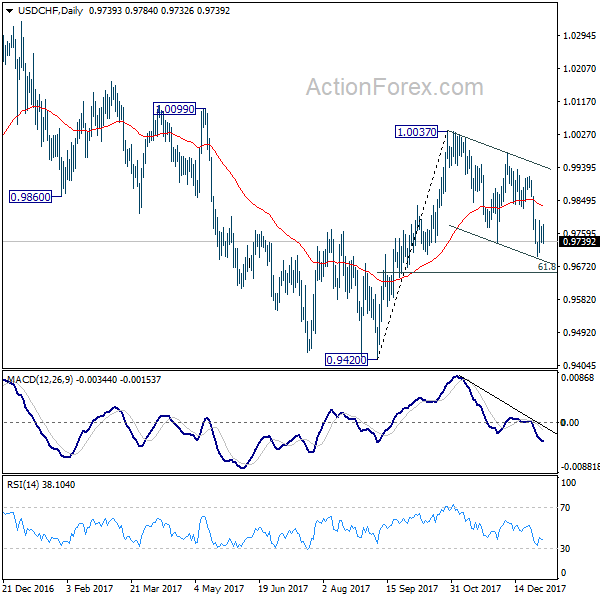
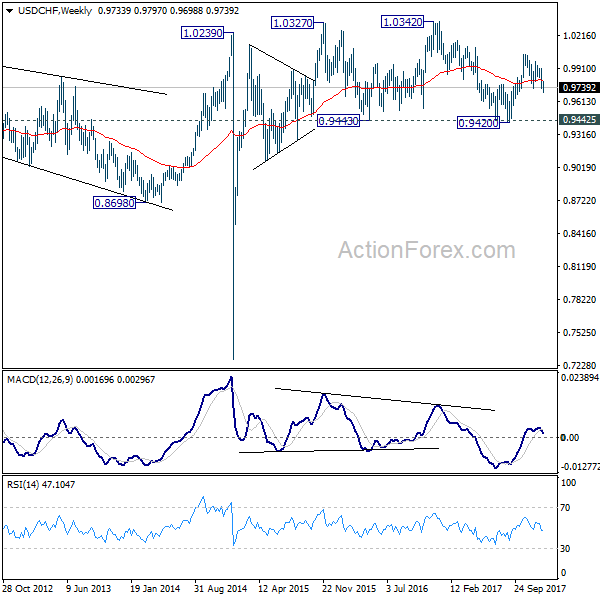
USD/CHF Weekly Outlook
USD/CHF edged lower to 0.9698 last week but was supported by near term falling channel line and recovered. Initial bias stays neutral this week first. As long as 4 hour 55 EMA (now at 0.9795) holds, deeper fall is mildly in favor. But we'd expect 61.8% retracement of 0.9420 to 0.1.0037 at 0.9656 to contain downside and bring rebound. Sustained break of 4 hour 55 EMA will argue that the correction from 1.0037 has completed and turn focus to 0.9977 resistance for confirmation.
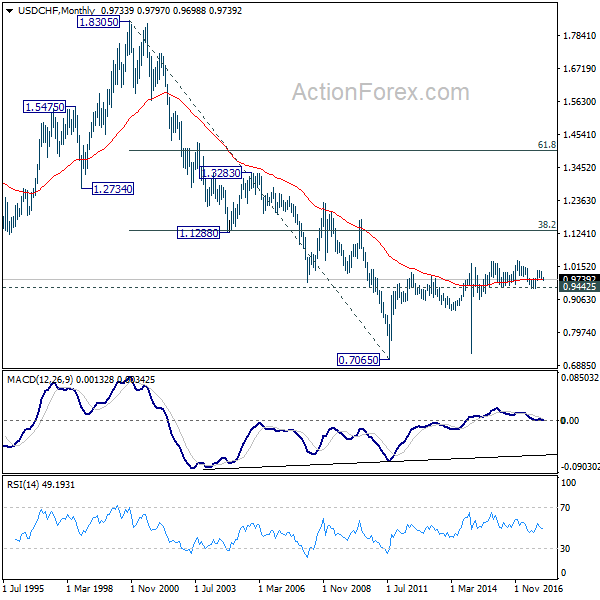
In the bigger picture, range trading continues between 0.9420/1.0342. At this point, 0.9420 appears to be a strong support level. Therefore, in case of decline attempt, we don't expect a firm break of this level. Nonetheless, strong break of 1.0342 is also needed to confirm upside momentum. Otherwise, medium term outlook will stay neutral.
In the long term picture, while upside momentum is unconvincing, with 0.9443 key support intact, rise from 0.7065 (2011 low) is still expected to continue. Break of 1.0342 will target 38.2% retracement of 1.8305 (2000 high) to 0.7065 at 1.1359.
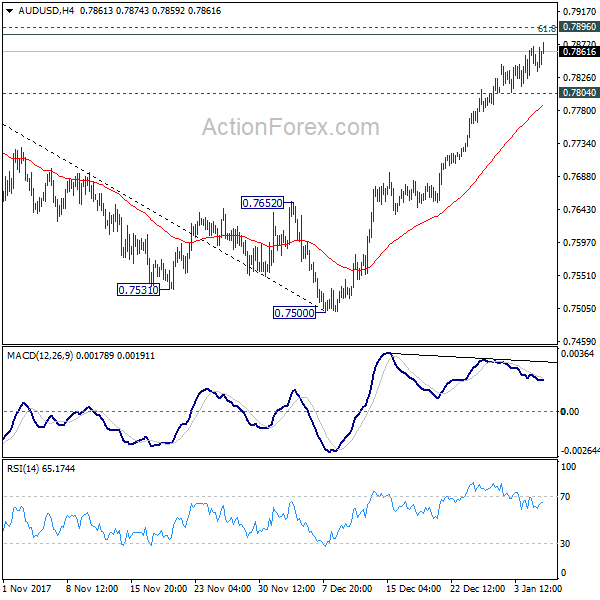
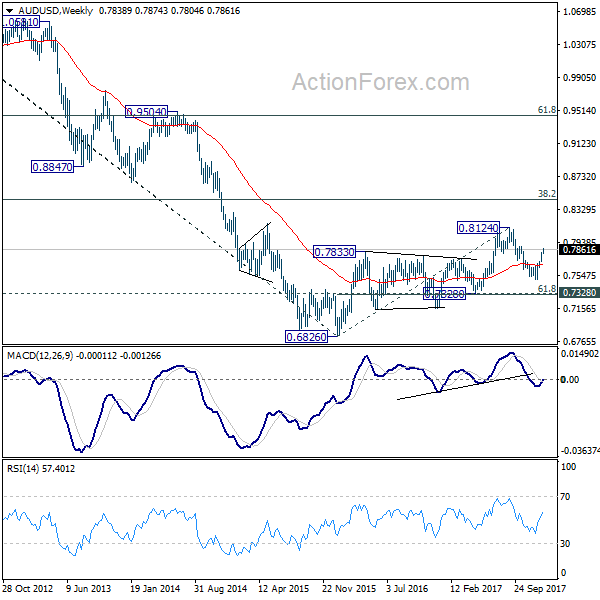
AUD/USD Weekly Outlook
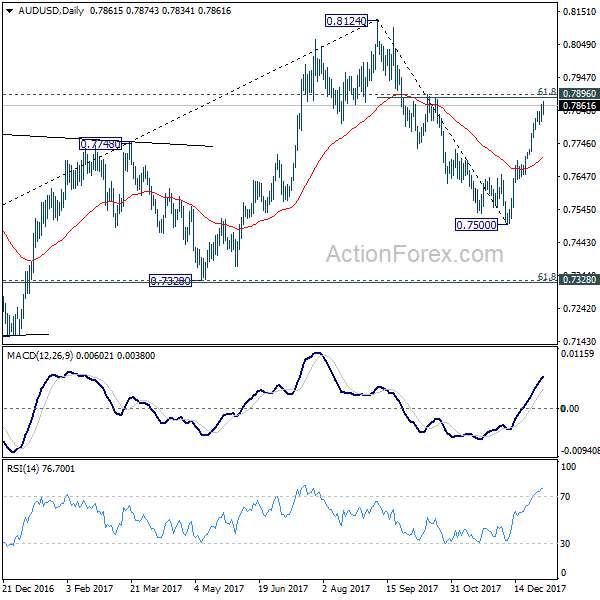
AUD/USD's rally continued last week and further rise could be seen initially this week. However, considering bearish divergence condition in 4 hour MACD, upside should be limited by 0.7896 cluster resistance (61.8% retracement of 0.8124 to 0.7500 at 0.7886) resistance zone to bring short term topping. Break of 0.7804 minor support will turn bias to the downside for 55 day EMA (now at 0.7701).
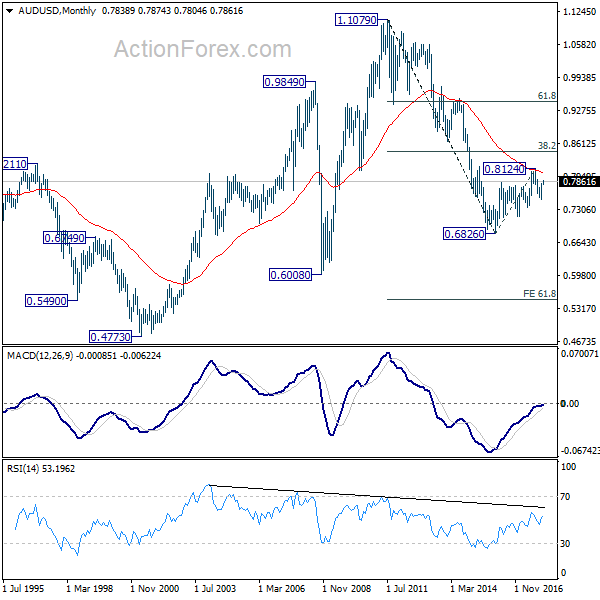
In the bigger picture, we're still slightly favoring the case that corrective rise from 0.6826 medium term bottom is completed at 0.8124, after hitting 55 month EMA (now at 0.8032). But stronger than expected rebound from 0.7500 is dampening this bearish view. On the downside, break of 0.7500 will target 0.7328 key cluster support (61.8% retracement 0.6826 to 0.8124 at 0.7322) to confirm this bearish case. But break of 0.8124 will extend the rise from 0.6826 to 38.2% retracement of 1.1079 (2011 high) to 0.6826 (2016 low) at 0.8451 before completion.
In the longer term picture, 0.6826 is seen as a long term bottom. Rise from there could either reverse the down trend from 1.1079, or just develop into a corrective pattern. At this point, we're favoring the latter. And, as long as 38.2% retracement of 1.1079 to 0.6826 at 0.8451 holds, we'd anticipate another decline through 0.6826 at a later stage. But strong support should be seen between 0.4773 (2001 low) and 0.6008 (2008 low).
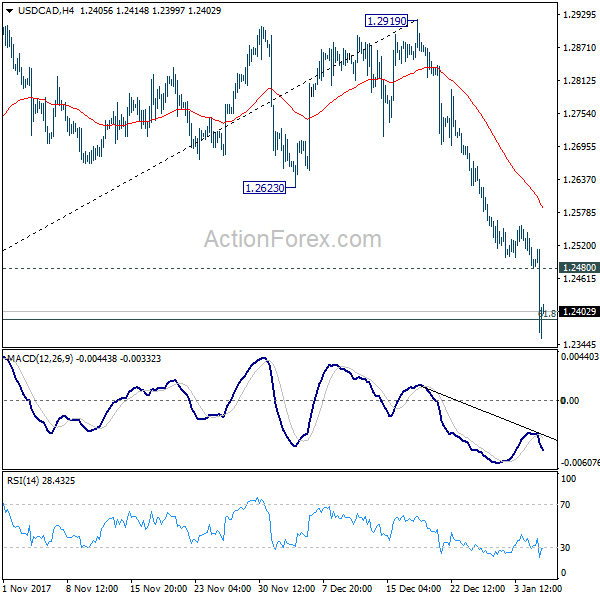
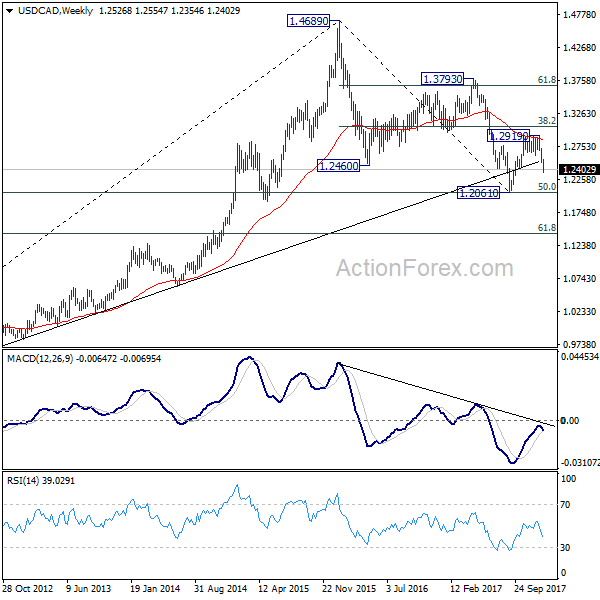
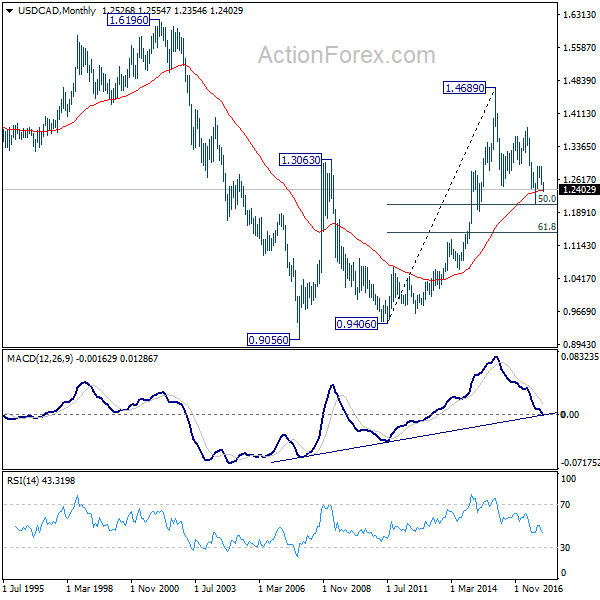
USD/CAD Weekly Outlook
USD/CAD's decline accelerated last week and breached 61.8% retracement of 1.2061 to 1.2919 at 1.2389. Based on the momentum, the pair is likely resuming larger down trend from 1.4689. Initial bias stays on the downside this week for retesting 1.2061 low. On the upside, above 1.2480 minor resistance will turn bias neutral and bring consolidation before staging another fall.
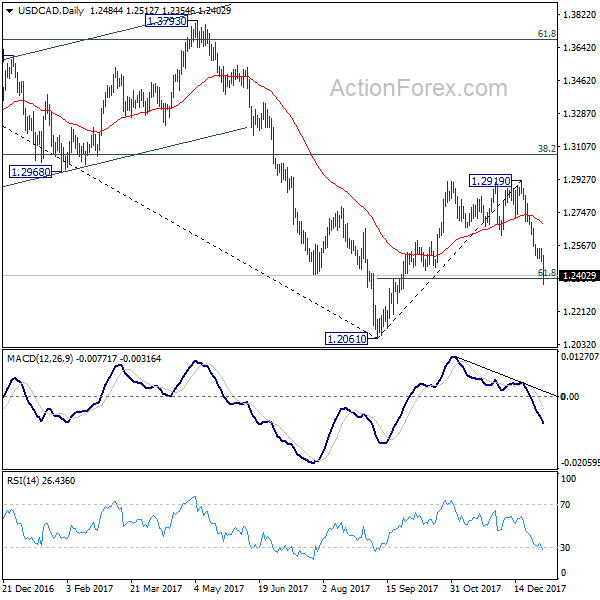
In the bigger picture, current development argues that rebound from 1.2061 has completed at 1.2919, rejected by 55 week EMA (now at 1.2850) and kept below 38.2% retracement of 1.4689 to 1.2061 at 1.3065. The development also suggests that long term fall from 1.4689 is not completed yet. Decisive break of 1.2061 low will target 61.8% retracement of 0.9406 to 1.4689 at 1.1424. This will now be the favored case as long as 1.2929 resistance holds.
In the longer term picture, 50% retracement of 0.9406 (2011 low) to 1.4689 (2015 high) at 1.2048 remains a key support level to watch. As long as this level holds, we'll treat fall from 1.4689 as a correction and expect another rally through this level. However, sustained break of 1.2048 will turn favors to the case that rise from 0.9056 (2007 low) is a three wave corrective move that's completed at 1.4689. And retest of 0.9056/9406 support zone could be seen in medium to long term.
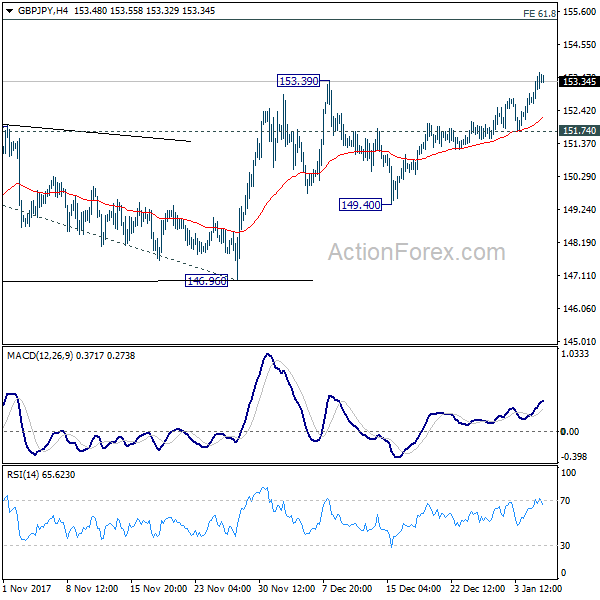
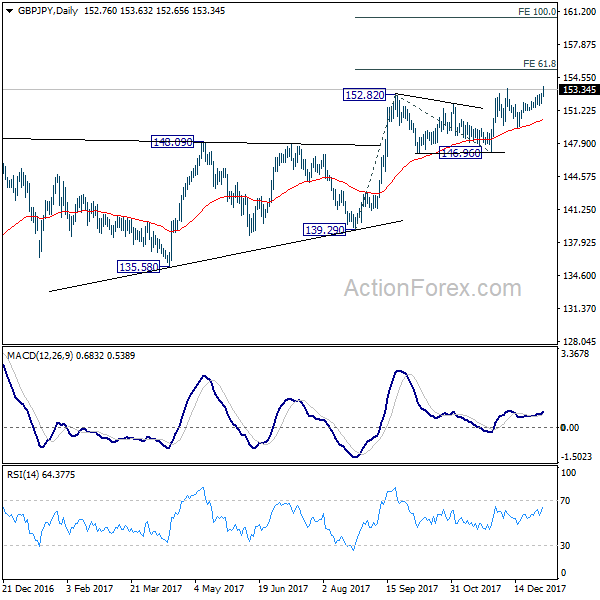
GBP/JPY Weekly Outlook
GBP/JPY's rise from 149.40 extended last week. Breach of 153.39 resistance suggests resumption of medium term rally. Initial bias remains on the upside this week for 61.8% projection of 139.29 to 152.82 from 146.96 at 155.32 first. Break will target 100% projection at 160.49. On the downside, break of 151.74 is needed to indicate short term topping. Otherwise, outlook will remain bullish in case of retreat.
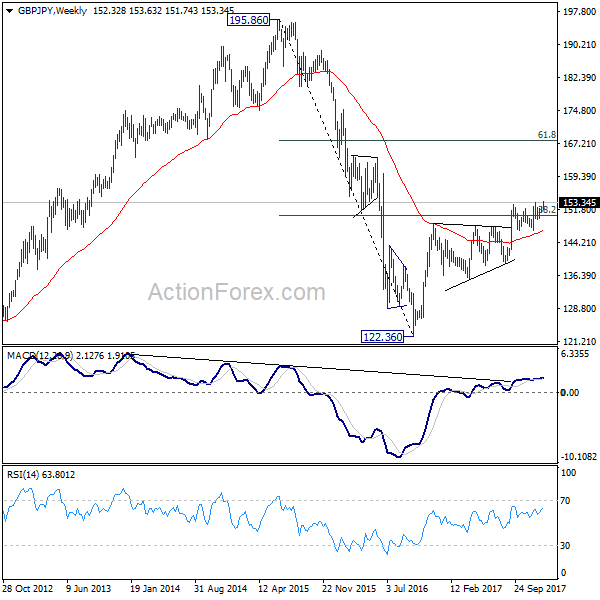
In the bigger picture, it now looks like GBP/JPY has finally taken out 38.2% retracement of 195.86 to 122.36 at 150.43. Medium term rise from 122.36 should be targeting 61.8% retracement at 167.78. This will now be the favored case as long as 146.96 support remains intact.
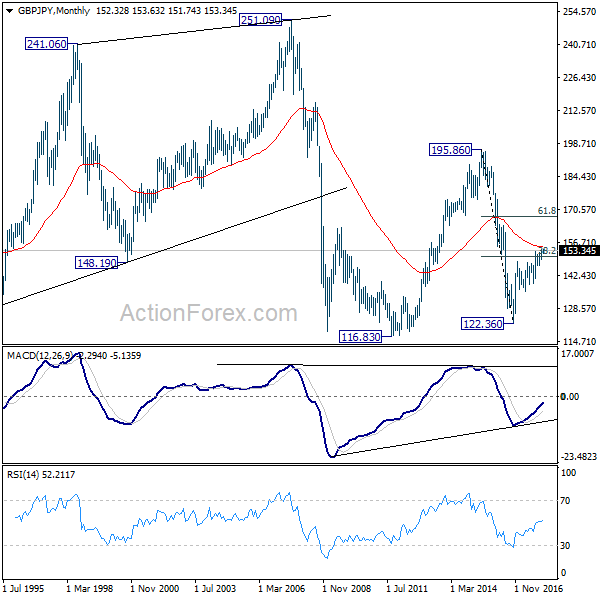
In the longer term picture, current rebound argues that the down trend from 195.86 (2015 high) has already completed at 122.36. Focus is now on 55 month EMA (now at 154.74). Firm break there will suggest that rise from 122.36 is developing into a long term move that target 195.86 again. And, price actions from 116.83 (2011 low) is indeed a sideway pattern that could last more than a decade.