Sample Category Title
Technical Outlook: SPOT GOLD – Thickening Daily Cloud Pressures For Test Of 200SMA
Spot Gold stands at the back foot on Monday and dipped close to last week's low at $1270, after coming under fresh pressure on signals that US tax cut plan is closer to passage.
Rising bearish pressure could result in break below $1270 where basing attempts were seen and eventual push towards key supports at $1266 (200SMA), $1263 (27 Oct low) and $1260 (01 Oct low).
Last Friday's strong rejection at daily cloud base and weekly close in red (the second straight bearish week) were negative signals.
Also, thickening daily cloud continues to weigh and support bearish scenario, along with expectations for rate hike on next week's FOMC monetary policy meeting.
Monday's action stays under thick hourly cloud (spanned between $1276 and $1283) which is expected to limit upticks and keep near-term focus at the downside.
Res: 1276, 1283, 1285, 1289
Sup: 1270, 1266, 1263, 1260
Dollar Higher After Senate Passes Tax Bill, Sterling In Wait-And-See Mode
The U.S. Senate's approval to pass the tax cut bill on Saturday overshadowed the continuing investigation into connections between U.S. President's inner circle and Russia. The U.S. dollar rallied across the board with most gains seen against the Yen which fell to a two-week low early Monday. U.S. 10-year treasury yields rose above 2.4% after falling 10 basis points on Friday. Although it does not appear that investors' optimism will send yields towards 2017 highs, if the yield curve manages to steepen further in December, we are likely to see more inflows to the U.S. dollar. This would largely depend on how talks between the Senate and the House develop in the weeks ahead, but with the government shut down looming, there's likely to be some noise in currency markets.
Brexit talks resume
Sterling is the only major currency treading water against the dollar on growing confidence that Brexit negotiations will move to a new stage when E.U. leaders meet in mid-December. Numerous reports last week indicated that the U.K. is getting closer to announcing a divorce bill that will lead to significant progress in Brexit talks. Today's meeting between Theresa May, Jean Claude Junker and Michel Barnier will provide an early indication of whether the U.K. is getting closer to negotiating trade deals. The three main barriers to overcome are the Brexit divorce bill, Irish Border and E.U. expatriates' rights. Significant progress on this front will likely push Sterling higher -to retest 2017 highs at 1.3656.
It is the non-farm payrolls week
The Federal Reserve is expected to continue tightening monetary policy by raising rates another 25 basis points on 13 November. Given that a final rate hike is already priced in, the trajectory in 2018 remains unclear given the uncertainty towards the fiscal progress and inflation path. Friday's non-farm payrolls will be the final jobs report released in 2017 and will help the Fed assess whether inflation is likely to strengthen next year. Nonfarm payrolls are expected to have increased by 198,000 in November, after climbing by 261,000 in October. According to Thompson Reuters, the key figure traders should focus on, is wages which have been the missing ingredient throughout this year. An increase in wages of 0.4% or above, will support the central bank's argument that low inflation should be attributed to temporary factors, and this should provide a further lift to the U.S. dollar.
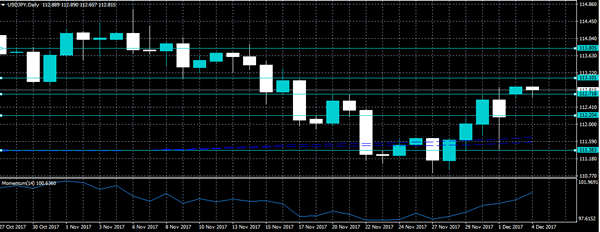
USDJPY Turning Bullish Above 112.70 Level
The U.S dollar is starting to recover upside momentum against the Japanese yen, hitting 112.81, as the U.S dollar index recovers after the U.S Republican party passed their tax reform package late Friday. The USDJPY pair has recovered all of Friday’s losses, after the pair touched 111.30, as reports surfaced that Michael Flynn had admitted to lying about Russian collusion to the FBI. Markets will be focused on any further details coming out about the Russian collusion case, and if any more members of the Trump administration were involved.
Should price action hold above the 112.70 technical level, intraday buyers may look to test towards the 113.10 level, with extended upside resistance at 113.80.
If USDJPY buyers fail to hold the 111.70 level again, a move back down towards the 112.20 level appears likely. The 111.30 level offers extended resistance.
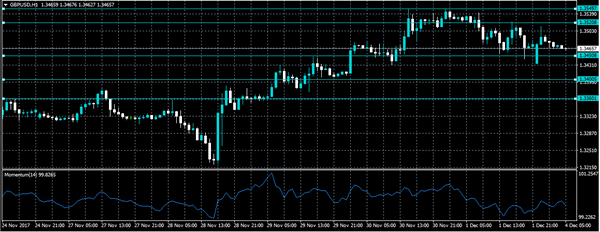
GBPUSD Turning Bearish Below 1.3450 Level
The British pound has slipped lower against the U.S dollar, moving towards the 1.3430 level during the early Asian session. A stronger U.S dollar index and political jitters are weighing on the GBPUSD pair, as the UK today reaches its December 4th deadline to submit an enhanced Brexit proposal to the European Union. The British pound is likely to be increasingly volatile today, as markets awaits news of a potential deal between the UK and the EU. Traders also look to the release of the UK Construction PMI in the upcoming European trading session.
The GBPUSD pair remains intraday bearish while trading below the key 1.3450 level. Further downside towards the 1.3400 and 1.3360 levels seems possible.
Should price-action on the GBPUSD pair start to hold above the 1.3450 level, buyers are likely to push price-action back towards the 1.3520 and 1.3549 resistance levels.
EUR/USD Elliott Wave Analysis
EUR/USD – 1.1863
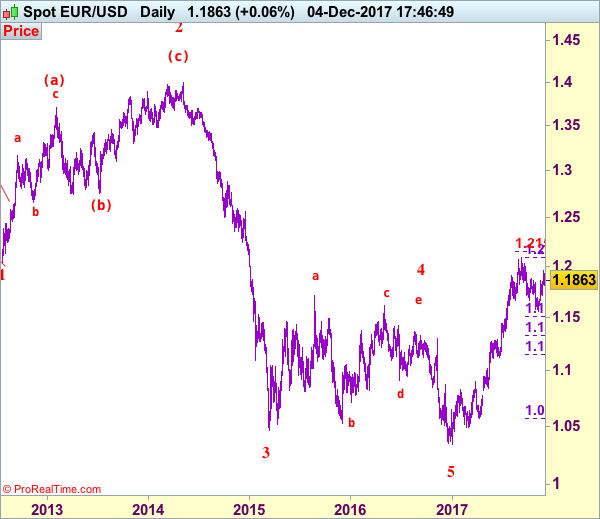
EUR/USD: Wave (c) of 2 ended at 1.3993 and wave 3 of III has commenced for weakness to 1.0411 (1.236 of wave 1), then 1.0000.
As the single currency retreated after meeting resistance at 1.1961 early last week, suggesting consolidation below this level would be seen, however, reckon downside would be limited to 1.1800-10 and bring another rise later, above said resistance would signal the rise from 1.1554 is still in progress, bring further gain to 1.2000. Looking ahead, only a break above resistance at 1.2035 would retain bullishness and signal early upmove has resumed for retest of 1.2093 first. A break of this resistance would confirm resumption of recent upmove from 1.0340 low for headway to 1.2150-55 (61.8% projection of 1.1119-1.1910 measuring from 1.1662), then 1.2200-10.
Our preferred count on the daily chart remains that a wave (II) from 1.2329 ended at 1.5145 with A-leg ended at 1.4720, followed by wave B at 1.2457, the wave C from there was also a 3 legged move and is labeled as (a): 1.3739, (b): 1.2885, the wave iii of the 5-waver (c) from 1.2885 has ended at 1.4339 and wave iv is a triangle ended at 1.3878 and wave v formed a top at 1.5145. The decline from there is a 5-waver (C) with minor wave (i) of I of (C) ended at 1.4218 with wave (ii) ended at 1.4580, wave (iii) ended at 1.3267 and wave (iv) ended at 1.3692 and wave (v) ended at 1.1876, this is also the low of wave I of (C) and wave II ended at 1.4940, hence wave III is now in progress with a diagonal wave 1 ended at 1.2042, the breach of previous support at 1.1876 (wave I trough) adds credence to our view that the wave 2 has ended at 1.3993, wave 3 has commenced for further weakness to 1.0411, then towards 1.0000.
On the downside, expect downside to be limited to 1.1800-10 and bring rebound later. Below 1.1770-80 would risk weakness towards indicated support at 1.1713, however, only break there would abort and signal the rise from 1.1554 low has ended, bring weakness to 1.1650-60 but price should stay well above said support at 1.1554, bring another rebound later.
Recommendation: Hold long entered at 1.1880 for 1.2080 with stop below 1.1780.
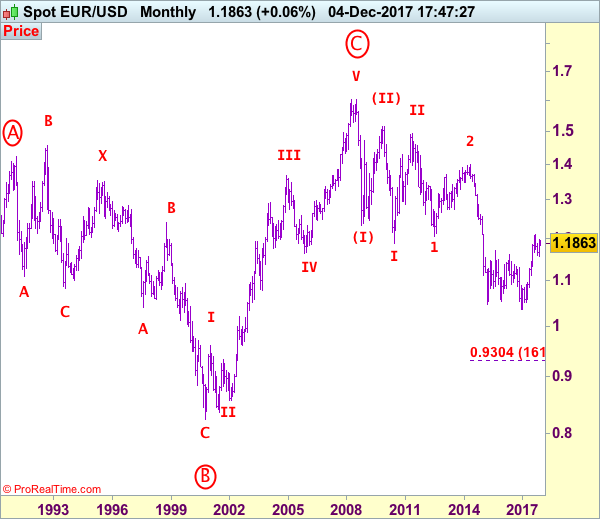
Euro's long-term uptrend started from 0.8228 (26 Oct 2000) with an impulsive structure. The rise from 0.8228 to 0.9593 (5 Jan 2001) is labeled as wave I, the retreat to 0.8352 (6 Jul 2001) is wave II and the rally to 1.3670 (31 Dec 2004) is wave III. Wave IV from there ended at 1.1640 (15 Nov 2005), the subsequent upmove to 1.6040 (July 15, 2008) is treated as wave V, the major selloff from the record high of 1.6040 to 1.2329 (October 27, 2008) signals a reversal has taken place with (I) leg ended at 1.2329 and once (II) ended at 1.5145, wave (III) itself is an extended move with I: 1.1876 and complex wave II ended at 1.4902, wave III has commenced with wave 1 and 2 ended at 1.2042 and 1.3993 respectively, wave 3 of III is now unfolding for weakness towards parity.
Gold Sees Risk Titled To The Downside In Near-Term
Gold has seen some choppy trading recently and overall the bias is to the downside as the market remains below the key 1300 level. Prices dropped sharply after an attempt to break above 1290 was not sustained.
The near-term picture is less positive as the flow is back to the downside and the RSI is below 50 in bearish territory on the 4-hour chart. The market is also below the 50 and 200-period moving averages.
Immediate support is expected at 1270 – an area that has been tested already. Failure to hold would see prices extend lower to target the October 27 low of 1263.43 and then the key 1260 area.
Gold prices would need to break above resistance at 1290 and rise above the key psychological level of 1300 to shift the focus back to the upside. The continued upside would target the September 7 peak of 1357.47, a level not seen since August 2016.
For now, the corrective sell-off from 1290 is still in effect and the intra-day price action is soft. Risk is clearly tilted to the downside. In the bigger picture, the market remains in a neutral phase as the consolidation continues.
Trade Idea: AUD/USD – Sell at 0.7620
AUD/USD – 0.7597
Original strategy:
Exit short entered at 0.7620
Position: - Short at 0.7620
Target: -
Stop:-
New strategy :
Sell at 0.7620, Target: 0.7470, Stop: 0.7660
Position: -
Target: -
Stop:-
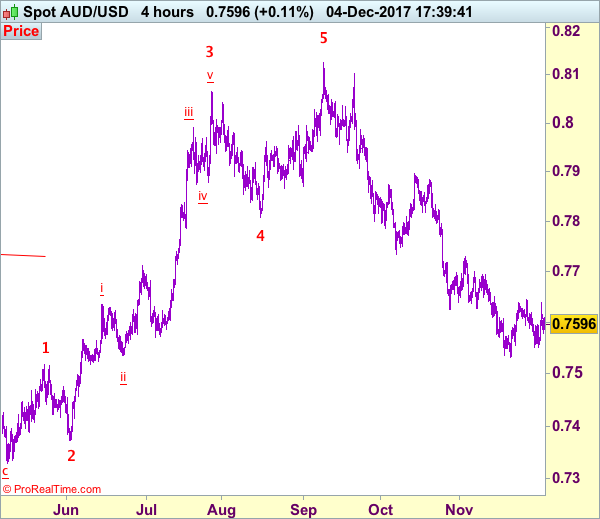
Although aussie rebounded after finding support at 0.7551 and further consolidation above recent low at 0.7532 would be seen, reckon last week’s high at 0.7645 would limit upside and bring another decline later, below 0.7551 support would signal the rebound from 0.7532 has ended, bring retest of this level, break there would confirm recent decline from 0.8125 top has resumed for further weakness to 0.7500, then 0.7470.
In view of this, we are looking to sell aussie on recovery as 0.7620-25 should limit upside. A firm break above said resistance at 0.7645 would suggest another leg of corrective rise from 0.7532 is underway and bring a stronger retracement of recent decline towards resistance at 0.7701 which is likely to hold from here.
On the 4-hour chart, recent upmove from 0.7329 is unfolding as an impulsive rise with wave 3 as well as smaller degree wave (iii) extending, only minor wave v of (iii) has ended at 0.8125, hence bullishness remains for this move to extend headway to 0.8200, then towards 0.8300, however, reckon upside would be limited to 0.8400 and the final wave 5 should falter below 0.8500, bring correction later.
USD/JPY Ascending Scallop Formed Straight After The Gap
Following the possibly most substantial US tax overhaul since the 1980s, the US Senate gave a significant boost to the USD last night. The corporate tax rate should be cut from 35 percent to 20 percent. The USD/JPY opened much higher than it closed on Friday, making a runaway gap that hasn't been closed as of yet. Previous analysis followed exactly as planned before the pair dropped due to out of the blue news that Flynn will testify against Trump.
At this point, the USD/JPY is barely retracing from the W H4/ ATR pivot confluence -113.05-20 zone. It could go for 112.65 retest, but the gap will be almost closed completely only if it gets to POC zone 112.20-45. There we could see a bounce towards the 113.60 zone. However, if we don't see a retracement, then pay attention to 113.20. The move above it might lead to 113.60.
W H4 - Weekly Camarilla Pivot (Strong Weekly Resistance)
D H4 - Daily Camarilla Pivot (Very Strong Daily Resistance)
D L3 – Daily Camarilla Pivot (Daily Support)
D L4 – Daily H4 Camarilla (Very Strong Daily Support)
POC - Point Of Confluence (The zone where we expect price to react aka entry zone)
USD/JPY Candlesticks and Ichimoku Analysis
Weekly
• Last Candlesticks pattern: Dark cloud cover
• Time of formation: 10 Jul 2017
• Trend bias: Down
Daily
• Last Candlesticks pattern: Evening doji
• Time of formation: 7 Aug 2017
• Trend bias: Down
USD/JPY – 112.87
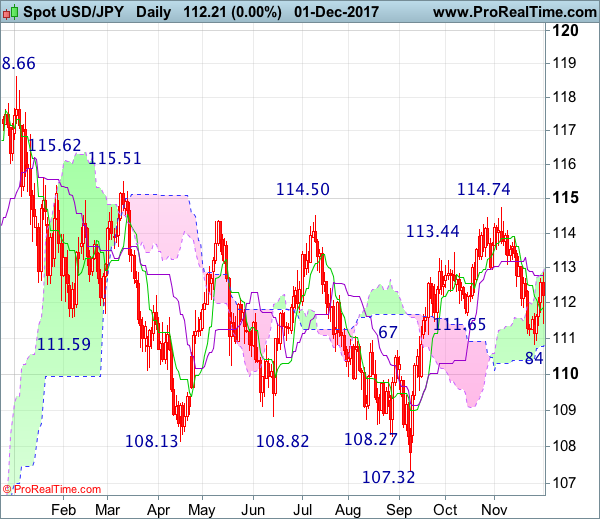
Although the greenback retreated on Friday to 111.41, as dollar found decent demand there and has rallied (the pair opened higher this week), suggesting the rise from 110.84 is still in progress, hence mild upside bias is for this move to extend further gain to 113.30-35, then test of resistance at 113.91, however, a daily close above this level is needed to retain bullishness and confirm the fall from 114.74 has ended, bring further gain to 114.40-50 first.
On the downside, whilst pullback to 112.40-50 cannot be ruled out, reckon the Tenkan-Sen (now at 111.96) would limit downside and bring another rise later. Only a drop below strong support at 111.37-41 would abort and suggest the rebound from 110.84 has ended instead, bring retest this level. In the unlikely event that dollar drops below 110.84, this would shift risk back to downside for the fall from 114.74 top to extend weakness to 110.00, then 109.50-60 but price should stay above 109.00-10.
Recommendation : Exit short entered at 112.90 and buy at 112.10 for 114.10 with stop below 111.30
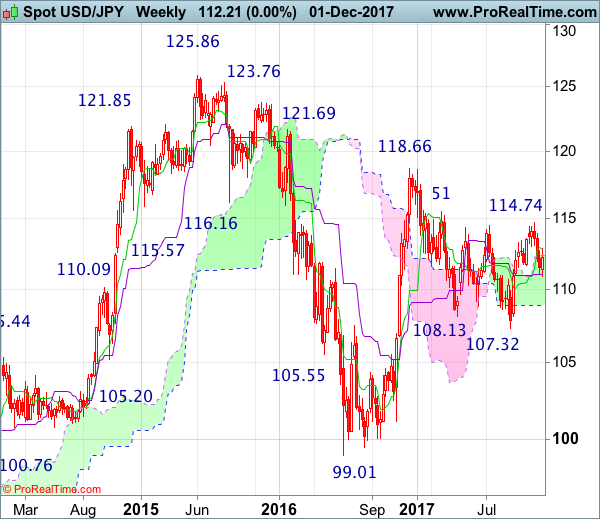
On the weekly chart, this week’s gap-up opening suggests low has possibly been formed at 110.84 last week and consolidation with mild upside bias is seen for gain to resistance at 113.91, however, a sustained breach above this level is needed to retain bullishness and signal the pullback from 114.74 has ended, bring retest of this level. Once this resistance is penetrated, this would signal the rise from 107.32 low has resumed for headway to 115.51-62 resistance area, break there would add credence to our view that early erratic decline from 118.66 has ended at 107.32, then upmove to 116.50-60 and possibly 117.00-10 would follow.
On the downside, expect pullback to be limited to 112.00-10 and bring another rebound later to aforesaid upside targets. Below said support at 111.41 would abort and suggest the rebound from 110.84 has ended instead, bring retest of this level, break there would extend the fall from 114.74 to 110.00-10, then 109.50-60 but reckon downside would be limited to 109.00 and 108.10-15 should hold from her, bring rebound later.
Technical Outlook: AUDUSD – Recovery Attacks 20SMA Barrier Again, Firm Break To Signal Further Upside
The Aussie dollar is regaining traction and returns above 0.7600 handle, after dipping to 0.7579 low, following gap-lower opening on Monday. Last Friday's strong rally which broke and closed above falling trendline (tracked the downtrend since Mid-Sep) was strong bullish signal, as rally has nearly fully retraced last week's 0.7644/0.7551 fall. Fresh gains pressure cracked 20SMA barrier (currently at 0.7608) close above which is needed to generate fresh bullish signal for extension of recovery rally from 0.7551, towards strong barrier at 0.7691 (200SMA). Failure to clear 20SMA would keep the downside vulnerable of fresh attacks.
Res: 0.7608, 0.7635, 0.7644, 0.7691
Sup: 0.7579, 0.7551, 0.7530, 0.7500