Sample Category Title
Dollar And Equities Sentiment Upbeat, Market Awaits Brexit Meeting
Here are the latest developments in global markets:
FOREX: The dollar bounced to a 2-½ -week high against the yen during Asian trading following the approval of the tax overhaul bill by the Senate on Saturdaydespite persisting political noise in the country. Consequently, the dollar’s strength pushed other currencies lower, with the kiwi being the worst performer of the session.
STOCKS: The Nikkei 225 finished 0.5% lower and the Hang Seng was up by 0.5% minutes before the day’s close; Euro Stoxx 50 futures traded 1.2% up at 0747 GMT; Dow, S&P 500 and Nasdaq 100 futures were up by 0.9%, 0.6% and 0.45%, gaining on positive sentiment after the Senate’s approval of the tax-cut bill.
COMMODITIES: Oil prices opened weaker but close to two-year high levels. WTI crude was down 0.77%, trading at $57.91 per barrel and Brent retreated by 0.55% to $39.Gold fell back to three-week low levels, trading at $1,273.41 per ounce (-0.55%) as investors appeared to be in a risk-on mood.
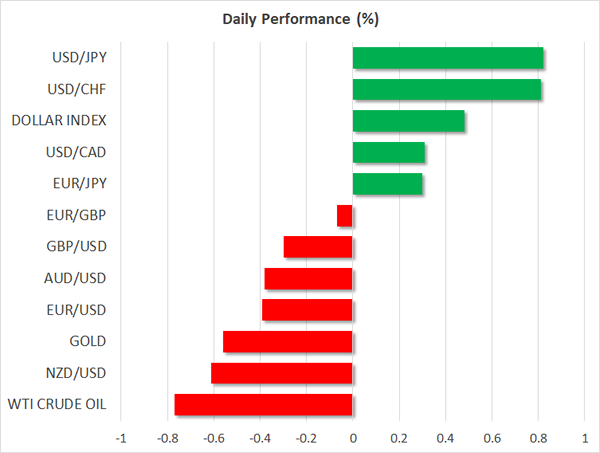
Major movers: Dollar drifts higher on tax relief; pound holds strong
The Senate passage of the US tax legislation on Saturday brought Republicans closer to reach their goal of providing the biggest tax cut since the 1980s to both businesses and individuals. The news provided strong support to the dollar, erasing Friday’s sharp losses which emerged after the former US security advisor, Michael Flynn, admitted lying in relation to his discussions with the Russian Ambassador Sergey Kislyak during the 2016 presidential transition.
Dollar/yen jumped by 0.75% to 112.94, dollar/swissie bounced by 0.66% to 0.9827, while euro/dollar declined by 0.26% to 1.1858. The pound posted moderate losses versus the greenback as positive sentiment on Brexit developments underpinned the currency. Pound/dollar fell by 0.17% to 1.3439.
The aussie was moving sideways against the greenback as a rally in iron ore prices and better than expected data on Australian business inventories offset losses arising from a stronger dollar. Aussie/dollar was flat around $0.7601. Its New Zealand cousin pulled back by 0.40% to $0.6857.
Day ahead: UK construction PMI, eurozone producer prices & investor confidence and US factory orders to gather attention – May’s Brexit meeting also eyed
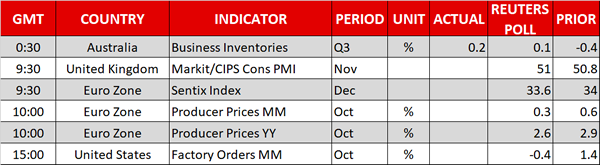
At 0930 GMT, the UK will see the release of November construction PMI figures. The index is expected to rise to 51.0 from October’s 50.8. A reading of 50 indicates zero sectoral growth. Pound/dollar has been one of the major gainers during the preceding week on the back of positive Brexit developments and it would be interesting to see if the data provide further bullish momentum for the pair.
Out of the eurozone, December’s Sentix investor confidence index will be made public at 0930 GMT and data on producer prices for the month of October are due at 1000 GMT. Both readings are expected to reflect a slowdown relative to their previous releases.
The US will see the release of October factory orders at 1500 GMT. These are anticipated to decline by 0.4% m/m after growing by 1.4% in September.
In politics, after the US Senate’s approval of the tax-cut bill, the Senate and the House would have to work on reconciling their respective versions of the bill – discussions are expected to get underway this week. Beyond this, developments on the probe relating to Russian interference in last year’s presidential elections could also prove dollar-moving, while on the Brexit front, UK PM Theresa May will today be having a meeting with European Commission President Jean-Claude Juncker and the EU’s chief Brexit negotiator Michel Barnier.
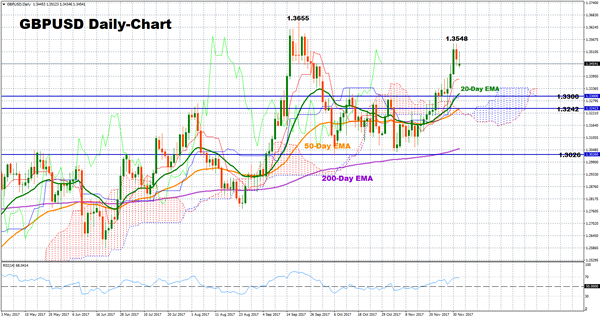
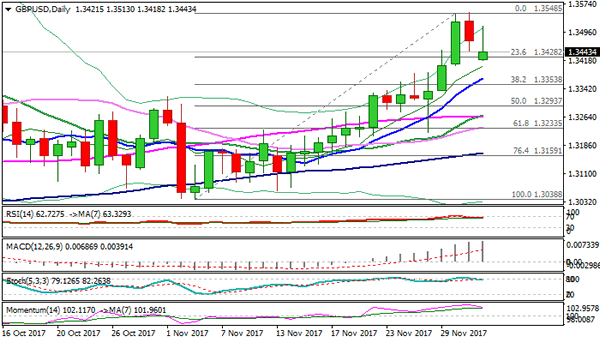
Technical Analysis: GBPUSD bullish bias still in place
GBPUSD remains bullish in the short-term, trading relatively close to two-month high levels as investors see positive Brexit developments on the horizon. Price action is taking place above the exponential moving average lines (EMA) as well as above the Ichimoku cloud, while the bullish cross between the 20-day and the 50-day EMA on November 16 also suggests positive movements in the near-term. The RSI has flattened out marginally below overbought levels, hinting that the pair might range for a while before a likely uptrend resumes.
Should the pair head up, immediate resistance is likely to occur at the two-month high of 1.3548. Further above, there is scope for a test of the one-year high of 1.3655. On the downside, strong support could be found at the 1.33 key-level which was recently an area of resistance. From here, corrective movement might target the 50-day EMA at 1.3242 before the focus shifts to a previous low of 1.3026.
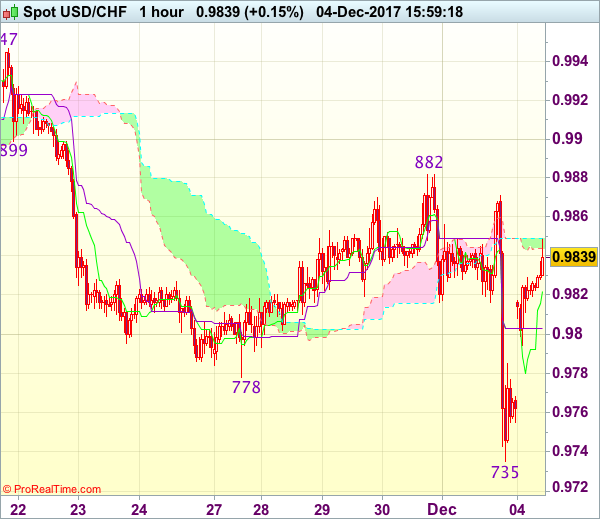
Trade Idea : USD/CHF – Buy at 0.9785
USD/CHF - 0.9826
Most recent candlesticks pattern : N/A
Trend : Near term down
Tenkan-Sen level : 0.9833
Kijun-Sen level : 0.9803
Ichimoku cloud top : 0.9849
Ichimoku cloud bottom : 0.9841
Original strategy :
Exit short entered at 0.9860,
Position : - Short at 0.9860
Target : -
Stop : -
New strategy :
Buy at 0.9785, Target: 0.9885, Stop: 0.9750
Position : -
Target : -
Stop : -
Although the greenback dropped sharply to as low as 0.9735 on Friday, the subsequent reversal on dollar’s broad-based strength suggests low is formed there and consolidation with upside bias is seen for gain to last week’s high at 0.9882, however, a sustained breach above this level is needed to confirm this view and bring at least a retracement of recent decline to 0.9900 and later towards resistance at 0.9947.
In view of this, we are looking to buy dollar on dips as 0.9775-85 should limit downside and bring another rebound. Below 0.9750 would risk a retest of said last week’s low at 0.9735 but only break there would signal the decline from 1.1038 top has resumed for weakness to 0.9705 support.
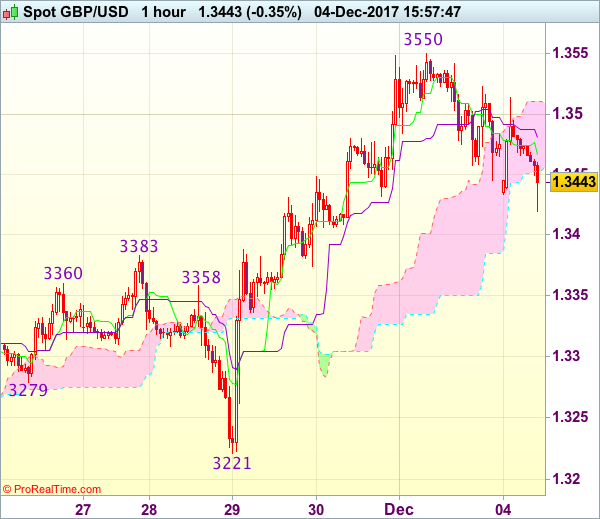
Trade Idea : GBP/USD – Buy at 1.3380 or sell at 1.3500
GBP/USD - 1.3446
Most recent candlesticks pattern : N/A
Trend : Near term up
Tenkan-Sen level : 1.3457
Kijun-Sen level : 1.3481
Ichimoku cloud top : 1.3511
Ichimoku cloud bottom : 1.3453
Original strategy :
Buy at 1.3410, Target: 1.3540, Stop: 1.3375
Position : -
Target : -
Stop : -
New strategy :
Buy at 1.3380, Target: 1.3480, Stop: 1.3345
O.C.O.
Sell at 1.3500, Target: 1.3400, Stop: 1.3535
Position : -
Target : -
Stop : -
As cable has slipped again after meeting resistance at 1.3514, suggesting near term downside risk remains for the retreat from 1.3550 (last week’s high) to bring retracement of recent rise, hence weakness to 1.3400-05 is likely, however, reckon downside would be limited to 1.3380-85 (50% Fibonacci retracement of 1.3221-1.3550) and bring rebound to 1.3500 but upside should be limited to 1.3515-25, bring another corrective decline later.
In view of this, whilst we are still looking to buy cable on further corrective fall, we would also sell sterling on recovery as 1.3500 should limit upside. Above 1.3515-25 would signal the retreat from 1.3550 has ended, bring retest of this level, then 1.3575-80 but reckon 1.3600-10 would hold. Below 1.3345-50 (61.8% Fibonacci retracement of 1.3221-1.3550) would abort and signal top has been formed at 1.3550, bring further fall towards 1.3300-10.
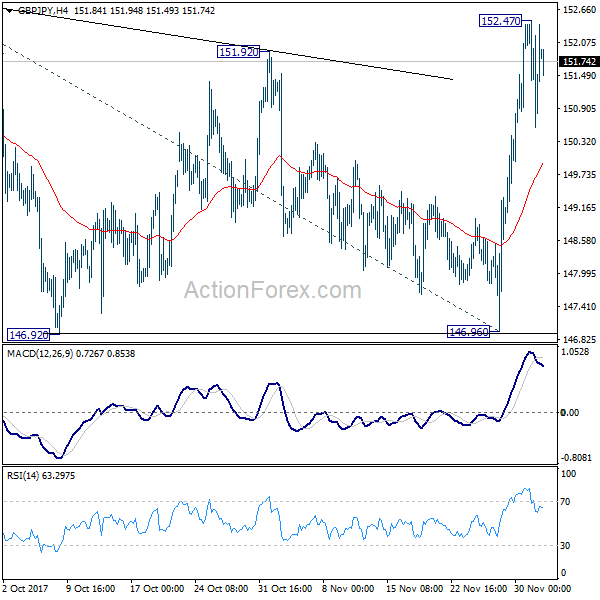
GBP/JPY Daily Outlook
Daily Pivots: (S1) 150.23; (P) 151.35; (R1) 152.16; More...
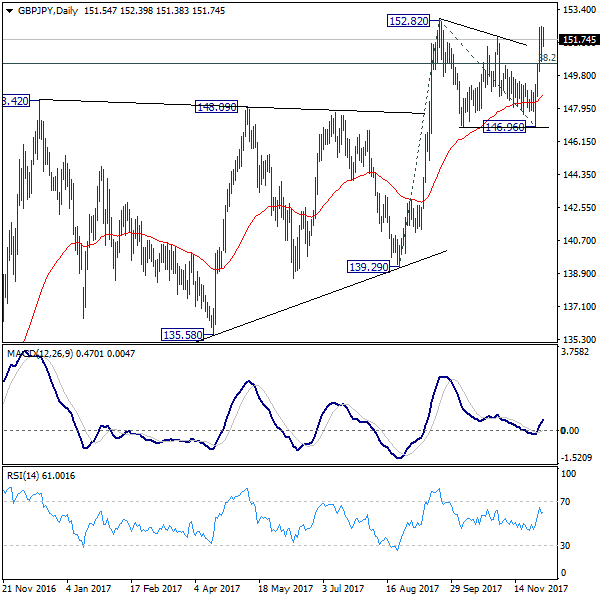
Intraday bias in GBP/JPY remains neutral at this point. We're favoring the case that consolidation from 152.82 has completed at 146.96 already. Break of 152.82 will resume medium term rally to 61.8% projection of 139.29 to 152.82 from 146.96 at 155.32. This will be the preferred case as long as 146.96 support holds.
In the bigger picture, medium term rebound from 122.36 is still expected to resume after consolidation from 152.82 completes. Firm break of 38.2% retracement of 196.85 to 122.36 at 150.43 will carry long term bullish implications. In that case, GBP/JPY could target 61.8% retracement at 167.78. However, break of 46.96 support will indicate rejection from 150.43 key fibonacci level. And the three wave corrective structure of rebound from 122.36 will argue that larger down trend is resuming for a new low below 122.26.
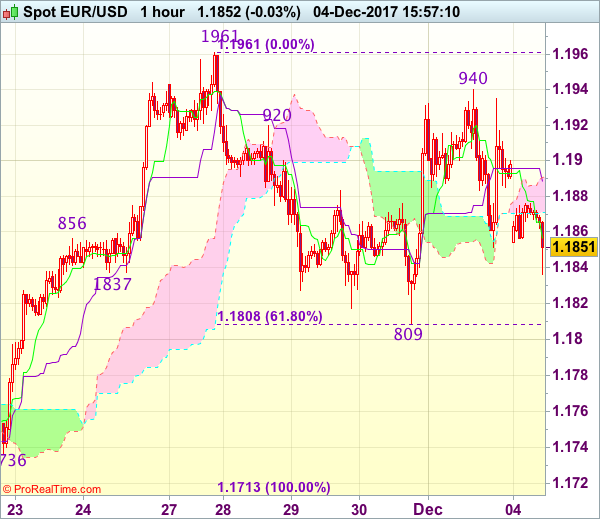
Trade Idea : EUR/USD – Sell at 1.1915
EUR/USD - 1.1868
Most recent candlesticks pattern : N/A
Trend : Near term up
Tenkan-Sen level : 1.1856
Kijun-Sen level : 1.1888
Ichimoku cloud top : 1.1891
Ichimoku cloud bottom : 1.1871
Original strategy :
Bought at 1.1865, stopped at 1.1855
Position : - Long at 1.1865
Target : -
Stop : - 1.1855
New strategy :
Sell at 1.1915, Target: 1.1815, Stop: 1.1950
Position : -
Target : -
Stop : -
As the single currency ran into resistance at 1.1940 on Friday and has retreated, suggesting further consolidation below resistance at 1.1961 (last week’s high) would be seen and weakness towards support at 1.1808-09 (61.8% Fibonacci retracement of 1.1713-1.1961 and previous support), however, break there is needed to retain bearishness and extend weakness to 1.1770 and possibly to support at 1.1736 but price should stay above previous key support at 1.1713.
In view of this, we are looking to sell euro on recovery as 1.1910-20 should limit upside and bring another decline. Above said Friday’s high at 1.1940 would revive bullishness, bring retest of 1.1961, break there would confirm early upmove has resumed for headway to 1.1990-00 which is likely to hold from here.
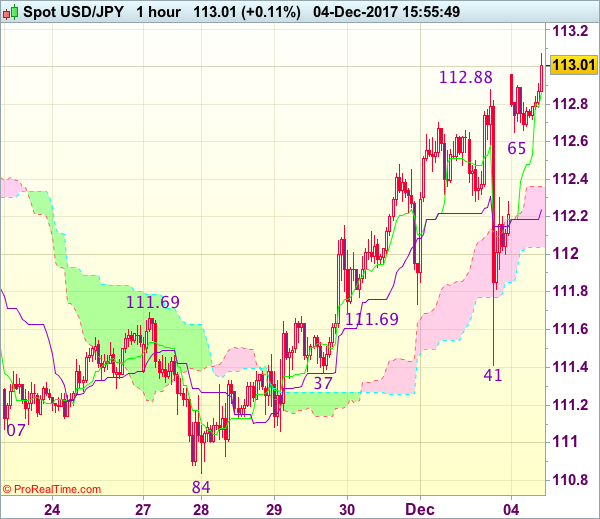
Technical Outlook: USDJPY – Bulls Pressure Cloud Top For Continuation On Break
Gap-higher opening on Monday and fresh extension higher which tests again the rising top of daily cloud (113.10), signals resumption of step upleg from 110.83, which showed hesitation on Friday's close in red. The dollar was inflated by passage of Senate US tax bill over the weekend and fresh bulls pressure strong resistances at 113.10 (cloud top) and 113.24 (Fibo 61.8% of 114.73/110.83 descend). Hesitation to clearly break higher could be expected as slow stochastic is overbought on daily chart. Dip-buying remains favored, with 20SMA offering solid support at 112.55 and extended dips expected to hold above 10SMA (111.84).
Res: 113.10, 113.24, 113.81, 114.45
Sup: 112.78, 112.55, 112.32, 112.84
Technical Outlook: GBPUSD – Corrective Pullback Could Extend To Key 10SMA / Fibo 38.2% Supports At 1.3368/53
Cable stands at the back foot at the beginning of the week, as last week’s double upside rejection at 1.3549 and Friday’s close in red weighs.
Risk of deeper pullback towards pivots at 1.3368/53 (rising 10SMA / Fibo 38.2% of 1.3038/1.3548 upleg) exists as indicators are reversing from overbought territory on daily chart and daily cloud twists later this week and could attract for further weakness.
Overall bullish bias sees dips as corrective and providing fresh buying opportunities, with 1.3350 zone seen as ideal reversal point, but deeper dips towards 1.3290/70 zone (50% retracement / rising 10SMA) cannot be ruled out.
Only firm break below 20SMA would generate stronger bearish signal and sideline bulls for deeper correction.
Res: 1.3513, 1.3549, 1.3570, 1.3600
Sup: 1.3418, 1.3368, 1.3353, 1.3290
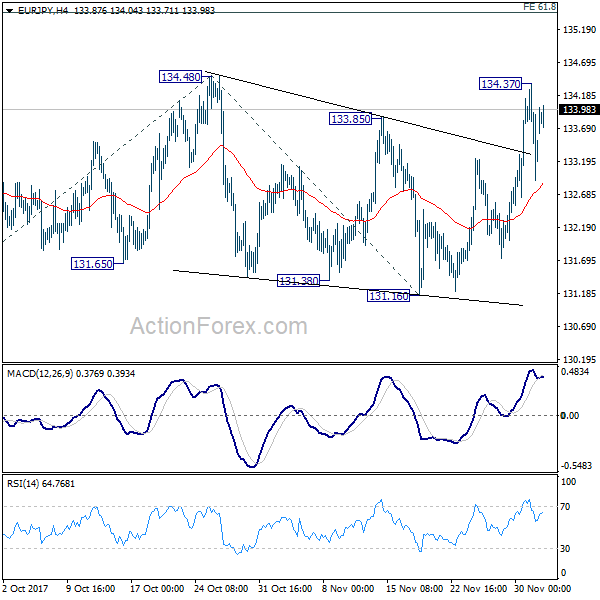
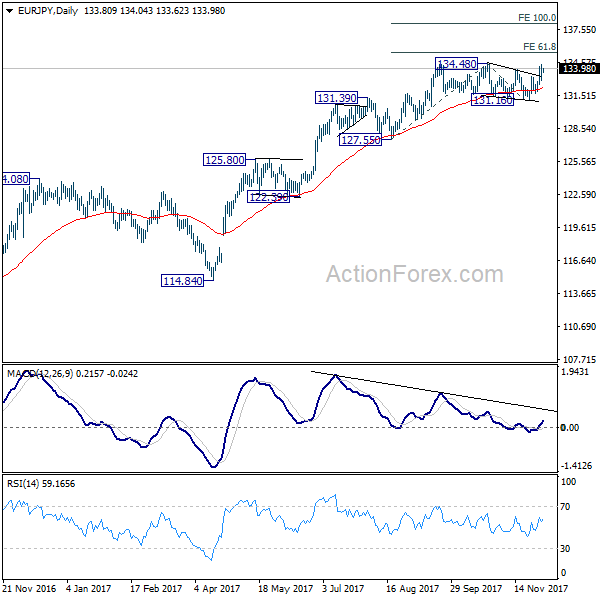
EUR/JPY Daily Outlook
Daily Pivots: (S1) 132.78; (P) 133.58; (R1) 134.25; More....
Intraday bias in EUR/JPY remains neutral for the moment. We're favoring the case that medium term up trend is nearly ready to resume. Break of 134.48 will target 61.8% projection of 127.55 to 134.48 from 131.16 at 135.44 and then 100% projection at 138.09. However, firm break of 131.16 support will now indicate near term trend reversal and turn outlook bearish for 127.55 key support.
In the bigger picture, medium term rise from 109.03 (2016 low) is seen as at the same degree as the down trend from 149.76 (2014 high) to 109.03 (2016 low). 61.8% retracement of 149.76 to 109.03 at 134.20 is already met. Sustained break there will pave the way to key long term resistance zone at 141.04/149.76. However, break of 127.55 support will suggest medium term topping and will turn outlook bearish for deeper fall back to 114.84/124.08 support zone at least.
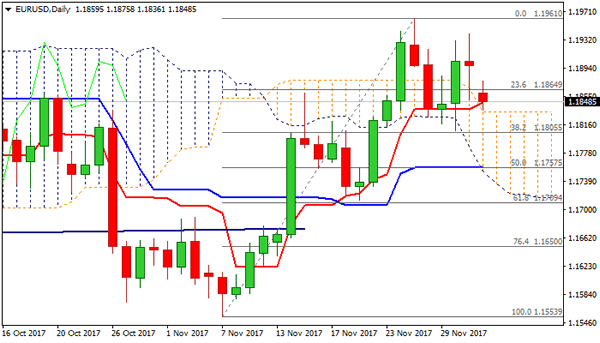
Technical Outlook: EURUSD – Daily Cloud Top Holds Weakness But Risk Of Further Easing Exists
The Euro opened with gap lower against the dollar on Monday after the greenback was boosted by progress in US tax cut plan over the weekend.
This also suggests more aggressive US rate hike, as Fed is meeting next week for the last time this year and markets widely expect the central bank to further raise interest rates.
The pair accelerated to fresh session low at 1.1836 (4-hr cloud base) at the beginning of European trading, after holding within narrow range in Asia. Fresh weakness broke below initial support provided by rising 10SMA (1.1856) and pressuring daily cloud top (1.1833) which marks next pivotal support.
Technical studies on lower timeframes turned to bearish mode and signal further easing, as negative sentiment is growing.
Key supports lay at 1.1808 (30 Nov trough) and 1.1805 (Fibo 38.2% of 1.1553/1.1961 ascend), with sustained break here to complete failure swing pattern on daily chart and generate stronger bearish signal.
Bearish extension below 1.1805 would look for test of 1.1757 (Kijun-sen/50% retracement) and 1.1709 (Fibo 61.8% of 1.1553/1.1961).
The upside should stay protected by hourly cloud (spanned between 1.1870 and 1.1890).
Res: 1.1875, 1.1890, 1.1940, 1.1965
Sup: 1.1836, 1.1805, 1.1780, 1.1757
Trade Idea : USD/JPY – Buy at 112.30
USD/JPY - 112.90
Most recent candlesticks pattern : N/A
Trend : Near term up
Tenkan-Sen level : 112.87
Kijun-Sen level : 112.24
Ichimoku cloud top : 112.36
Ichimoku cloud bottom : 112.04
Original strategy :
Bought at 112.00, stopped at 111.65
Position : - Long at 112.00
Target : -
Stop : - 111.65
New strategy :
Buy at 112.30, Target: 113.30, Stop: 111.95
Position : -
Target : -
Stop : -
Although the greenback retreated sharply on Friday to as low as 111.41, renewed buying interest emerged and the pair has rallied from there on dollar’s broad-based strength, reviving our bullishness for the rise from 110.84 low to extend gain to previous support at 113.09, however, near term overbought condition should limit upside to resistance at 113.33 and reckon 113.60-70 would hold on first testing.
In view of this, we are still looking to buy dollar on pullback as the Kijun-Sen (now at 112.24) should limit downside. Below 111.80 would defer and risk weakness to 111.60 but only break of said support at 111.37-41 would abort and signal top is formed instead.