Sample Category Title
Technical Outlook: US CRUDE OIL – Extended Rally Cracks Key $57.90 Barrier
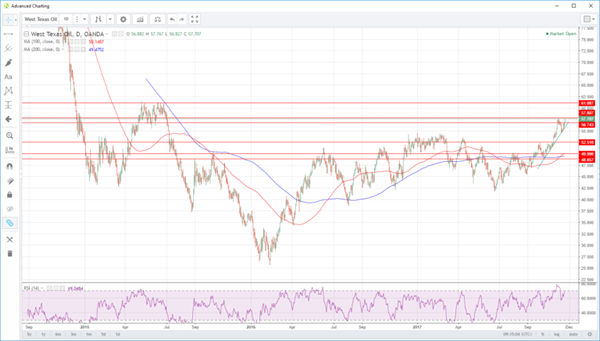
WTI Oil rose further on Wednesday, extending bullish acceleration of the previous day and cracked target at $57.90 (08 Nov former top).
Bullish near-term structure was boosted by disruption of Canada – US pipeline and API crude stocks report which showed bigger than expected draw in crude inventories.
Full retracement of $57.90/$54.80 pullback is bullish signal for continuation of broader uptrend, however, the price may show stronger hesitation to finally break higher on overbought slow stochastic on daily chart.
Consolidation should ideally stay above $57.00 handle (session low) with extended downticks to be contained by 10SMA ($56.42) to keep bulls intact.
Otherwise, increased downside risk could be expected on sustained break below 10SMA, with scenario being supported by bearish divergence, forming on daily RSI / MACD.
EIA weekly crude stocks report is in focus today. Inventories are expected to fall by 1.5 million barrels, compared to last week’s build of 1.8 million barrels. Release at forecasted level or below is expected to further boost oil price.
Close above $57.90 will be strong bullish signal.
Res: 57.96, 58.63, 59.08, 59.82
Sup: 57.51, 57.02, 56.42, 55.73
Santa Claus Rally Begins, Gold Price Pushes Higher
Christmas rally start early
Looks like stock Christmas rally has already begun (although some would argue it never stopped). The World MSCI has now hit the highest level since March. While VIX index has declined to near historical lows (EURUSD 1 month volatility and US treasury yields are also falling last week’s spike). The catalyst was growing expectations for consumer spending for the holiday season starting with “Black Friday. ” In addition fed Chair Yellen over nigh warned that tightening policy via interest rates to quickly could keep consumer inflation from reaching 2% target. This dovish comment further indicate that risk of steeper policy path is skewed to the downside and gave stocks a boost as policy will likely stay loose for longer.
Yellen went on to say that removing accommodation too slowly could increase the risk of an strong labor market. However, this comment is already in line with Fed think. The flattening of the yields curve has not helped the USD as the curve suggest that expectations for Fed Fund rate has peaked. The market has already fully-priced in a December Fed rate hike and now is waiting for a new chair (likely Jerome Powell) gets sworn in. As for today trading volume have already decelerated as despite US data heavy calendar of durable goods orders, U-Michigan consumer sentiment, jobless claims and FOMC Minutes American traders are focused on Thanksgiving and the rest of the world could see some downtime.
Gold prices are holding strong
The precious metal is pushing higher. Later last week, Gold challenged $1300 before bouncing lower. The momentum is largely bullish, which underpins global uncertainties. In particular geopolitical uncertainties are strong for the future.
We also believe that inflation is back and will push the commodity prices towards new high. One indicator that we follow, the NY Fed’s UIG inflation is showing consumer prices data growth slightly below 3%. In the same time we see most central banks loading up on Gold, such as the PBoC, Russia and China.
The Fed is very cautious by increasing rates and we maintain that the strategy is to kill the massive debt with inflation which is why we should see gold going higher in the medium-term. $1300 is an easy target. Yet, the dollar may further weaken as following this thinking, the Fed should not raise rates much. The central bank is anyway stuck with its current monetary policy as it cannot raise rates as it would trigger a bond bubble burst. The Fed knows perfectly what they do and the mixed signals they usually send are there to let the time to inflation to develop.
Keystone Cops Chase Crude Oil Higher
Keystone pipeline travails and a more substantial than expected drop in crude inventories saw crude gush higher in Asian trading.
WTI races higher in Asian trading as TransCanada announced it would reduce shipments by 85% on its Keystone crude pipeline until the end of November. It is due to its attempts to fix a leak in the pipeline and today’s announcement raised temperatures amongst traders as the pipeline carries 600,000 barrels of oil a day to U.S. refineries. The decision caught the street by surprise and implies both oppositions will increase again to the new Keystone XL pipeline, and that the initial leak may be a somewhat more serious problem than at first thought.
Overnight, crude had pushed higher, buoyed by the American Petroleum Institute (API) Crude Inventories, which showed a surprising 6.356 million drawdown against survey expectations of a 2.1 million barrel drop. Brent finished 0.80% higher at 62.75 and WTI climbed a respectable 1.30% to close at 56.80.
The favourable climate has continued in early Asia with Brent marching 0.80% higher to trade at 63.30. WTI was even more impressive, climbing another 1.35% to 57.65, leaving it within a hair’s breadth of its 2 ½ years highs at 57.80 set earlier this month. The street will be looking towards tonight’s official U.S. Crude Inventories for further confirmation that inventory drawdowns are back on track after last week’s glitch.
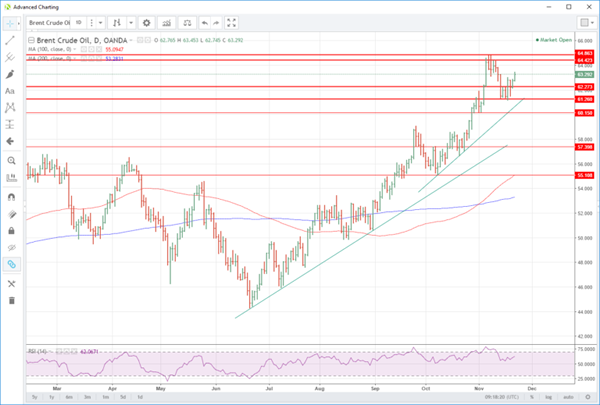
Brent Crude has resistance at 63.30 with a break reopening a test of its major resistance zone, the daily double tops at 64.40 and 64.85. Support remains at 62.25 followed by the far more significant 61.25, a series of four recent daily lows.
WTI spot looks the more interesting of the two contracts today. It appears poised to test the 57.80 high set last week, and a break will almost certainly trigger some stop-loss buying. The technical picture shows no resistance until 61.00, and thus a daily close above 57.80 sets the scene for a possibly significant new leg to the rally. Support appears at 56.75, the day’s low followed by its medium-term trend line support at 55.75 that has held all pullbacks of the last two months in almost textbook fashion.
Technical Outlook: AUDUSD – Limited Recovery Despite Bullish Signal
The Aussie dollar ticked higher today following positive close on Tuesday which formed bullish outside day but so far without stronger attempts higher.
Extended daily tech signal recovery, with upside attempts being so far capped under falling 10SMA (0.7601).
Break here is needed to signal further recovery which could extend towards descending 20SMA (0.7637).
Otherwise, expect immediate focus to remain at the downside, with sustained break below weekly 100SMA (0.7544) needed to generate signal of bearish continuation.
Res: 0.7601, 0.7612, 0.7637, 0.7665
Sup: 0.7544, 0.7530, 0.7516, 0.7475
Trade Idea: GBP/USD – Stand aside
GBP/USD – 1.3252
New strategy :
Stand aside
Position: -
Target: -
Stop:-
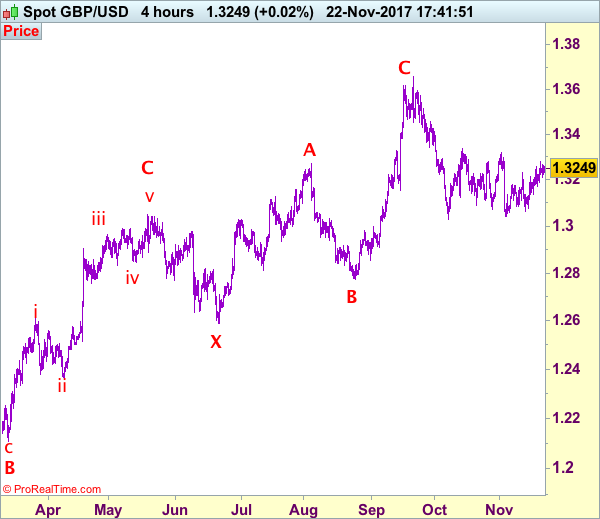
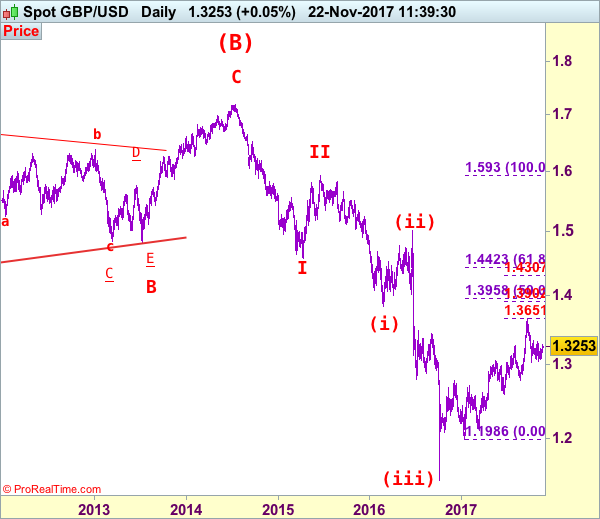
Although cable has continued trading with a relatively firm undertone after recent rebound and marginal gain above resistance at 1.3260 (last week’s high) cannot be ruled out, as broad outlook remains consolidative, reckon upside would be limited to 1.3300 and reckon resistance area at 1.3321-38 would hold and bring further choppy trading later. Our preferred count is that (pls see the attached chart) the wave IV is unfolding as a complex double three (ABC-X-ABC) correction with 2nd wave B ended at 1.2774, hence 2nd wave C could have ended at 1.3658.
On the downside, whilst pullback to 1.3200 cannot be ruled out, reckon minor support at 1.3170 would contain downside and bring another rise later. A drop below 1.3170 would bring test of 1.3130-35 but break there is needed to signal the rebound from 1.3039 has ended and bring weakness to 1.3100 first, however, reckon support at 1.3062 would hold from here.
Our preferred count on the daily chart is that cable's rebound from 1.3500 (wave (A) trough) is unfolding as a wave (B) with A ended at 1.7043, followed by triangle wave B and wave C as well as wave (B) has ended at 1.7192, the subsequent selloff is the larger degree wave (C) which is still unfolding with minor wave (III) of larger degree wave 3 ended at 1.1986, hence wave (IV) correction is in progress which could either be a triangle wave (IV) of a complex formation but upside should be limited to 1.3500 and price should falter well below 1.4000, bring another decline in wave (V) of 3 for weakness to 1.1500, then 1.1200.
Trade Idea: GBP/JPY – Stand aside
GBP/JPY - 148.55
New strategy :
Stand aside
Position: -
Target: -
Stop:-
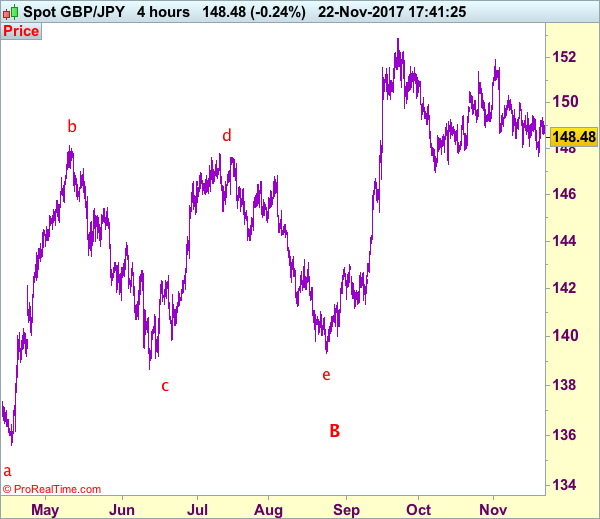
Although sterling fell to 147.65 earlier this week, the subsequent rebound suggests consolidation above this level would be seen and recovery to149.00, then 149.45-55 cannot be ruled out, however, reckon resistance at 149.70 would cap upside and bring retreat later. Only a break above this level would signal the fall from 151.90 top has ended and bring further subsequent gain to 150.00 resistance, then towards another previous resistance at 150.30 which is likely to hold from here.
On the downside, below 148.00-10 would bring retest of said support at 147.65, break there would signal the erratic decline from 151.90 top is still in progress, bring retracement of early rise to support at 147.30, then 146.90-00 but oversold condition should limit downside to 146.40-50, bring another rebound later. As near term outlook is still mixed, would be prudent to stand aside for now.
Our preferred count is that larger degree wave V with circle is unfolding from 251.12 with wave (I) 219.34, (II): 241.38 and wave (III) is subdivided into 1: 192.60, 2: 215.89 (23 Jul 2008) and wave 3 ended at 118.87 earlier in 2009. The correction from there to 162.60 is wave 4 which itself is a double three and is labeled as first a-b-c ended at 151.53, followed by wave x at 139.03, 2nd a ended at 162.60, 2nd b at 146.75 and 2nd c leg of wave 4 ended at 163.00. Therefore, the decline from 163.00 to 116.85 is now treated as wave 5 which also marked the end of larger degree wave (III), hence wave (IV) major correction has commenced for retracement of the wave (III) from 241.38 and upside target at 183.95-00 (50% Fibonacci retracement of the wave (II) from 241.38) had been met, a drop below 160.00 would suggest wave (IV) has ended at 195.85, bring decline in wave (V) for initial weakness to 130 (already met) and 120.
US Durable Goods Orders, FOMC Minutes Makes Headlines
A light release schedule will circulate through the financial markets on Wednesday, as US investors begin closing out their positions ahead of Thanksgiving.
The first event of note takes place at 08:00 GMT when the European Central Bank (ECB) holds its non-monetary policy meeting. Although monetary policy is off the table, central bankers may discuss issues that impact the Eurozone economy. The ECB has already embarked on a plan to begin winding down quantitative easing. However, that plan also leaves the door open to extending the stimulus package for longer than previously expected.
In the United Kingdom, the Treasury will issue its Autumn Forecast Statement at 12:30 GMT. The statement provides an updated economic outlook and previews the government’s budget over the next year. This includes anticipated spending and income levels.
Shifting gears to economic data, the Mortgage Bankers Association (MBA) will release its weekly report on US mortgage applications for the period ended 17 November. That report is due at 12:00 GMT.
A half hour later, the Department of Labor will report on initial jobless claims for the week ended 18 November. The number of Americans filing for first time unemployment benefits is expected to drop by 9,000 to a seasonally adjusted 240,000. Continuing jobless claims, which track the number of people still receiving unemployment benefits, is expected to rise to 1.1882 million in the period ended 10 November.
The day’s biggest data release of the session will come at 13:30 GMT when the Commerce Department issues its monthly report on durable goods orders. Orders for long-lasting manufactured goods are forecast to climb 0.3% in October following a 2.2% gain the previous month. Excluding transportation equipment, durable goods orders are projected to climb 0.5%.
The Federal Reserve will release the minutes of its most recent policy meeting at 19:00 GMT. The Federal Open Market Committee (FOMC) voted to keep monetary policy on hold on 1 November in a move that was widely predicted by the financial markets. The US central bank will hold one more rate meeting this year, where it is widely expected to hike rates.
EUR/USD
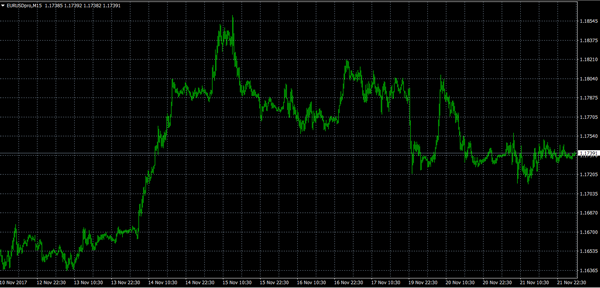
The euro continued to trade within a narrow range on Tuesday, as prices hovered in the mid 1.1700 region. The EUR/USD exchange rate remains firmly capped below 1.1800. The US dollar could provide the necessary catalyst for movement on Wednesday ahead of the holiday.
GBP/USD
Cable edged slightly higher on Wednesday, but remained capped below the 1.33 US level. The GBP/USD pair continues to trade within a 100-pip range as markets await the latest cues on Brexit negotiations.
GBP/USD Elliott Wave Analysis
GBP/USD – 1.3253
Although cable has recovered after finding support at 1.3039 earlier and gain towards 1.3338 resistance is likely, above there is needed to retain bullishness and signal the fall from 1.3658 top has ended at 1.3027 earlier and bring a stronger subsequent bounce to 1.3400 and possibly towards resistance at 1.3455. Having said that, if our view that top has been formed at 1.3658 is correct, upside would be limited to 1.3500-10 and bring another decline later.
Our preferred count on the daily chart is that cable's rebound from 1.3500 (wave (A) trough) is unfolding as a wave (B) with A ended at 1.7043, followed by triangle wave B and wave C as well as wave (B) has possibly ended at 1.7192, below support at 1.4232 would add credence to this count, then further fall to 1.4000 level would follow but reckon downside would be limited to 1.3655 support and price should stay above previous support at 1.3500.
On the downside, if said resistance at 1.3338 continues to hold, then further consolidation would take place and retreat to 1.3190-00 cannot be ruled out, however, reckon pullback would be limited to 1.3090-00 and support at 1.3062 should hold, bring another rebound later. Only a drop below indicated strong support area at 1.3027-39 would revive bearishness and confirm the fall from 1.3658 top has resumed for weakness to 1.3000, then towards 1.2950 but support at 1.2909 should limit downside and another previous support at 1.2852 would remain intact.
Recommendation: Buy at 1.3090 for 1.3290 with stop below 1.2990.
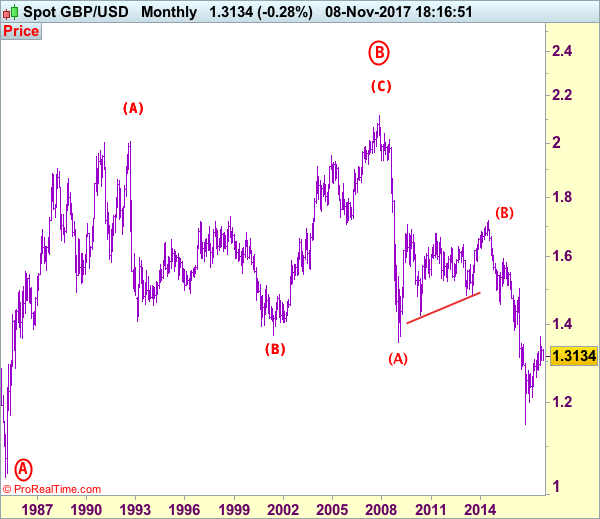
Longer term - Cable's rise from 1.0520 (Feb 1985) to 2.0100 (September 1992) is seen as [A], the decline to 1.3682 is labeled as (B) and (C) wave rally has ended at 2.1162 (9 Nov, 2007) which is also the top of larger degree wave B with circle. The selloff from there is a 5-waver with wave (A) ended at 1.3500 (23 Jan 2009), wave (B) itself is labeled as A: 1.6733, triangle wave B: 1.4813 and wave C as well as top of wave (B) ended at 1.7192 (2014), hence the selloff from there is an impulsive wave (C) with wave I : 1.4566, wave II 1.5930, an extended wave III is unfolding and already exceeded our downside target at 1.3500 and 1.3000, hence weakness to 1.2500 and possibly 1.2000 cannot be ruled out, however, price should stay well above psychological level at 1.0000.
Technical Outlook: USDJPY Attacks Daily Cloud Top Again
Fresh bearish acceleration on Wednesday pressures again key supports at 111.90 zone (top of rising daily cloud / Fibo 38.2% of 107.31/114.73 ascend), which contained previous attacks last Fri/Mon.
Extension of bear-leg from 112.70 where recovery attempts were repeatedly rejected, shows scope for eventual break through 111.90 and another strong support at 111.70 (converged 100/200SMA’s) to signal bearish continuation.
However, the pair may show further hesitation before breaking lower. Extended consolidation should be capped under 112.70 lower top to keep bearish structure intact.
Alternative scenario would see lift above 112.70 and falling 10SMA (111.90) as reversal signal.
Res: 112.47, 112.70, 112.91, 113.19
Sup: 111.90, 111.70, 111.02, 110.37
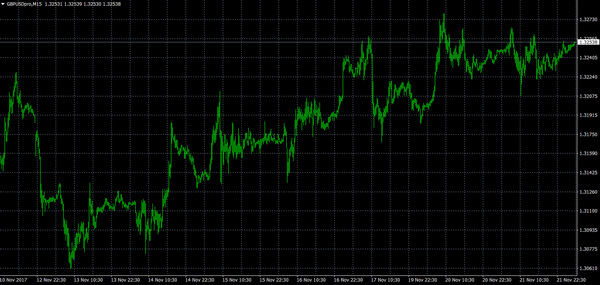
Technical Outlook: GBPUSD – Daily Cloud Top Continues To Limit Bulls
Cable maintains firm tone but so far unable to break above daily cloud top and Fibo 38.2% of 1.3655/1.3026 (1.3261/66) which mark key near-term barriers.
Yesterday's action ended in Doji candle, signaling indecision, but today's trading is holding near highs and offsetting negative signals for now.
Techs are bullishly aligned and supportive (10/20 and 10/30SMA's bull-crosses / strong momentum) for further advance.
Final break above daily cloud would open 1.3300 zone (upper 20-d Bollinger band / trendline resistance) which guards key s/t barriers at 1.3320/37 (01 Nov / 13 Oct peaks).
Eventual break above cloud top would open way towards key s/t barriers at 1.3320/37 (01 Nov / 13 Oct peaks), with stronger bullish acceleration capable of travelling towards 1.3415 (Fibo 61.8% of 1.3655/1.3026).
Daily cloud base marks key support at 1.3214 which is expected to ideally hold, with extended dips to be contained at 1.3180 zone, to keep near-term bulls in play.
Res: 1.3266, 1.3291, 1.3309, 1.3320
Sup: 1.3232, 1.3214, 1.3180, 1.3128